
TraderKim
1K posts

TraderKim
@orderflowtrade3
Currently learning orderflow for /ES. Don’t be afraid to do what you feel is right. opinions don’t matter. A lady learning to trade. #girlpower
Asia Katılım Nisan 2019
127 Takip Edilen238 Takipçiler


Moment of truth --- this was held over the weekend . never closed a thing. Lets see what happens here shortly #ES_F
Haus@AMTbalance
still holding - lets see how Sunday open plays out. Have a good friday everyone
English
@iV_trader so 6/7 we should get long, but tomorrow we are getting a new low? not sure how this adds up.. lol
English

Model now showing a low coming tomorrow at some point.
Idk if it tracks !!
Too much news real or fake.
For today the intraday model showing heavy resistance at 6600 and for the most part a very thin profile.
Ivan@iV_trader
Hi 👋 Update. ? $SPX
English
TraderKim retweetledi

@notcryptonative The cognitive architecture papers:
redlinerising.com/papers
The applied measurement layer:
redlinerising.com/redline-index
riskefficacy.org/registry
The book: Risk Efficacy: How to Measure Decision Making in an Age of Uncertainty (2026).
English
TraderKim retweetledi

$PL looking good. especially with that magnet at July $45 call
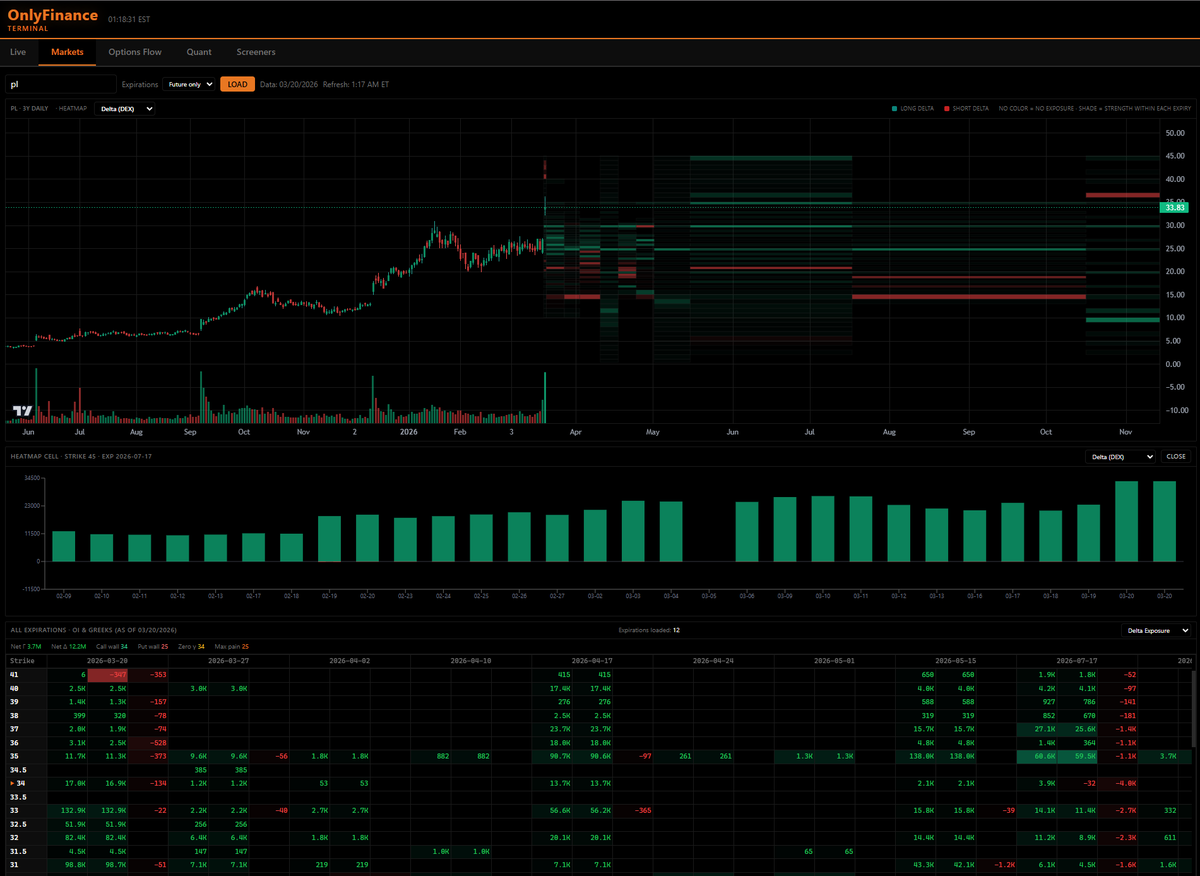
Jeff Sun, CFTe@jfsrev
High-Momentum Leaders: 19 Stocks Showing Expanding Relative Strength $PL — Aerospace & Defense $CF — Agricultural Inputs $CRCL — Capital Markets $CIEN — Communication Equipment $LITE — Communication Equipment $SNDK — Computer Hardware $STX — Computer Hardware $WDC — Computer Hardware $APA — Oil & Gas E&P $FTI — Oil & Gas Equipment & Services $VG — Oil & Gas Midstream $LNG — Oil & Gas Midstream $AXTI — Semiconductor Equipment & Materials $TSEM — Semiconductors $FSLY — Software - Application $NBIS — Software - Infrastructure $SEDG — Solar $LYB — Specialty Chemicals $GEV — Specialty Industrial Machinery Note: Hottest Stock Screener Chapter 3.2, jfsrev.substack.com/my-trading-too… @finviz_com - bit.ly/finvizelite
English

Thanks to AI coding, a complex learning process is now much simpler. I filtered the top 7% YTD stocks from 2000–2026 (including delisted ones), get 1400+ stocks, and visualized them with TradingView Lightweight Charts, featuring auto-marked highs/lows and direct period displays. Browse by year or symbol, even delisted stocks from the last decade like $LVGO and $TWTR are fully accessible.
Once I refine the charting and annotation features, I will open-source this learning project.
Will Hu@traderwillhu
The Path to Trading Mastery: Research and Pattern Recognition By Qullamaggie 1. Step-by-Step Market Research The easiest way to start is to research the markets thoroughly. First, get a platform like TC2000 and set your charts to the monthly timeframe. Create a watchlist of all US stocks and filter them by dollar volume instead of just share volume. Aim for liquid names—those with at least $1 billion to $10 billion in monthly dollar volume—to avoid "super thin" or illiquid stocks. 2. Identifying the Big Movers Go through the entire database (roughly 5,000 stocks) and identify the outliers. Look for stocks that: At least doubled in price within six months. Increased 200–300% within a single year. Gained 400–500% over three to four years. Create a separate watchlist for every single stock that has made these massive moves. You will likely end up with a few hundred highly liquid, historical winners. 3. Studying Chart Patterns Go back as far as the 80s or 90s and study their chart patterns. Stocks move in very specific ways. These same patterns occur over and over again—there is nothing truly new in the markets. While there are variations, the patterns that worked in the 90s are the same ones you see today. Focus primarily on price action. You can add a few indicators if you wish—I recommend moving averages—but don't use too many. "Too many indicators is for suckers." Study how these big winners acted during pullbacks: Which moving averages did the best stocks respect or "obey"? How did they behave before the breakout? How did they act once the move was underway? 4. Building Your Mental Database (The 2,000-Hour Rule) Your goal is to build a database in your head. Spend 1,000 hours doing exactly this: printing out charts, studying them, and saving them. (I personally use Evernote to store tens of thousands of these charts). Once you understand the price action, spend another 1,000 hours researching the fundamentals and the news behind those moves. What was driving them? What made a stock go up 500% in a year? If you put in those 2,000 hours of deep research, I promise you: before you know it, you’re going to have ten million dollars in your account.
English

TraderKim retweetledi

@mickomode @BrettSimba Does your quantower lag everytime the market opens? I’m getting 30-40k ms lag every market open
English

@BrettSimba love ur firm but please for the love of god add rithmic so we can use quantower
English


Wife has dr Apt’s for our baby so only scalps during 6am hour for about 30 points between in and out. 7am in waiting room waited for 830 news and then hit entry and 7am bottom retest tp for 20 points since can’t hold and out. 50 points. Trading is absolute freedom. Sonogram day.

English
TraderKim retweetledi
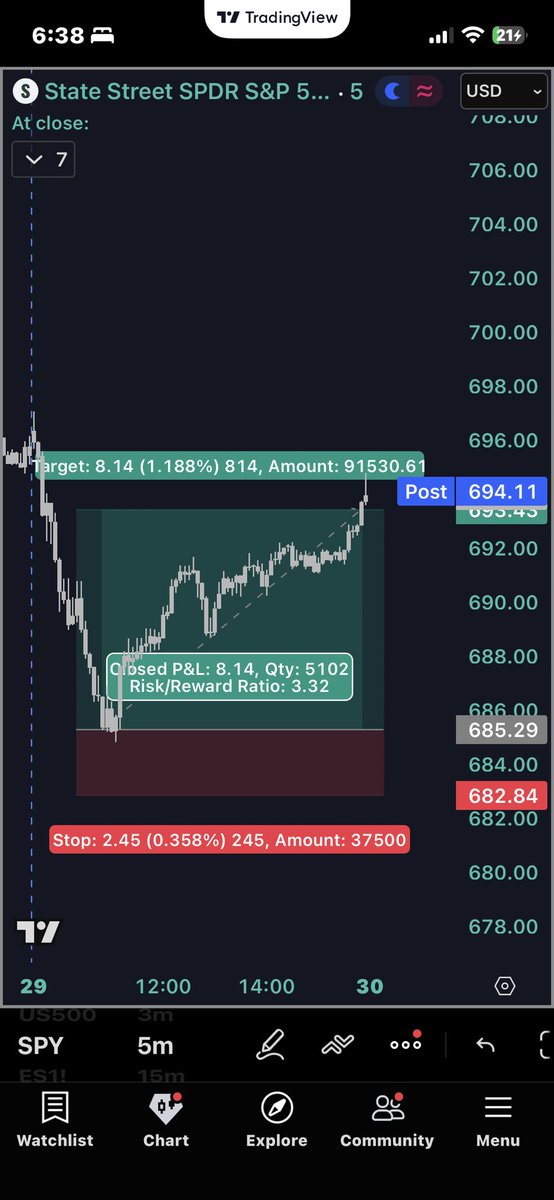
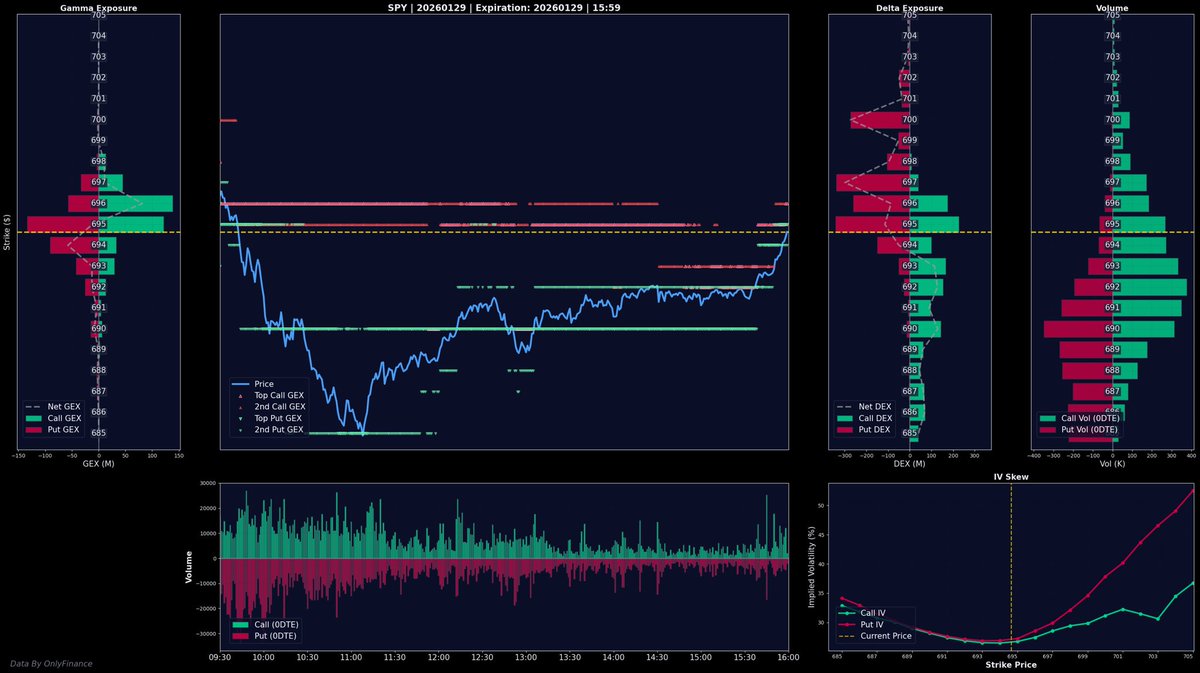
So some people asked why I went long when $SPY hits $685 area, I just simply show them this dashboard.
$VIX complex also shown the confirmation as well.
Overall good long with this kinda #Volatility.
Took the long with $ES_F futures. $SPX

English

So ur saying the dip is done?
Philip Pilkington@philippilk
If you measure it in gold instead of in dollars, the US stock market has basically collapsed. 📉
English
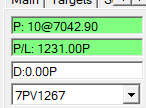
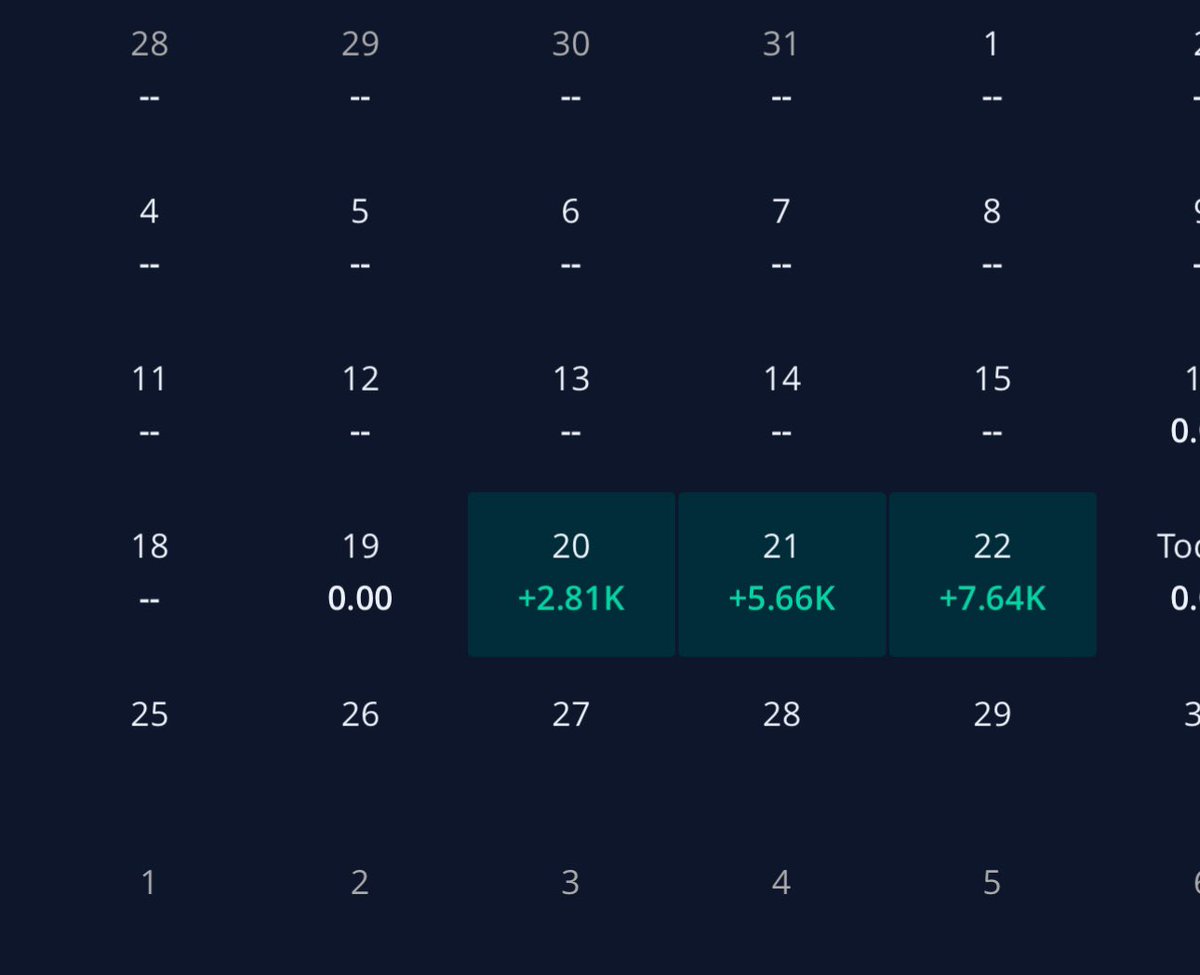
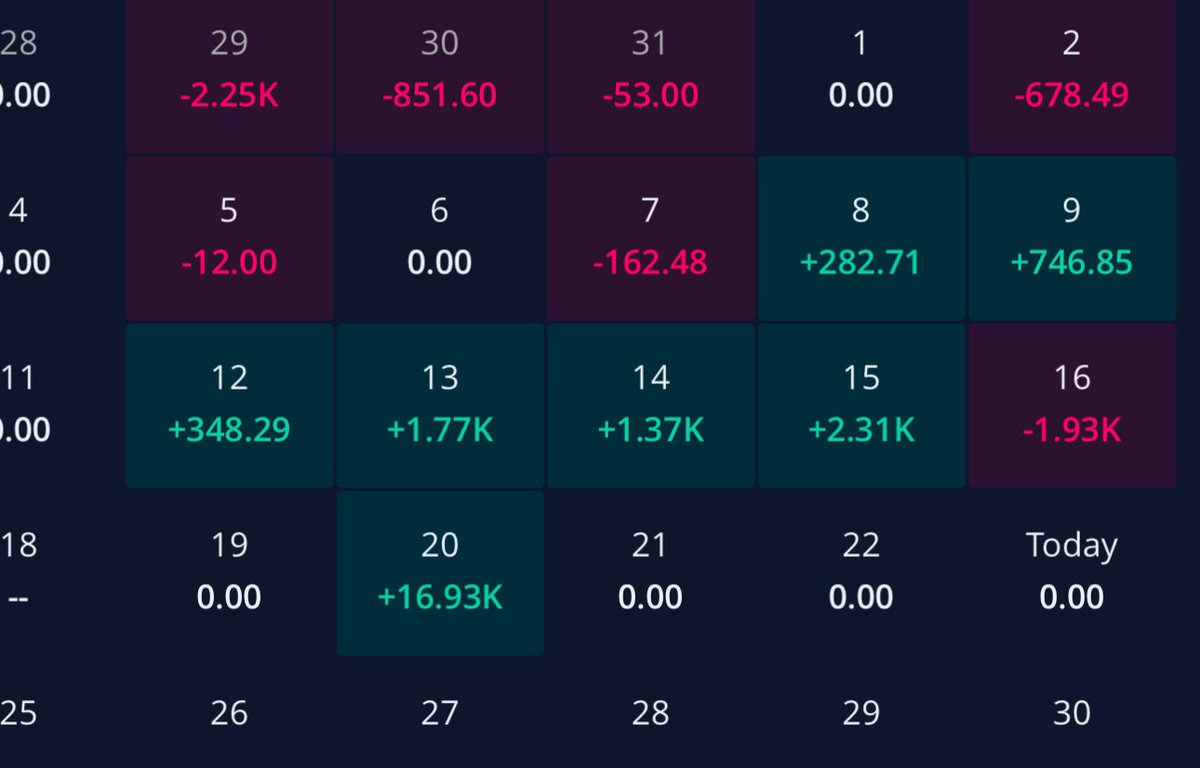
Not sure why but I’m always fire on the new year. Here’s my two accounts I trade on, not including long term / crypto/ poly. Maybe I’ll go on a 3rd generational run.
If it gets crazy I’ll stream for a throw back
English
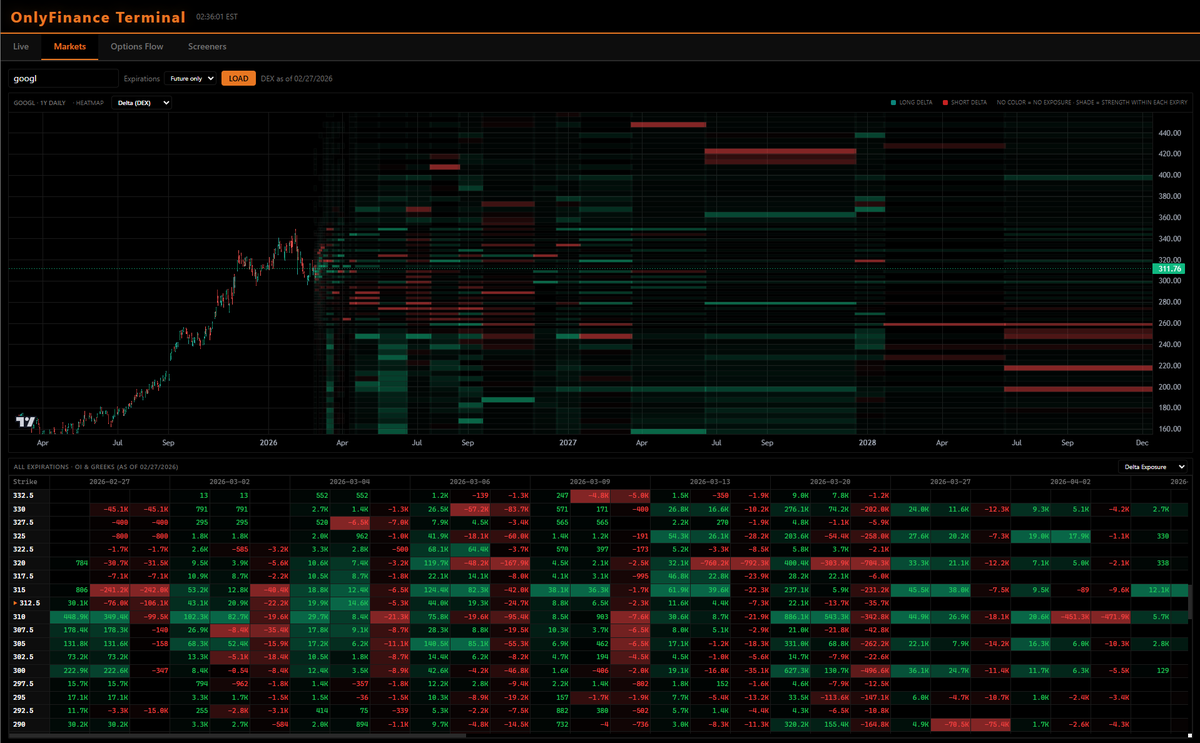
TraderKim retweetledi
Finalising the site view..
Will be streaming as and when for free
$SPX $SPY $VIX $QQQ

English