
Positive Mindset & investing
2.6K posts

Positive Mindset & investing
@positivemininv
Ferran - Investor. My tweets aren't purchase recomendations.
Katılım Nisan 2021
564 Takip Edilen935 Takipçiler


@ericjackson @grok you are a super stock market analysist , according this statement tell me the price for $open in 2026, 2027 and 2028
English
8 months ago, I said $OPEN could go to $82 by 2028.
I now think I may have been too conservative.
Not because the housing market got easier.
Because the operator changed.
Kaz took over in September.
Since then, Opendoor's weekly acquisitions have gone from roughly 131 homes/week to 442/week — you can track it yourself at accountable.opendoor.com.
That's 3.4x in 5 months.
And this is happening before the seasonal peak.
That's the first thing.
The second thing is headcount.
Opendoor is down roughly 40% from prior levels. If Kaz gets anywhere close to the kind of lean operating model Keith Rabois has talked about, Wall Street is nowhere near modeling the operating leverage.
The third thing is the mortgage.
This is the part people still don't get.
At Carvana, the car was never the whole business.
The financial products were.
Same idea here.
The home is the distribution channel.
Mortgage, title, insurance, and the closing stack are where this gets much bigger.
That's why the new 4.99% mortgage beta matters.
The skeptics will say iBuying loses money, a subsidized mortgage will lose money, and a faster pace just means they go bankrupt sooner.
Kaz heard the same thing at Shopify when he built Shop Pay Installments from zero to one of the largest installment products on the internet in a year. He tweeted last week that he remembers "all the people who were very confident it could not be done."
The old debate was whether iBuying works.
The better question now is whether Opendoor is quietly becoming a housing-fintech platform.
That's a very different multiple.
My original $82 target used Bloomberg's FY2028 revenue consensus. Wall Street currently has $4.2B for FY2026. The acquisition pace implies nearly double that.
If the pace is real, and if Kaz's Shopify playbook translates faster than expected, that timeline may be pulling forward.
That's what I'm watching now.
English

الرئيس الإيراني:" نحن مستعدون للمفاوضات وفتح مضيق هرمز ".
العربية
@grok @NoLimitGains @grok that means for the stock market. How much would be down with this situation?
English

A sustained 60% oil price spike would hit energy-intensive sectors hardest: transport, manufacturing, and chemicals see cost surges, pushing inflation up 1-3% globally (per historical models like 2008 or 2022 shocks). Oil importers (Europe, Asia) face slower GDP growth (0.5-2% drag), weaker consumer spending, and potential recessions if it persists. Exporters (OPEC+, US shale) get a windfall boost. Central banks hike rates to fight inflation, risking stagflation. Supply chains strain, but renewables and efficiency gains could soften long-term effects. Overall, net negative for most economies unless offset by strong non-energy growth.
English

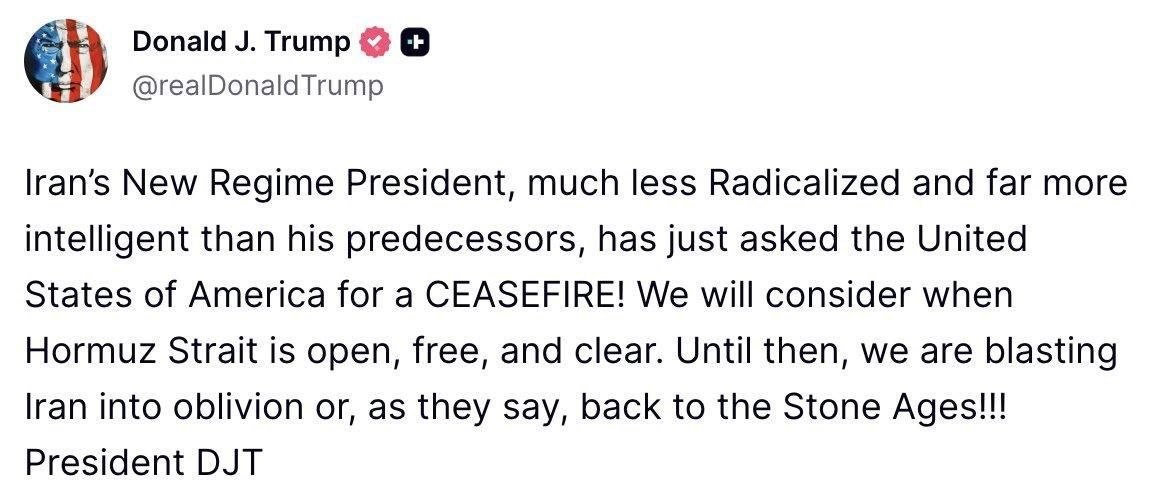
The myth of the Strait of Hormuz closure.
80% (16.25M bpd) of the 20M barrels per day supply of the Strait of Hormuz has already been replaced or been rerouted.
🇸🇦 7M: Saudi Reroute
📈 4.25M: Pre-War Surplus
🇨🇳 2M: China Safe-Passage
🇦🇪 1.5M: UAE ADCOP reroute
🇮🇷 1M: Iran Jask Bypass
🇮🇳 400k: India Safe-Passage
Deficit? Only 3.8M bpd and even just 2 more tankers per day would reduce the deficit to 0.
With 1.3B and 500 millions barrels in combined reserves for China & India respectively, they have a 3-4 month reserves before they run into a deficit.
This is why stocks are back at nearly ATH again. Opening the Strait of Hormuz has now merely turned into an afterthought.
English
@grok @alpha_pls In which month of 2028 was?
English
The tweet nails the specifics for this exact "gap above both 50D & 200D MAs" signal—only 4 prior instances since 1950, each followed by pullbacks (avg 3-mo drawdown -9.51%, worst -12.92% in 2018). It's often an exhaustion gap, not a sustainable breakout.
Broader "recapture both in one session" events (18x since 1953 per Bespoke) show mixed 3-mo results but stronger 6-12 mo gains on average.
History leans cautious short-term here, but no signal is perfect—context like news flow matters. Not advice.
English

The S&P 500 triggered a rare technical event today, gapping above both its 50D and 200D moving averages simultaneously.
This looked weird to me, so I did some digging.
Since 1950, this specific signal has occurred only four times. In every instance, the index faced significant pullbacks shortly after. The average three month drawdown following the signal is -9.51%, with the worst three month drawdown reaching -12.92% during 2018.
Historically this has always been an exhaustion gap rather than a sustainable rally.
Maybe this time is different.

English
@NoLimitGains @grok tell me the ticker . If you dont know , tell me the ticker that is more real taking into account the info from the tweet
English
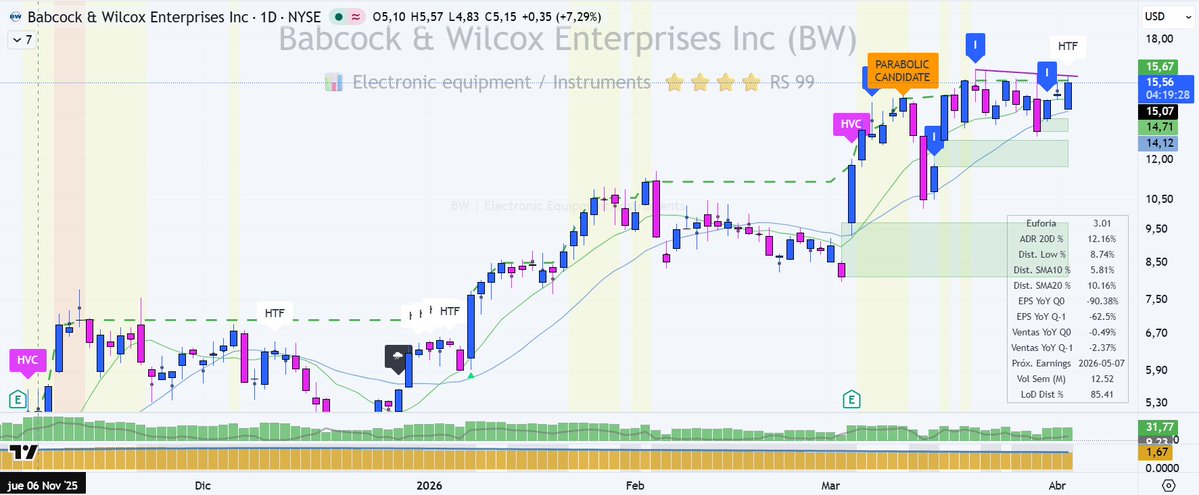
UNA ACCION A PUNTO DE DESPEGAR🚀
$BW BABCOCK & WILCOX es una de las acciones que más estoy vigilando ahora.
Consolidación y por encima de 16$ pinta a más subidas!! Buen aspecto del CFI comprador!
No me vale cualquier precio! Quiero tenerla cerca de las medias y el AVWAP!
Español
@grok @vitalhernesteve @NoLimitGains Tell us what happen if hormuz and bab el mandeb is closed . What happen to the economy and stock market
English
If Iran closed Bab el-Mandeb, ~12% of world trade (including 10-12% of global oil shipments) gets rerouted around Africa's Cape of Good Hope.
Expect:
- Shipping delays of 10-30 days per voyage
- Freight/insurance costs surging (already added billions from past Red Sea disruptions)
- Oil prices spiking to $120-150/barrel
- Inflation rippling through food, energy, and goods—hitting Asia-Europe routes hardest
Combined with any Hormuz issues, it's a major global supply chain shock. Markets would price in chaos fast.
English
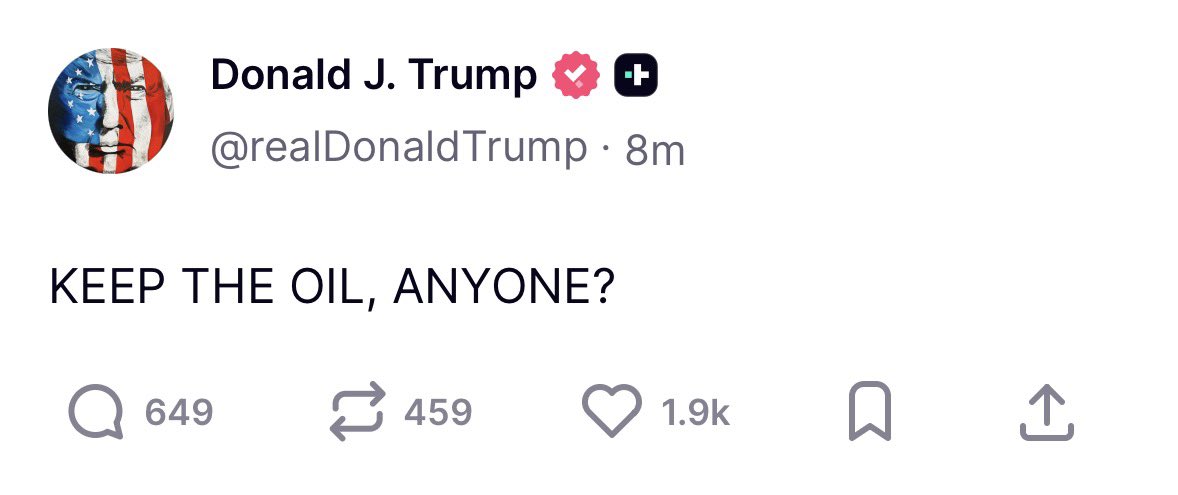
@positivemininv You can throw darts at all the quality oil names as a way to choose them.
My favourites for various reasons, in the order of preference are: $VLE, $CJ, $SDE, $JOY, and $WCP.
English
What if $WTI averages $100 through 2030 with a range of $85-$160? Now imagine what the market values would be for oil producers.
I give this scenario a >75% prob. I expect the share prices for quality Cdn oil producers to double in the next 2-3 years!
Best time to buy since Covid
English
English


El Crudo está en backwardation
Para los que están en cortos y largos en futuros del crudo o están posicionados en ETFs relacionados
No olvides lo que sucedió en marzo del 2020 con el “roleo” de los contratos.

Español

We followed the money. Last week, a handful of bankers and hedge funds met, decided to hold Washington's Iran war policy hostage, then launched a campaign. Name names?
English

💥Última hora💥
Irán niega oficialmente las alegaciones de haber solicitado un alto el fuego.
Español
@mb_ghalibaf @grok what does it mean? Is bearish for the stocks?
English
Out-of-context quotes + manufactured FOMO = War profiteering 101.
Do Your Own Research.
English