PowChain

1.2K posts

PowChain banner
PowChain

PowChain

@pow2chain

Bitcoin mining & Proof-of-Work signals. Tracking hashrate, difficulty, fees, miner margins and miner stress ⚡

Katılım Mart 2025
315 Takip Edilen193 Takipçiler
Sabitlenmiş Tweet
PowChain
PowChain@pow2chain·
⚡ Zap Anyone. Anywhere. Instant Lightning payments. No middlemen. No delays. No limits. Built for the $FLC ecosystem. Powered by Lightning. 🟡 This is not just payments. This is freedom. #Zapf #LightningNetwork #Flokicoin #Bitcoin #Web3
PowChain tweet media
English
0
0
2
75
PowChain
PowChain@pow2chain·
Some people see 83% win rate. I see 17% of predictions being $200k+ tuition for knowing when you're wrong. That best trade returned 2.3x. The risk you took to get there isn't in the screenshot.
VoidReader@VoidReader_

$681,472 net profit on political markets 261 predictions made with an 83% win rate The best trade returned $444,899 from $189,824 Today’s PnL was $33,199 Each trade is a clearly planned prediction, with precise entries and exits Wallet: 0x88c4919de76e526d55a32c1f8afb439dd1f1129a

English
0
0
0
0
PowChain
PowChain@pow2chain·
Market cap inflates without liquidity. TVL hides what can actually exit. The question isn't what's locked. It's what moves when treasuries flip.
2xnmore@2xnmore

Most people track $ONDO by market cap. That’s the wrong metric. Here’s what actually matters: #1 in tokenized U.S. Treasuries by TVL #1 in tokenized equities and ETFs by TVL #1 RWA protocol overall with $3.77B locked Ondo Global Markets crossed $1B TVL. 260+ assets. 58% market share in tokenized equities. The protocol is doing $3.77B in TVL. The token is valued at ~$1.85B market cap. The fundamentals are outrunning the price. That gap does not stay open forever. People who read the docs always buy before the people who read the price.

English
1
0
1
12
PowChain
PowChain@pow2chain·
@TradableAstro So where’s the new pin now, $110 or $115? Feels like the market is waiting for a catalyst to pick the next ceiling.
English
0
0
0
10
Tradable Astronaut
Tradable Astronaut@TradableAstro·
$ASTS options positioning update. Spot $105. Last time we broke this down $100 was the wall. Every expiry in the chain was pinned there. We said break and hold $100 and that ceiling becomes a floor. It did exactly that. Here's where we stand now. Regime is PINNED. No gamma flip exists in the chain. Full dealer book is positive gamma at $72.32M. Dealers are leaning against moves in both directions. Price compression is the expected behavior until something breaks. $105 is the new dominant pin. $18M sitting right at spot. That is the new ceiling. Every push into $105 gets capped by dealer hedging pressure. $100 is now the magnet below. It flipped from ceiling to floor exactly as the structure said it would. Dips toward $100 get bought by dealers defending their long gamma book. Charm flow is working against a near term breakout. Net CEX -$95.07M. Charm resistance is creating downward pin pressure and anchoring price below $105 short term. But here is what a weekly close above $105 does. The dominant pin shifts. $105 stops being a ceiling and becomes a floor the same way $100 did. With no gamma flip in the chain and $72.32M in positive gamma above, dealers are forced to chase if price escapes the pin. The longer dated star nodes are already showing where this goes. $110 ceiling on 09-18. $150 ceiling on 08-21. A weekly close above $105 puts both of those in play. Vanna flows accelerate on any IV compression above the pin. The $160 to $180 VEX cluster we've been talking about since $73 becomes the next destination. Until that close happens expect chop between $100 and $105. The second it does the structure flips again. $ASTS 👀
Tradable Astronaut tweet media
Tradable Astronaut@TradableAstro

$ASTS options positioning breakdown. 
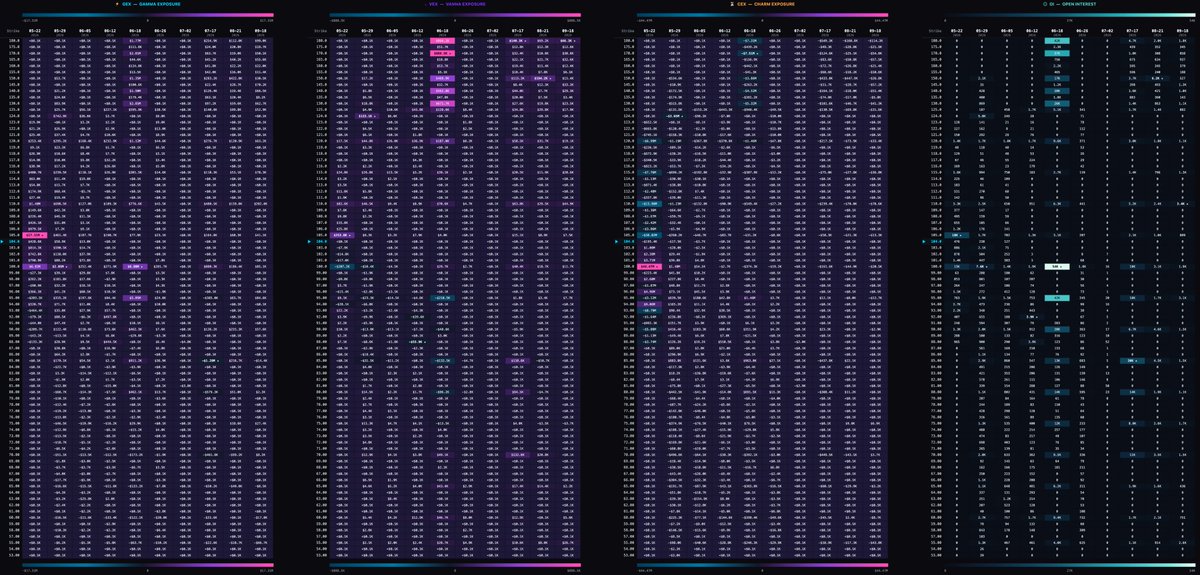
Spot at $90.95. Regime: PINNED. No gamma flip exists in the chain the full dealer book is positive gamma at $42.52M That means dealers are leaning against moves in both directions. Price compression and mean reversion are the expected behavior in this environment, not trending or cascading. The dominant pin is $100 at +11.16% away with $10M in dealer positioning. That is the ceiling right now every rally into $100 gets sold by dealers hedging their long gamma exposure. It is the single most important level on the board. King nodes confirm it. $100 is a ceiling on every major expiry May 22, May 29, June 5, June 12, June 18, and June 26. That is not one expiry pinning $100. That is the entire chain anchored there. Below spot the magnet is at $85 5.5% down from here. Dealers buy dips into $85. The cascade danger zone is at $70 if price breaks through there dealer hedging accelerates the drop. Charm flow is working against the bulls short term. Net CEX is negative $95.89M with the charm anchor at $100 above spot creating downward pin pressure as time decay erodes dealer deltas. Front week is LONG gamma at $13.48M Near spot is DAMPENING at $20.04M. The structure is simple. $100 is the wall. Dealers are pinning price below it through charm pressure and gamma resistance. Breaking and holding $100 flips the entire dynamic that ceiling becomes a floor and the $160 to $180 VEX cluster becomes the next target as vanna flows accelerate the move on any IV compression. Until $100 breaks, expect chop between $85 and $100.

English
14
5
94
15K
PowChain
PowChain@pow2chain·
@TraderMagus Makes you wonder how many "good trades" are actually just bad execution masked by a favorable outcome.
English
0
0
0
22
Magus
Magus@TraderMagus·
First mistake of the week, mismanaged my long Thursday Textbook value setup but I got impatient & concerned about the potential round trip so I closed early Hit my two primary take profit zones within the next hour Can't play them all perfectly At least I made some profit
Magus tweet mediaMagus tweet mediaMagus tweet media
English
7
1
93
6.5K
PowChain
PowChain@pow2chain·
@Invst_Informant The bond market's been screaming for months and equities just yawned. Feels like the real tension is liquidity rotation, money's leaving bonds for stocks, which keeps yields high and prices up, until it doesn't.
English
0
0
0
6
Danny Marques | Investing Informant
The bond market and US 10yr are nearing a breaking point yet equities are at an ATH with signs that this bull market still has much more room to go. Let me explain why high yields don't break markets. What we have here is the US10yr yield (now at 4.56%) vs the $SPX (S&P 500) over the last 30 years...The more I look at this, the more I think the right question is not simply “Are high rates bad for stocks?” The better question is what type of high-rate environment are we in? Because there is a major difference between what historically caused recessions and what historically confirmed them. Several of the worst market declines over the last 25+ years were not always triggered by yields being high. They often happened after the bond market started sniffing out a real growth problem and after yields had already started collapsing. In other words, the 10-yr breaking lower was not always the bullish “rates are falling” signal investors wanted it to be. Sometimes it was the market saying growth is cracking, capital is moving to safety, and the Fed is probably behind the curve. IF the 10-yr breaks down because inflation is cooling while earnings remain resilient, that can be bullish. That is the soft-landing version. Lower discount rate, still-good earnings, and risk assets can breathe. But IF the 10-yr breaks down because unemployment is rising, credit spreads are widening, consumers are weakening, and earnings revisions are rolling over, that is not bullish. That is the recession version. Same move in rates but a very different message. So what is happening right now? Right now, the 10-yr is sitting near a major multi-decade resistance zone, and the S&P 500 is making new highs. That combination tells me the market is pricing a world where nominal growth, fiscal spending, AI capex, and mega-cap earnings power are still strong enough to offset the drag from higher rates. THAT is the key point. In 2000, 2007, 2020, and even partially in 2022, the breakdown in the 10-yr yield was less the cause of the equity correction and more the market suddenly pricing economic deterioration, liquidity stress, or an aggressive policy response. Put differently, rising yields usually reflect nominal growth, inflation expectations, or economic momentum. Collapsing yields usually reflect fear, recession risk, or a liquidity event. And this is where today gets interesting. We are not living in the same macro structure as prior cycles. The US fiscal deficit is much larger. Treasury supply matters more. Inflation is structurally more sticky. And AI infrastructure spending has become one of the largest private-sector capex cycles in modern history. The AI capex boom is not just a tech story. It is flowing into so many different areas of the economy. Semiconductors, power, utilities, data centers, networking equipment, electrical infrastructure, and labor demand. That spending is helping hold up parts of the economy that normally would have rolled over faster under this level of rates. Index concentration matters too. The S&P 500 today is not the same S&P 500 from 2000 or even 2010. A huge portion of index performance is now driven by a handful of mega-cap technology companies with fortress balance sheets, enormous free cash flow, global monopolistic distribution, and secular AI-driven demand. That changes the transmission mechanism of higher rates. A regional bank, small-cap company, or heavily levered consumer company can struggle enormously in a 5% yield world. Microsoft, NVIDIA, Meta, or Alphabet do not necessarily struggle the same way because they internally finance growth through cash generation. So the market is not ignoring rates. It is saying “Show me the earnings damage.” And so far, at the index level, there hasn't been any. The major contributors to the indexes and the economy have the strongest moats and earnings strength has never been stronger. That is why traditional recession signals have looked “wrong” for longer than many expected. The economy is bifurcated. Tthe lower-income consumer looks stressed, housing affordability is weak, small businesses face pressure, refinancing risk is real (Commercial real estate is still digesting a much higher cost of capital) But at the same time, large-cap tech corporate earnings remain resilient because AI, software, cloud and infrastructure spending are offsetting broader weakness. I also think people are too quick to compare the AI capex cycle to the late 1990s telecom and internet bubble. There are major differences. Alot of the 1990s infrastructure buildout was funded by companies that NEEDED the capital markets to stay open (and it was largely driven by debt) Today, companies like Microsoft, Amazon, Meta, Alphabet, NVIDIA, Oracle are investing from a position of massive profitability. Yes, now they've begun tapping into the debt markets to accelerate the buildout, but they are doing it from a position of strength, not survival. Whether the spending ultimately becomes excessive or will generate adequate returns is another discussion. Will there be overcapacity or will all this capex spend eventually disappoint? We shall see. But, for now, the earnings impulse is real. Hundreds of billions are being deployed into compute, networking, power infrastructure, chips, and data centers. That spending is flowing through the economy and supports nominal growth even while parts of the consumer economy weaken. This is why the bond market matters so much from here. Technically, yields look like they are attempting a breakout from a 20+ year base. And if yields do decisively break above this range and sustain above ~5%, I think the market eventually has a much harder time maintaining current multiples. Not necessarily because growth collapses immediately, but because the discount rate regime changes. A sustained move above this macro resistance zone would tell me the market is repricing term premium, fiscal risk, or sticky inflation again, or some combination of all three. That would put pressure on long-duration assets and make the equity market far more dependent on earnings growth to justify valuations. On the other hand, as long as the 10-yr is not breaking down in a disorderly way and not breaking out above this long-term resistance zone, the market can still have legs. It gives equities room to keep climbing, especially if the earnings engine remains concentrated in companies with real cash flow, pricing power, and balance sheet strength. Remember, the market tends to break when the bond market suddenly realizes growth is deteriorating faster than expected. And right now, that is NOT what the bond market is saying. If anything, the bond market is currently saying the exact opposite. Nominal growth + inflation are more durable than people expected. Now does that mean there is no risk? Of course note. At some point higher rates matter. Private credit reprices (it already has shown signs of fracturing), refinancing risk increases, government interest expense explodes higher (which is currently not sustainable), equity risk premiums compress, and weaker balance sheets start to run out of time as liquidity conditions tighten materially. Higher rates work with long and variable lags. But the nuance is markets do not top simply because yields are high. They top when liquidity deteriorates, earnings roll over, credit spreads widen, AND THEN yields collapse because the market starts pricing recession. Right now, we don’t yet have that full sequence. What we have instead is sticky nominal growth, sticky inflation, resilient mega-cap earnings, AI-driven capex, and structurally large fiscal deficits supporting demand + keeping liquidity in the system. That combination can sustain higher yields and higher equity prices simultaneously longer than most people expect. The next move in yields does matter a lot. A controlled drift lower would likely help broaden the market. A breakout higher would pressure valuations. A sharp breakdown lower would probably mean the bond market is seeing something in growth that equities have not priced yet. Until the 10-yr breaks decisively one way or the other, my view is that the bull market can continue, but the macro margin for error is getting thinner. Commercial real estate, refinancing cycles, PE leverage, consumer credit deterioration, and government debt servicing pressure all compound slowly before they suddenly matter. Eventually there is a level where the cost of capital begins overwhelming even strong secular narratives. But the difficult part is knowing where that threshold actually is and frankly, the market itself may not know yet either.
Danny Marques | Investing Informant tweet media
English
4
10
55
7.1K
PowChain
PowChain@pow2chain·
@0x_Discover He saw the numbers and still called it a toy. That’s the real trade, convincing people who measure time in decades that months matter now.
English
0
0
0
38
Discover
Discover@0x_Discover·
My dad called Claude “a toy for people who can’t trade.” He’s been in markets for 20 years. I didn’t argue. I just turned the monitor toward him. He read the numbers twice. “…That can’t be right.” 27 days. $200 → $25,400 74% win rate. Sharpe 2.47. Meanwhile 92% of traders are losing money while the top 0.1% extracts billions. Then I showed him what was actually running. 86 million Polymarket trades analyzed. Every wallet. Every entry. Every exit. One Claude prompt: “Find every wallet with 100+ trades and win rate above 70%. Rank by profit.” 14,000 wallets scanned in 4 minutes. 47 targets returned. Top 20 wallets made more than the bottom 13,000 combined. He stared at the screen. “That’s not data. That’s a treasure map.” Then came the real part: 3 independent AI agents. No shared memory. • 2 agree → full size • 1 agrees → half size • disagreement → no trade That single rule killed 40% of losing trades overnight. Another model tracks fresh wallets entering low-liquidity markets before the move even starts. One wallet turned $35K into $442K before resolution. Track similar strategies: t.me/KreoPolyBot?st… 73 terminal dashboards running: • whale tracking • insider detection • Polymarket vs Kalshi arb • wallet clustering • signal scoring No exchange custody. No guessing. Just math + execution. Then he asked the question. “How much does this setup cost?” “About $25/month.” Long silence. “I’ve been paying analysts six figures to do half of this.” The repos are free. The edge is still public. Most people still think AI is for writing emails. Meanwhile others are building money printers on prediction markets.
Discover@0x_Discover

x.com/i/article/2045…

English
13
21
101
15.7K
PowChain
PowChain@pow2chain·
@MichaelPBento They keep saying oil is rolling over but it keeps finding bids above that zone. Who’s left to sell if every dip gets bought
English
0
0
0
0
Michael Bento
Michael Bento@MichaelPBento·
Everyone is acting like oil has meaningfully backed off, it hasn't. In fact it has maintained above the major demand zone and looks to be putting in a 3rd successive higher low, which is not the kind of price action you see when something is going to continue to decline. It is however the kind of trend you see right before it spikes higher. With Trump sabre rattling again and absolutely no progress on Hormuz while summer demand for gasoline begins this weekend we are probably looking at a move back up to 110+ on WTI soon.
Michael Bento tweet media
English
8
0
58
3K
PowChain
PowChain@pow2chain·
@TimmerFidelity Central banks ignoring inflation is priced into gold’s recent lackluster run. The real tension is whether they’re powerless or just choosing not to act.
English
0
0
0
16
Jurrien Timmer
Jurrien Timmer@TimmerFidelity·
While gold and Bitcoin are not in the negative correlation quadrant of the above chart, they can be valuable hedges if it turns out that central banks will ignore the inflation thread (or are powerless over it). Gold has been lackluster lately after a very strong run, with Bitcoin taking over the leadership for now.
Jurrien Timmer tweet media
English
12
17
143
9.6K
PowChain
PowChain@pow2chain·
@Bitcoinmeraklsi They’re reading the break as bullish but the real test is whether volume confirms it, not just price tagging the trendline.
English
0
0
0
14
Bitcoin Meraklısı
Bitcoin Meraklısı@Bitcoinmeraklsi·
#WLD Kritik trend kırıldı. 0.8375$ seviyelerine doğru yeni bir yükseliş dalgası mı geliyor? Dostlar $WLD uzun zamandır takip ettiğimiz düşüş trendini sonunda kırmayı başardı. Bu yapı ister iki ayrı kanal, ister ana kanal ve orta bant olarak yorumlansın fark etmez; her halükarda önemli bir teknik direnç aşılmış durumda. Şu an için en kritik bölge kırılan trend üzerinde kalıcılık sağlanıp sağlanamayacağı olacak. Yükselişin devam etmesi durumunda: 🔹 İlk kısa vade hedef: 0.3279$ 🔹 Devamında kanal direnci: 0.3790$ Ve tabi asıl önemli senaryo; Şuan konuşmak için erken olsa da grafikte belirttiğim ana kanalın da yukarı kırılması olacaktır. Piyasa genelinde bir sıkıntı olmaz ve yükseliş devam ederse, yukarıda ki senaryoda kanal hedefi olarak yaklaşık 0.8375$ seviyeleri gündeme gelecektir. Şimdilik görünüm gayet olumlu duruyor. Takibe devam.
Bitcoin Meraklısı tweet media
Bitcoin Meraklısı@Bitcoinmeraklsi

#WLD Güncel görünüm. Dostlar $WLD Eylül ayından gelen düşüş kanalı orta bandı üzerinde kapanış yapmayı başardı. Bu trend üzerinde tutunduğu sürece kanal direnci sıradaki hedefi olacaktır. Şuan teknik açıdan görünüm güzel. Savaş cephesinden olumsuz bir haber gelmez ise yükseliş için ortam müsait görünüyor. Takibe devam.

Türkçe
13
22
184
16.1K
Crypto Tice
Crypto Tice@CryptoTice_·
NOBODY IS TALKING ABOUT WHAT GOOGLE JUST PREDICTED FOR BITCOIN. Google: Broke 2021 highs. DONE. Retested breakout zone. DONE. Entered expansion phase. DONE. Bitcoin: Broke 2021 highs. DONE. Retested breakout zone. DONE. Bounce happening right now. DONE. One cycle behind. Same structure. Same setup. Same result incoming. When Google completed this pattern… Nobody was ready for what followed. Bitcoin is next. Are you positioned?
English
24
52
341
29K
Castillo Trading
Castillo Trading@CastilloTrading·
No exchange has really aggressively been selling spot bitcoin:native since really the beginning April. You can say Coinbase has been selling the most since the $82,000 local highs, but not even the top spot selling exchange Binance has stopped selling aggressively, so I still think higher
Castillo Trading tweet media
English
20
14
218
15.8K
Gary Savage
Gary Savage@garysavage1·
Sure looks like stocks are in the bubble phase. How far do you let it run before being satisfied and exiting so you don't get caught when the bubble pops? I was way too conservative when I said Nasdaq 10,000 would be a piece of cake and 20,000 wasn't out of the question.
Gary Savage tweet media
English
10
14
255
20.3K
Narendra Modi
Narendra Modi@narendramodi·
Tributes to former Prime Minister Shri Rajiv Gandhi Ji on his death anniversary.
English
1.7K
4.7K
99.3K
53.1M
BNB 100x Gems
BNB 100x Gems@BNB100xGems·
Guys #Altseason signals are flashing, and the structure just broke to the upside 💯 We will see hug #Altcoins pump in coming weeks 💥🚀 Alts are about to mint some new millionaires.
BNB 100x Gems tweet media
English
32
43
158
3.2K
ChiefraT
ChiefraT@ChiefraFba·
LONG TERM BEARS NEED TO LOOK AWAY FROM THIS CHART. M2 Global Liquidity bounces from support, and Bitcoin pumps. Is $BTC getting ready for $200K+ once it is done boring people?!
ChiefraT tweet media
English
13
18
62
3.1K
Berk Atabek
Berk Atabek@berkatabk·
Bitcoin'de 10 Mayıs tarihinden beri küçük yatırımcı yükselişe ikna olmuş durumda. Vadeli açık pozisyon sayısı yükselen dip yaparken, fiyat düşen tepeler yapıyor. Son 10 günde gördüğümüz pozitif fonlama oranları ise bu yılın en yüksek oranları. Bu da KY'nin düşüşü agresif bir şekilde longlamaya çalıştığını gösteriyor. Öz cümle, küçük yatırımcının balinalara yem olması için tüm şartlar mevcut. Balinalar bu avı yeterli görürlerse fiyata kısa süre içerisinde yansıtacaklardır. bitcoin:native
Berk Atabek tweet media
Türkçe
10
5
55
6.1K