
Ryan Oleston
2.4K posts
Ryan Oleston
@roleston
Christian,husband, father, data architect, IBD follower
wi Katılım Nisan 2009
86 Takip Edilen305 Takipçiler

This earnings season is especially important for software. Companies using AI to drive leverage, growth, and efficiency are going to stick out like sore thumbs.
English
Four tickers usually comprise the strongest themes.
Quantum
$RGTI $QBTS $IONQ $QUBT
Memory
$SNDK $MU $WDC $STX
Rare earths
$UAMY $USAR $CRML $LAC
What other four ticker themes can you think of that are prevalent today or were in the past?
English

Everybody wants to buy the 10ema retest on a stock until it's time to do it
English
@traderwillhu what I'm looking to do is have ai create a dynamic hot theme list and when I click on it it opens tradingview chart
English

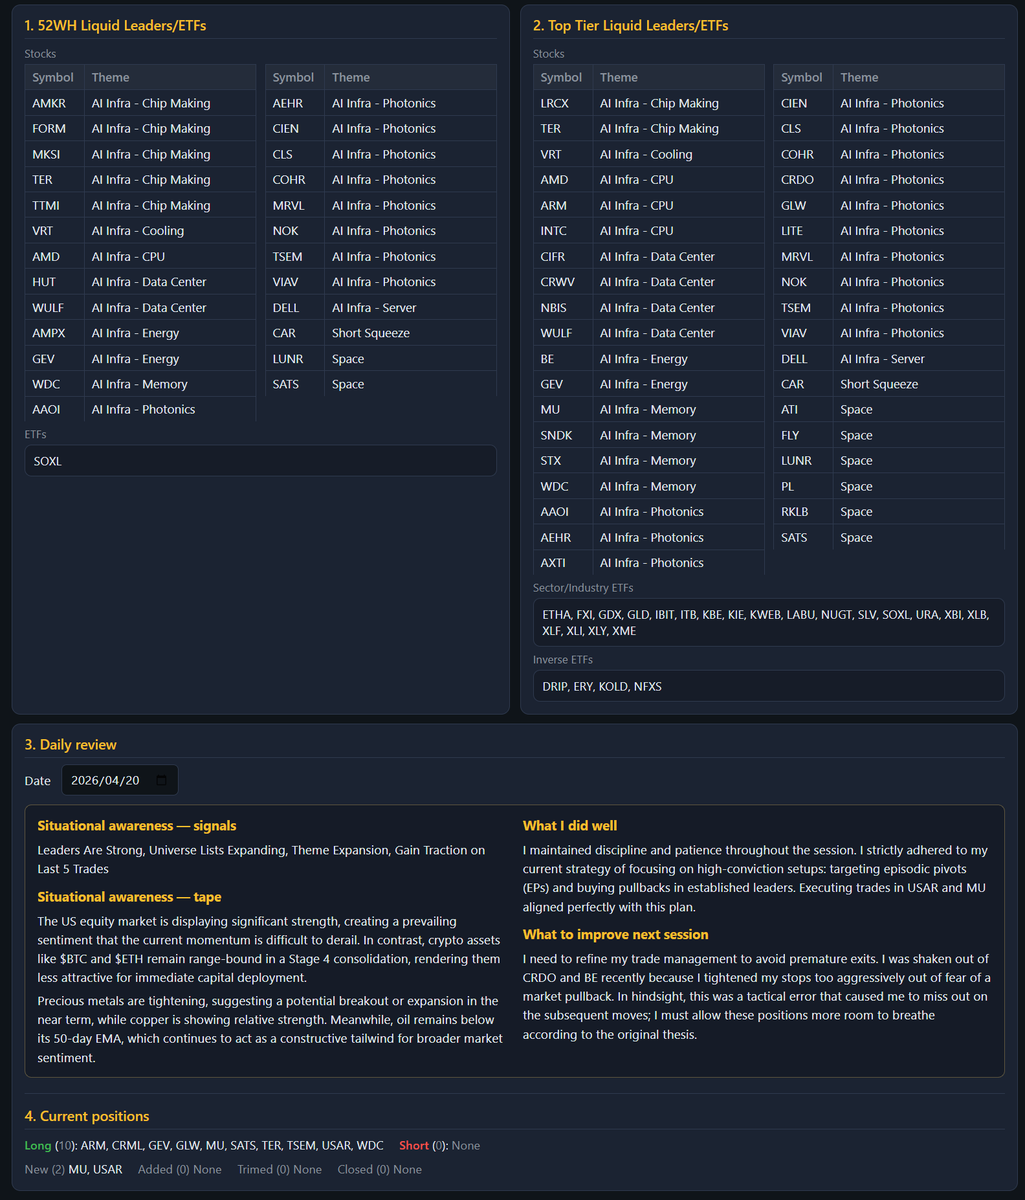
Apr 20 Daily Review: Strong Market
The US equity market is displaying significant strength, creating a "buy the dip" environment where downside catalysts appear ineffective. Conversely, crypto remains range-bound in a Stage 4 decline, making it less attractive for capital allocation.
Precious metals are coiling and showing signs of potential expansion, while copper is exhibiting relative strength. Oil remains pinned below its 50-day EMA, which continues to provide a constructive backdrop for broader market sentiment.
English
@traderwillhu Do you have a post that describes how you created it. I'd gladly buy you a coffee.
English
@Stephen_Trades1 Nice one! Do you mind sharing the indicator name you use on the daily chart in the upper left corner with all the data points in orange? Also what anchor point are you using for vwap?
English

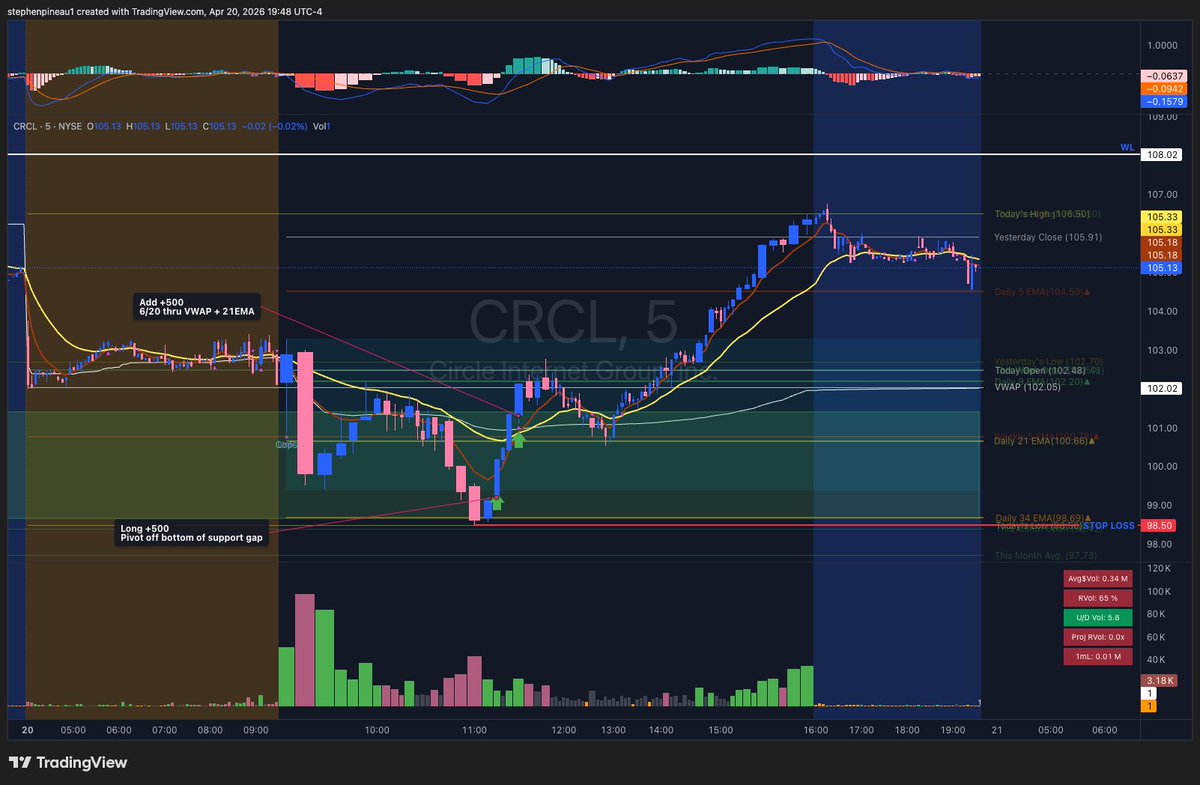
$CRCL
My third attempt at this - and the best technical setup of all of them. No wonder it worked.
Goes to show you to wait for *exactly* what you want to see, and you might just get it!
Long from 99.88 cost avg. Tagged the bottom of the support gap. A break over the high of that first green bar got me started. Added full on the 6/20 thru VWAP and a remount of the 21EMA.
Need to work on getting even more aggressive at the bottom of those gaps, since you're essentially risking pennies.
This looks like it's going *much* higher, and I'll be looking to add before I'm looking to trim.

English

I remember when I bought this stock back in October before its nearly 600% surge.
I sold it up 30% because I thought it was extended and I mishandled the earnings report.
Hard lesson to learn.
Lance@LanceDavid123
$LITE broke out of its base and hasn't turned back. It is my largest holding with earnings coming up next week.
English
This is what frustrates me about trading. It’s so short-sighted. That’s exactly why I made a pledge to myself and my family to shift more toward longer-term investing.
Not going great so far, considering I closed my $TSLA long after holding it for around 240 days… and a couple others. But I’ll get there.
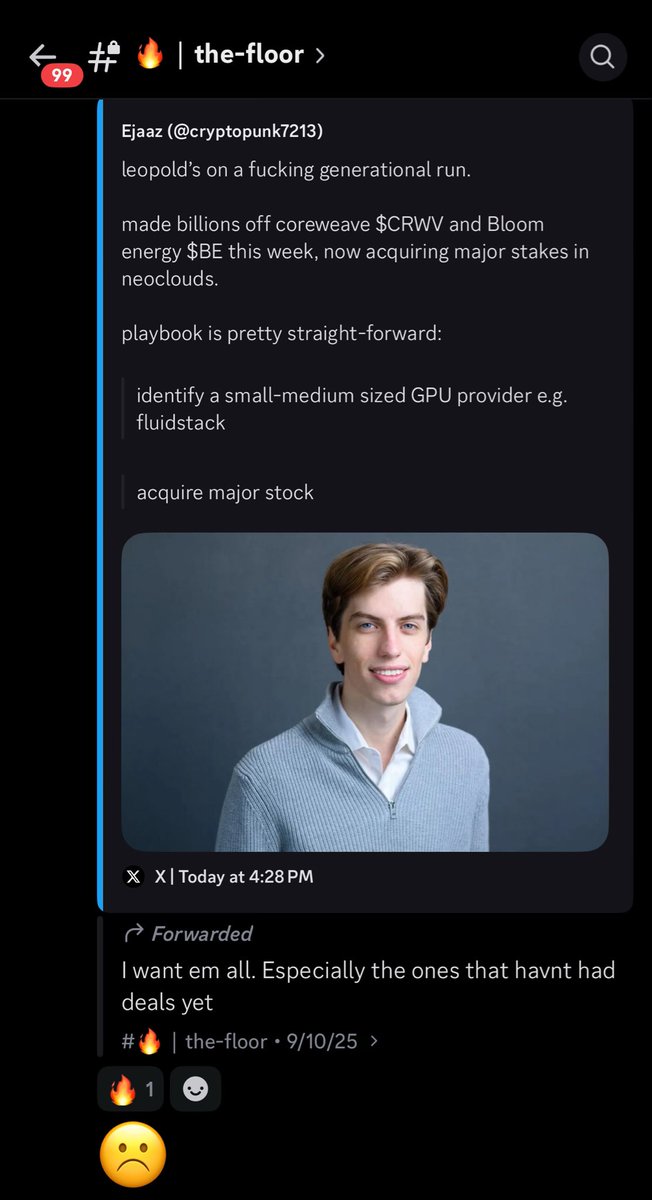
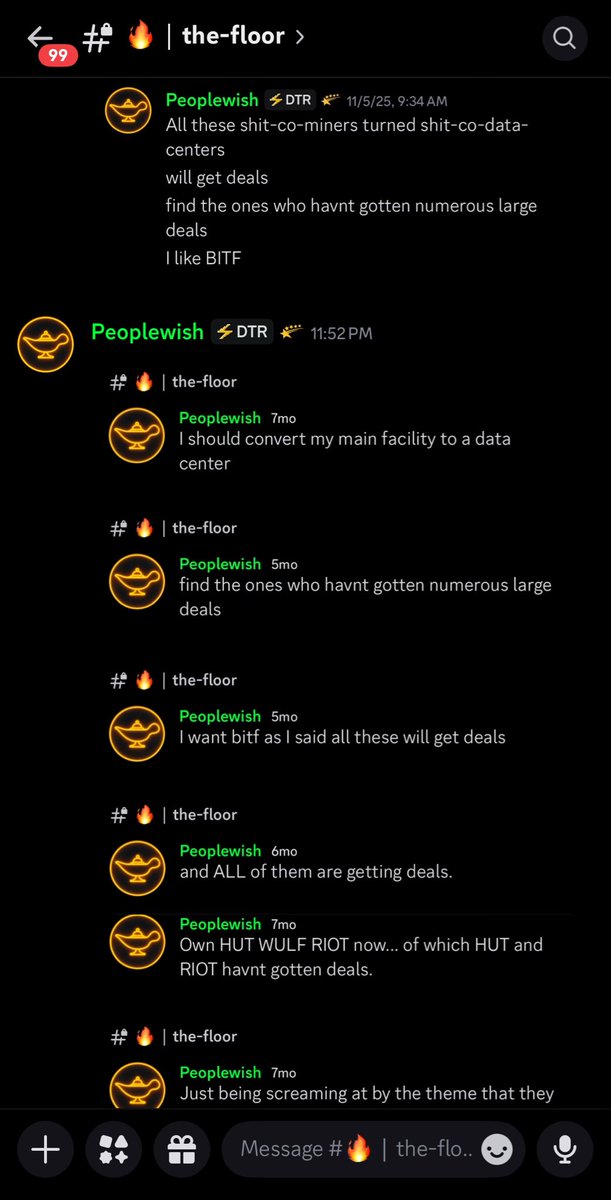
I should’ve had $NBIS $HUT $CIFR $WULF $IREN from a year ago, but we’ve got a few of them now and are watching $MARA $RIOT $CLSK too since they’ll likely give us deals soon. So I’m not gonna beat myself up too much.
Shoutout Leo. Young savage indeed.
English
@JaguarAnalytics Hope all is well. Had nasty weather in southern Wisconsin too
English

Tornados in the area. Sirens going off. Waking up everyone. I will probably lose power at some point.
English
@Peoplewish thx! love the simplicity! is that EMA or SMA in MACD settings?
English
The best technical risk on, risk off indicator in the market, especially if you’re a trend follower like me, is the weekly MACD (6,20,9).
Once MACD crosses down and price loses its uptrend, just wait for the first weekly close with a MACD up cross. That’s your confirmation.
You don’t need breadth.
You don’t need sentiment.
You don't need NAAIM.
You don't need COCK data.
You don't need an over complicated dashboard.
You don’t need any other indicator.
All of these things are noise.
You only need PRICE and MACD.
Don’t believe me?
Go back and look for yourself across any time period, then be the judge.
MACD is a timing tool. This concept applies across all timeframes, even intraday, where it helps you dial in precise entries while aligning with higher timeframe key levels.
It took me five years of relentless study and commitment to continuous improvement to boil risk on down to something this simple. If you follow a system like this with discipline, and you aren’t already, your results should go parabolic. Hope this helps. Let me know if you have questions.
English
Ryan Oleston retweetledi

@RobinhoodApp How about getting back to me and the fraudster that got into my account/ bank account..
English