Singh is king
909 posts

#SILVER
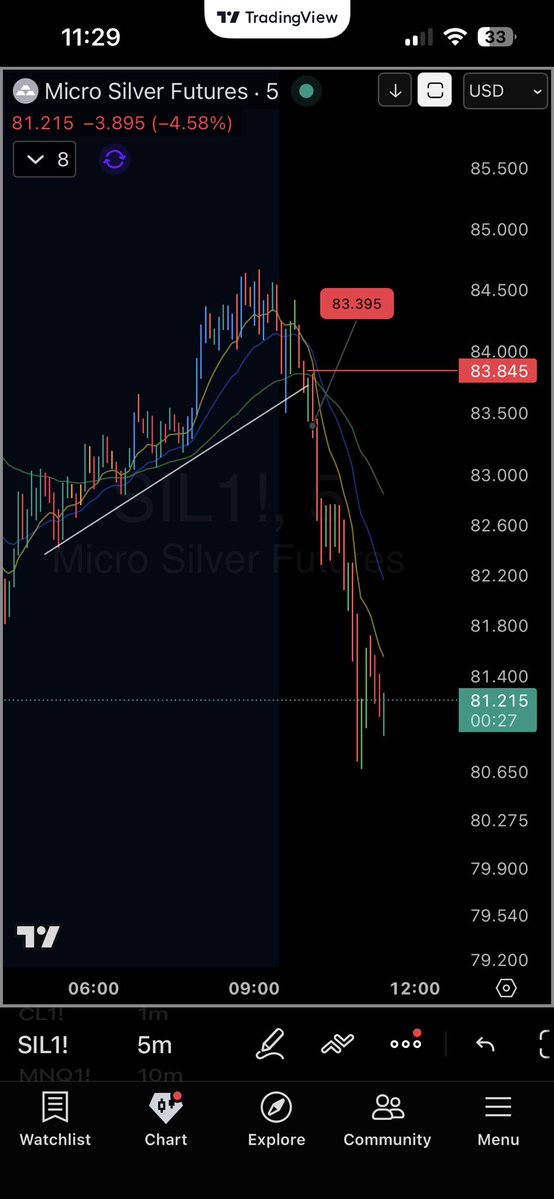
Went short with a hero–zero mindset.
Holding full position from ~$80
Now it’s simple , trail with the 10MA. No partial profits taken. As long as price respects structure, I stay with it. If I get a proper setup to add, I’ll do it aggressively.
This is one of those trades where you don’t want to overmanage. Either it works big, or it doesn’t and the MA will decide that in my case specially 10MA ( if hits Still its a Good Impact Trade )
If this plays out right, it has the potential to be the biggest trade I’ve taken.

Buy Before Breakout@VCPSwing
#SILVER Seems More discounts coming soon.
English
@dayendtrader Sir, sir is bec of the knowledge u share and our learning’s from it.
English

@sasingh1209 Yeh ‘Sir’ culture ko bandh karo. My name is Neel.
Filipino
@dayendtrader sir I am assuming u haven’t traded on Thursday and Friday, hence missed the move in gold and silver. Do u have any regrets ?
English
I traded very badly on Thursday. So gave myself a break on Friday.
I am currently in a deep dive that can potentially change my life. So I will continue to focus on that.
One trade. One setup. All in.
On the other hand I also have a business venture here almost ready to set off, and a baby arriving by June.
So I would say I am blessed and have no regrets whatsoever. In fact I will be taking a really long break from trading due to the baby. 2026 has already been very kind to me.
English
Singh is king retweetledi

If you forced me to trade one concept for the rest of my career, it would revolve around this idea:
Compression → Expansion.
Everything in my system ultimately traces back to that cycle.
High tight flags, Stage 2 transitions, large base breakouts… they’re all just different expressions of the same underlying process happening between buyers and sellers.
And once I started viewing charts through that lens, the market began to make a lot more sense.
--
Every big move starts with proof of demand.
The first thing I want to see in any potential leader is strength. Not speculation, but actual demand!
That usually shows up as a strong, directional move higher accompanied by increasing volume and relative strength versus the market.
"But why does that matter?"
Because strong upside momentum tells me institutions are likely involved, and large funds can’t quietly accumulate positions in one afternoon. Their activity shows up through sustained buying pressure and persistent trend behavior.
When I see that initial expansion phase, I’m not chasing it. Remember, "the second mouse gets all the cheese."
I’m simply making a mental note:
"Okay… this name has demand."
That’s step one.
--
The base is where the real trade develops, because after that initial move, I look for something specific... I don't want to see the stock collapse.
Instead, I want to see signs of "rest."
> Price starts moving sideways
> Volatility contracts.
> Volume gradually declines.
This is the part of the chart most people ignore because it feels boring and there isn't anything to do besides watch the name... But in reality, this is where the most important psychological shift happens in the market.
Ownership begins transferring.
The traders who chased the initial move eventually get shaken out. The weak hands lose patience, and sellers distribute shares.
Meanwhile, stronger participants quietly absorb supply.
This is why I pay so much attention to structure around the 9/21/50 EMAs.
In strong trends, you’ll often see:
> Higher lows forming
> Tight daily ranges
> Volume drying up
> EMAs stacking underneath price
That’s equilibrium forming between buyers and sellers. And equilibrium is exactly what creates the tension that leads to expansion.
--
Also, I focus heavily on the psychology behind tight price action!
When price starts getting tighter and tighter near resistance, something subtle is happening:
1) Sellers are trying to defend the level.
2) But buyers aren’t backing away (Important).
Instead of pulling back aggressively, the stock just keeps drifting sideways, absorbing supply over time.
This is where I like to imagine the chart as a coil being compressed!
Every day that passes without a breakdown means:
Buyers are willing to keep accumulating shares at higher and higher prices, and eventually, sellers simply run out of inventory.
And when that happens, price has no choice but to move higher!
--
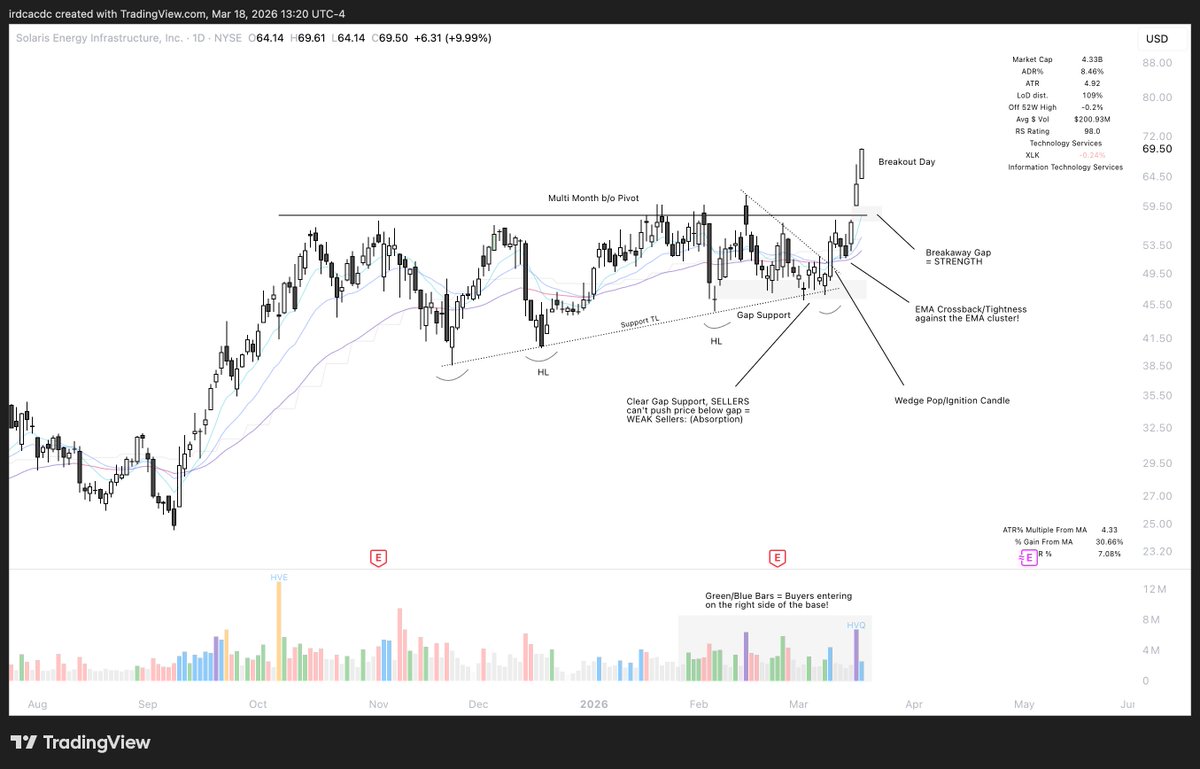
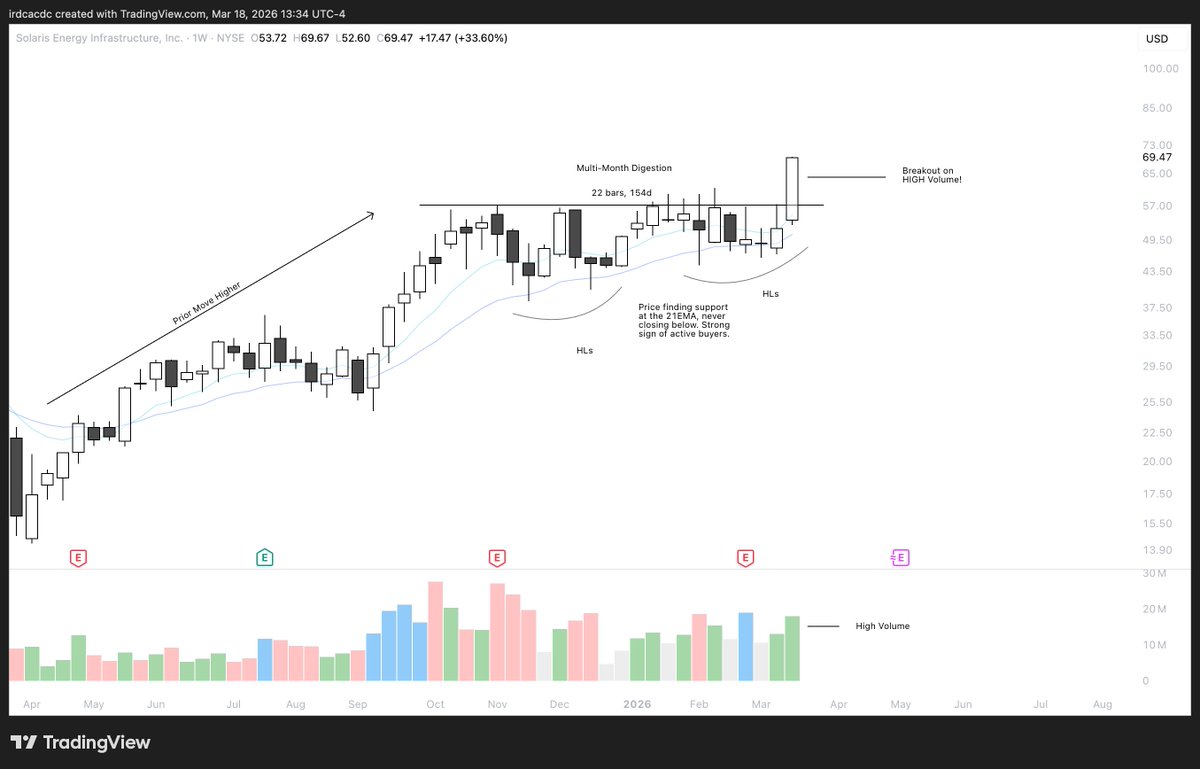
Look at $SEI over the past couple of months.
What do you notice?
For weeks, it simply sat there building structure.
- Nothing exciting.
- Just tight PA and controlled pullbacks.
What was actually happening during that time was supply absorption.
Weak hands were exiting, and stronger hands were stepping in. Then once that balance tipped, price expanded aggressively.
That’s the cycle I look for!
And you’ll see it repeat across nearly every major winner in the market.
--
But why do I care so much about the EMAs?
Another piece of my system revolves around how price interacts with the 9/21/50 EMAs.
I think of them like layers of trend structure.
• 9 EMA → momentum
• 21 EMA → structural trend support
• 50 EMA → intermediate trend confirmation (the last straw)
When a strong stock consistently pulls into these levels and finds buyers, it tells me something important:
1) Demand is still present.
2) And the trend is still intact.
Weak stocks slice through those levels, and strong stocks bounce from them.
That difference is important to note for my system.
--
Last thing I want to touch upon is that the breakout is just the final release of pressure!
Ironically, the breakout itself is NOT the setup.
It’s just the trigger.
The real work happens during the weeks leading up to it, the compression phase, where the base forms and tension builds.
When the breakout finally happens, I want to see:
• Volume expanding
• Clean move through resistance
• Strong close near the highs
That tells me demand has finally overpowered supply.
And often, if you miss the initial breakout, the first pullback into the 9 or 21 EMA can offer even better risk/reward.
So you can win in both scenarios if price continues to push after a big base breakout!
--
Patience, Patience, and Patience:
The real challenge with this approach isn’t understanding it.
It’s waiting for it.
Most traders spend their time reacting to pointless noise:
> Random breakouts.
> Loose price action.
> Stocks already extended.
But the best opportunities usually appear in the quiet periods before the move, when volatility contracts and nobody is paying attention.
That’s why patience matters so much and it took me ages to understand that the market pays you for preparation, not prediction.
--
If I had to simplify everything I do into one principle, it would be this:
Find stocks with proven demand that are compressing tightly beneath major pivots… and prepare for expansion.
Compression leads to expansion.
"The bigger the base, the higher in space."
And once you truly understand that cycle, you’ll start seeing opportunities long before the crowd does.
- iain 🩵
iain@ohiain
Two months ago I posted my thesis on $SEI. At the time, the chart wasn’t doing anything exciting. It was simply building a base and showing small signs of accumulation. Nothing explosive, nothing that would grab attention on a day to day basis. And that’s exactly the point: Good setups often take time. For the past two months $SEI has been quietly building out that structure, tightening and absorbing supply. Days like today (+14%) are the result of that process finally resolving. This is why patience matters so much in trading. "The larger the base, the higher in space." Of course, the environment plays a big role, but the work happens before the move ever begins. My job is to identify the structure early, stay patient while it develops, and be ready when the layers of probability begin to align. Wait for the fat pitches and then execute: $SEI
English
@thechartist26 Sir Ji u r still left with taking the class on Zanger method , please make some time and have a session in regards to this. Thank you.
English


Singh is king retweetledi

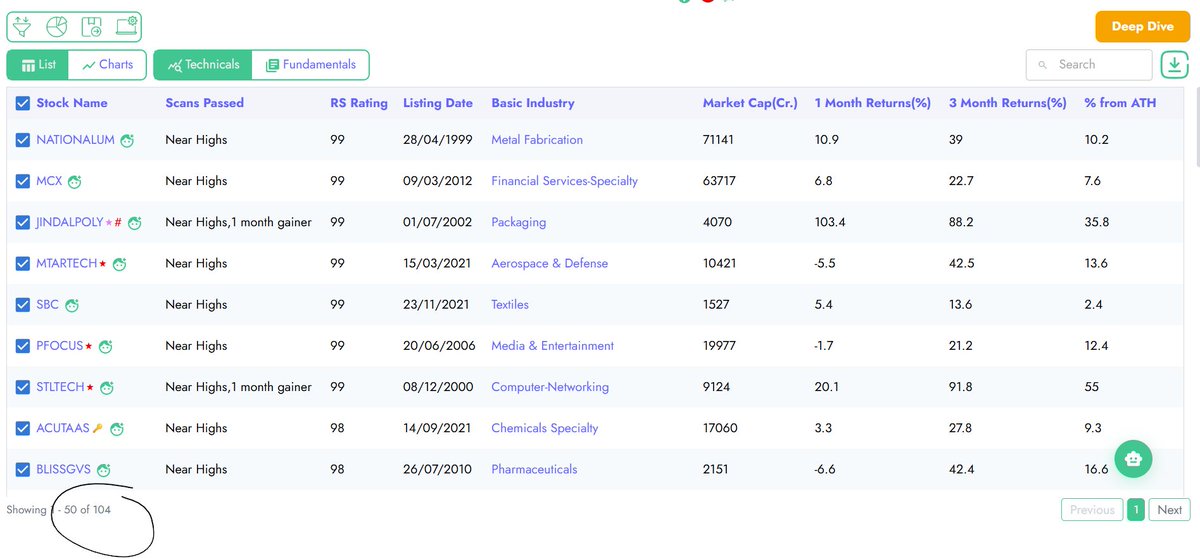
@Qullamaggie @PradeepBonde Scans found here:
1. Qullamaggie's scan: youtube.com/watch?v=nm8iND…
2. Stockbee's scan: stockbee.blogspot.com/2024/01/how-to…
YouTube
English
Singh is king retweetledi

I've shared this link quite a few times - but I'll share it again.
This is probably the best collection of charts to study. Marked up. Added comments. Rationale. Earnings, etc...
Go through them all. Multiple times. Do yourself this favour.
s3-us-east-2.amazonaws.com/marderreport/w…
English
Singh is king retweetledi

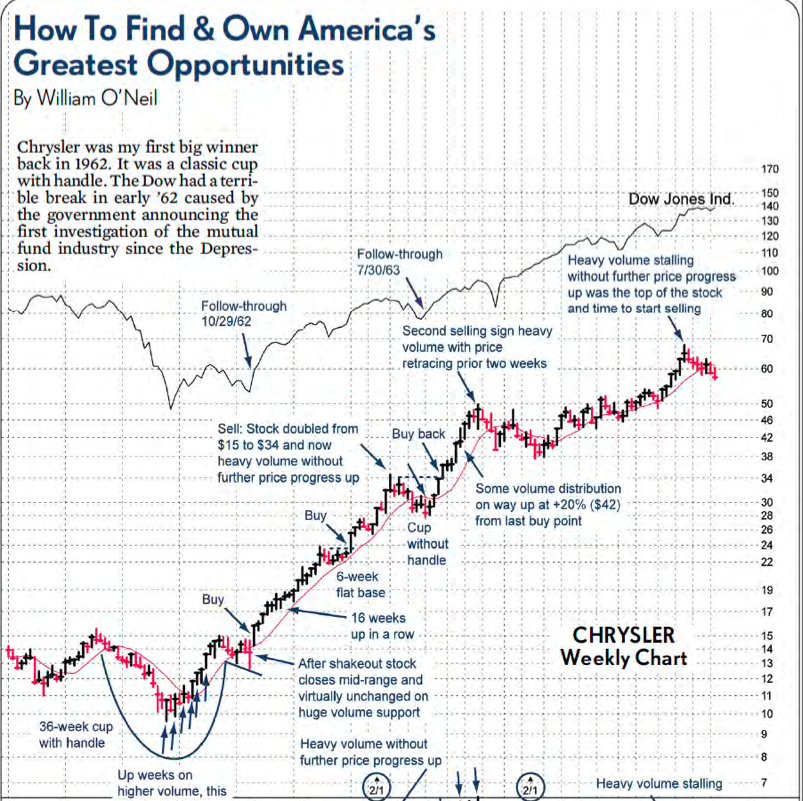
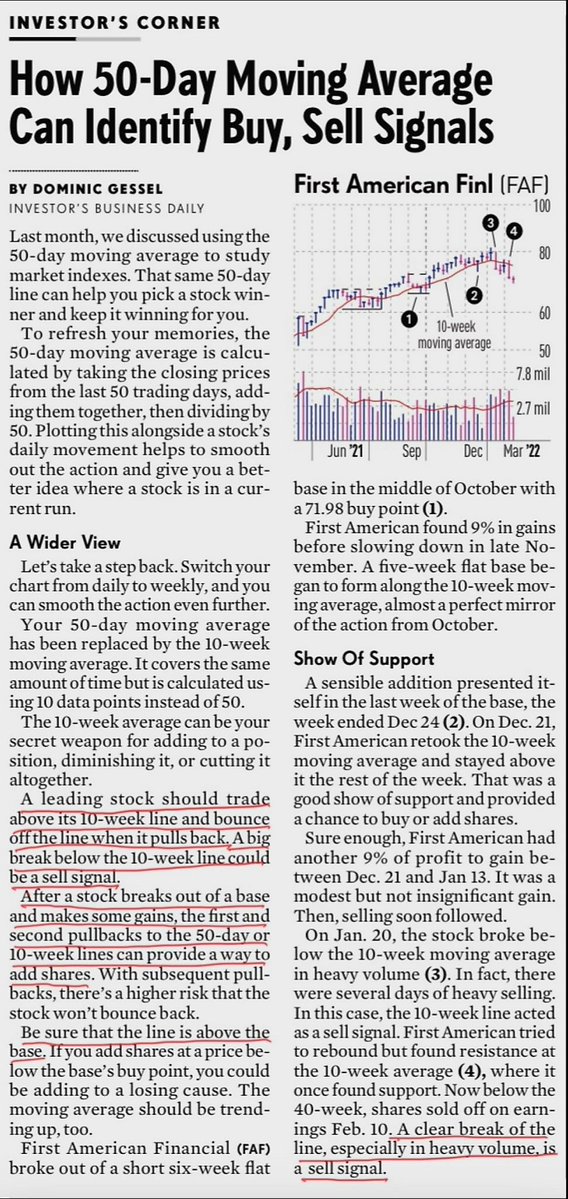
How 50 Day Moving Averages Can Identify Buy , Sell Signals:
English
@dayendtrader Sir ab aap yeh boley gey toh humlog ka kya hoga. ☺️
If our target s x%, and it s achieved, our work s done irrespective of what the price does after that. 🤞
English
@sasingh1209 But I was at least expecting the regret to become smaller or worst stay at the same level.
But the regret meter is showing ATH numbers. This is going to kill me eventually.
English
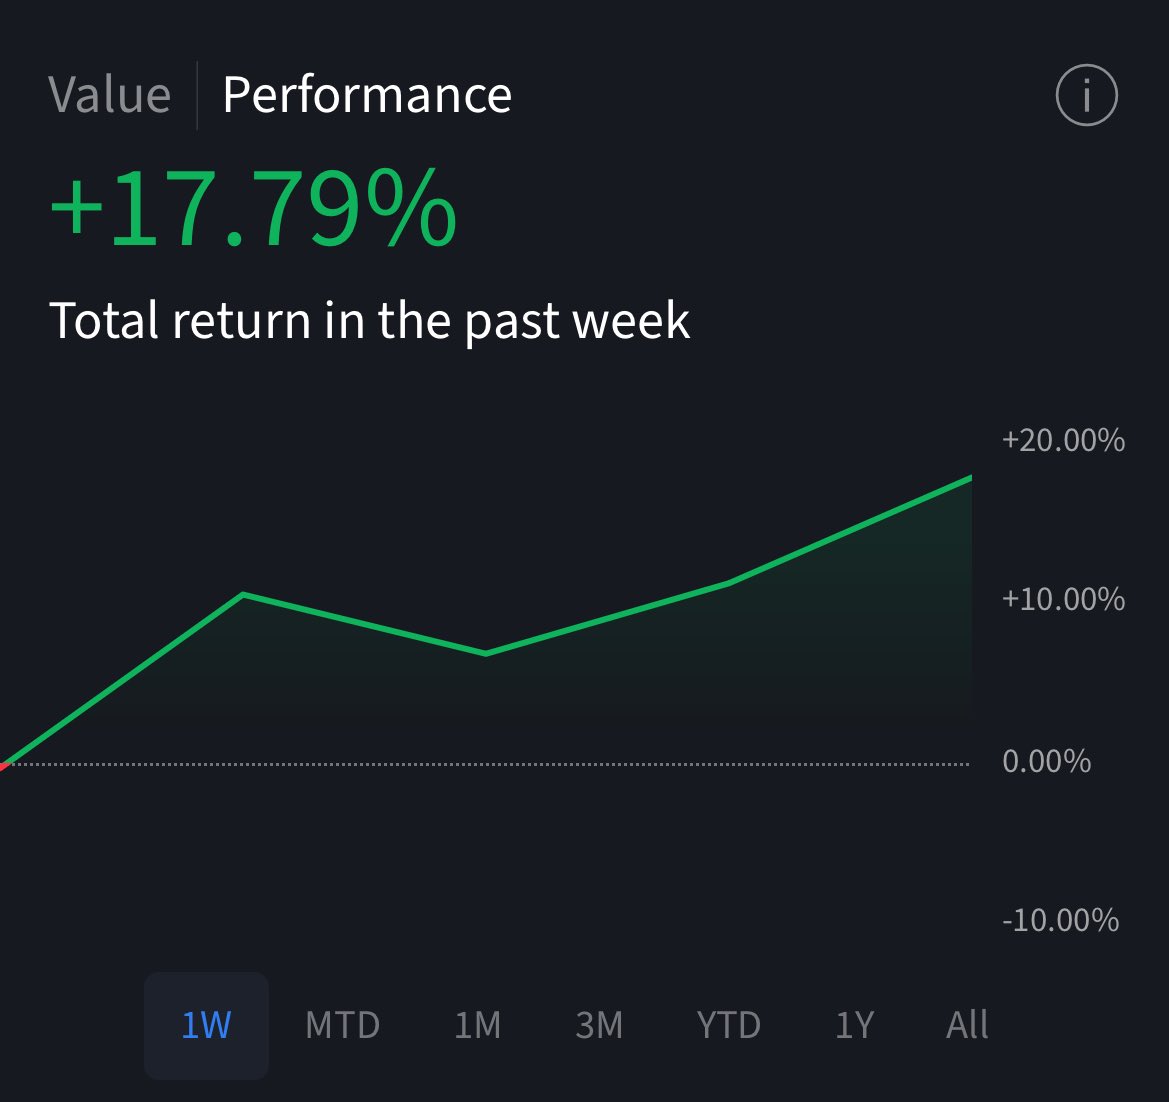
A few years ago if you’d tell me that I’d be up 18% in a week and still be terribly disappointed with myself then I’d recommend enroll yourself into an asylum.
Now I think I need to join one.
GIF
English
Singh is king retweetledi

“How to Trade SMC in Live Market Using Multiple Time Frames”
“Combining Multiple Time Frames to Trade SMC in Live Market”
youtu.be/YjJjG1cLsTg?si…

YouTube
English
Singh is king retweetledi

VOLUME PROFILE IS ONE OF THE BEST INDICATORS IN THE WORLD🌎
Here's how you should use it👇
English
Singh is king retweetledi

Just created a complete tutorial on how I made $98k in one day—the exact strategy using liquidity sweeps, supply zone mitigation and high-stop losses.
For 24 hours, it's yours for FREE.
Like + comment "WORKBOOK" and I'll DM it to you.
(must be following + RT for priority)
GIF
English
Singh is king retweetledi

Want to spot future leaders early?
Try this simple trick👇
Scan stocks with the index chart on the side.
Watch the video for a candle-by-candle breakdown of how emerging leaders behave & resist correction📊
Brilliant case study shared by @dayendtrader in our podcast🔥
English
@dayendtrader Sir 2 quests:
1- somtime price looks extended on higher time frame 1/2/4hr. Do u prefer the price to consolidate at hr level first and then enter at BO using 5/15 min chart.
2- in day trading, u use ma or base breakout to close the trade, for intraday, how u decide the target.
English
Missed the silver short because I took my eye off the ball for a few mins.
Arre shanti se aadmi ko ek coffee toh peene do!! 😭
English
Singh is king retweetledi

@thechartist26 Sir do u withdraw yr mf investment based on 50 ema or any correction?
English