roman

16 posts

roman

roman

@snw_lp

Katılım Mart 2022
149 Takip Edilen21 Takipçiler
roman
roman@snw_lp·
@JustRandomGuy_K @jfsrev @RealSimpleAriel Have you analysed what the stocks have been done after you exit on break of 21 ema? Some traders use strategy to await two closes below 21 ema to fully exit position. Or to see what it will be doing on next trading day at opening and then decide.
English
1
0
0
111
Evan Michaels
Evan Michaels@JustRandomGuy_K·
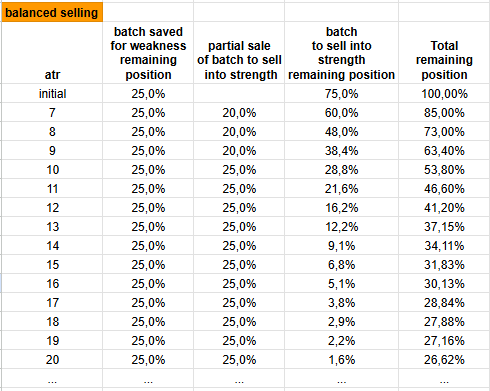
@jfsrev @RealSimpleAriel After reviewing my trades, most finish at 10-15 ATR extensions, however, a small amount keep going and the 21 EMA break is much much higher, so I developed the following selling rules. >25% of initial pos only into 21EMA break >75% saceld out ATR ext
Evan Michaels tweet media
English
5
4
38
5K
Steve Jacobs
Steve Jacobs@SteveDJacobs·
📈 Relative Trend Strength: Nasdaq-100💪 $QQQ Relative Trend Strength grades stocks based on their Relative Strength AND Trend Strength. A+ stocks have both the highest RS AND strongest price structure trend. Purple font: 7x ATR or greater Green font: Watchlist
Steve Jacobs tweet media
English
3
1
13
1.3K
roman
roman@snw_lp·
@ohiain What about $TEAM and $FIVN? Both have character change, lately HVE and probably building higher low.
English
1
0
0
335
iain
iain@ohiain·
A huge reason I focus so heavily on Stage 1 → Stage 2 transitions is because this is where I believe the most asymmetric opportunities in the market exist. > Not after the stock is already up 300%. > Not after every #finfluencer starts posting it. > Not after CNBC finally notices it. I want to catch the shift while the stock is still slowly transitioning. $DOCN is a perfect recent example: After spending nearly 1,400 days building a massive Stage 1 base, the stock finally transitioned into a Stage 2 uptrend and proceeded to run +230% in just 119 trading days. That’s years of supply getting absorbed before expansion finally took place. This is why I think so many traders struggle with these moves psychologically. Most people are conditioned to chase excitement and volatility AFTER the move already starts going vertical. But the real money is usually made during the “boring” phase when the stock is tightening, volatility is contracting, volume starts drying up, + weak hands lose interest completely. That’s what I call "the stalking phase." That’s where I spend most of my time. What I’m really looking for during these Stage 1 bases is evidence that sellers are slowly exhausting themselves while institutions begin accumulating shares over time. You’ll usually notice: - volatility contraction patterns - tighter weekly closes - higher lows developing - moving averages flattening out then turning higher - volume drying up during pullbacks - increasing volume on upside moves I like to think psychologically. Because once a stock spends years going nowhere, nobody cares about it anymore. There’s no emotional attachment left & retail loses interest...shorts somewhat become comfortable + analysts stop talking about it. Then suddenly the stock starts reclaiming key pivots, catalysts send it higher, the name starts breaking major resistance levels, reclaiming the IPO AVWAP, and holding above moving averages for the first time in years. That’s where my interest becomes visible. That’s the moment supply/demand dynamics begin changing.... And once institutions realize a stock has entered a true Stage 2 trend, they often HAVE to continue buying because their size physically cannot enter/exit positions quickly like retail traders can. That’s why these moves can become so explosive. A lot of people think I’m just buying random breakouts, but the reality is my entire process revolves around identifying compression before expansion. I’m constantly asking: “Is this stock transitioning from dead money into institutional leadership?” If the answer is yes, the upside can become absurd relative to the risk if you position correctly early enough. And another important thing...is that I’m not trying to predict the exact top. I just want to recognize the shift early, position with controlled risk, and then let the market do the work if the trend truly develops. That’s why I constantly preach... > tightness, > higher lows, > volume contraction, > relative strength, + Stage 1 → Stage 2 transitions. Because over and over again, those are the names that tend to become the next monsters. $DOCN was just another reminder! Chart: $DOCN.
iain tweet media
iain@ohiain

+200% in 46 trading sessions, and this is exactly why I’ll keep preaching Stage 1 → Stage 2 transitions folks! I first talked about $DOCN back in November during the base, again in January as it started to tighten + now it’s confirmed my thesis. These are the moves I’m trying to get positioned in before the crowd shows up and just sit. There are always early signs...tightness, higher lows, volume drying up, then expansion. The goal isn’t to find the "perfect entry" on these names, but to recognize the shift, respect price, get positioned with minimal risk, and continue refining the process every single time! I'm assuming @ShakePryzby1 is still in this monster!?

English
19
26
223
27.2K
roman
roman@snw_lp·
@SteveDJacobs The number in group header on the right side, is it a group RS?
English
1
0
1
77
Steve Jacobs
Steve Jacobs@SteveDJacobs·
📈Leading Stocks In Leading Industries Each table includes: - Stage Analysis - ATR Extension to SMA50 This can be useful when building your watchlist 👀as you want to "focus on leading stocks in leading industry groups" - William O'Neil. * top 24 Finviz Industries Heading color indicates Sector
Steve Jacobs tweet mediaSteve Jacobs tweet media
English
2
5
43
2.7K
Steve Jacobs
Steve Jacobs@SteveDJacobs·
📈Guru Screener - Qullamaggie Minervini Stockbee Below is the "Guru" scanner* of the excellent work of @Qullamaggie @markminervini and @PradeepBonde - Qullamaggie Breakouts - Minervini Trend Template - Stockbee 9 Million Movers - Stockbee 20% Weekly Movers - Stockbee 4% Daily Movers * based on my interpretation Results have been limited to stocks less than 5x ATR-to-SMA50. The ATR-to-SMA50 extension is shown in the "badge".
Steve Jacobs tweet media
English
14
26
230
18.2K
Nick Schmidt
Nick Schmidt@NickSchmidt·
Most of my discipline is really just stepping away when I know I shouldn’t be making any decisions. If I was forced to sit at the screen and watch the market every hour it was open I would be a terrible trader. I would always convince myself there’s something to do. Stepping away and controlling my environment > pure willpower alone.
English
22
7
205
7.9K
Elite Swing Traders
Elite Swing Traders@1ChartMaster·
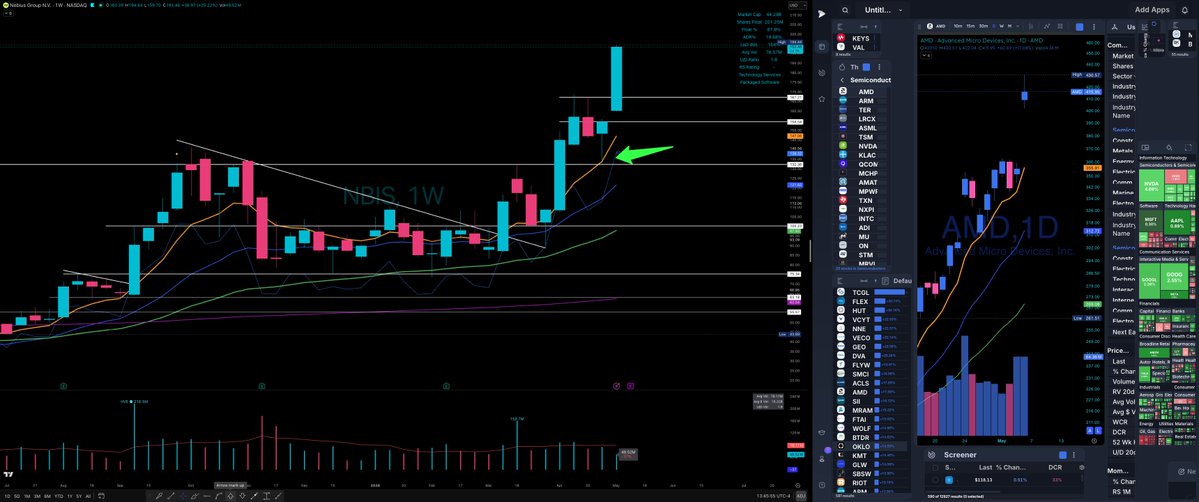
$NBIS here's how you buy RS on weakness. Retest off the 8 week for the S/R flip. If you miss the breakout buy the retest. +42% in 6 sessions.
Elite Swing Traders tweet media
English
6
2
125
6.7K
Richard Moglen
Richard Moglen@RichardMoglen·
We're current working on broker integrations for @Deepvue. Please reply below with the main broker that you use 👇
English
217
0
101
40.1K
Stephen Trades
Stephen Trades@Stephen_Trades1·
@snw_lp @ohiain If it doesn't have 0.5x ATR worth of cushion, I reduce the position in proportion. Ex - if I have 0.25x ATR, I'll cut the position in half. If the position is red, I will not carry any of it.
English
1
0
2
117
iain
iain@ohiain·
This 1 simple rule has saved me a ton of headaches: If I’m not in cushion into close on entry day, I either size down or cut it entirely. When I enter a trade, I want it to work for me immediately... that early confirmation is often the clearest tell I’m in a potential winner!
English
9
12
266
41.7K
Justin Banks
Justin Banks@RealJGBanks·
THIS STOCK SCREENER FINDS EVERY LEADER $MU $SNDK $WMT $INTC $CCL $GME It shows momentum before it’s obvious I’ll share the screener RT + comment BANKS so I know who actually wants it
Justin Banks tweet media
English
957
552
1.5K
209.6K
roman
roman@snw_lp·
@SteveDJacobs Looks good! Can you please explain logic behind coloring tickers and their background?
English
1
0
1
71
Steve Jacobs
Steve Jacobs@SteveDJacobs·
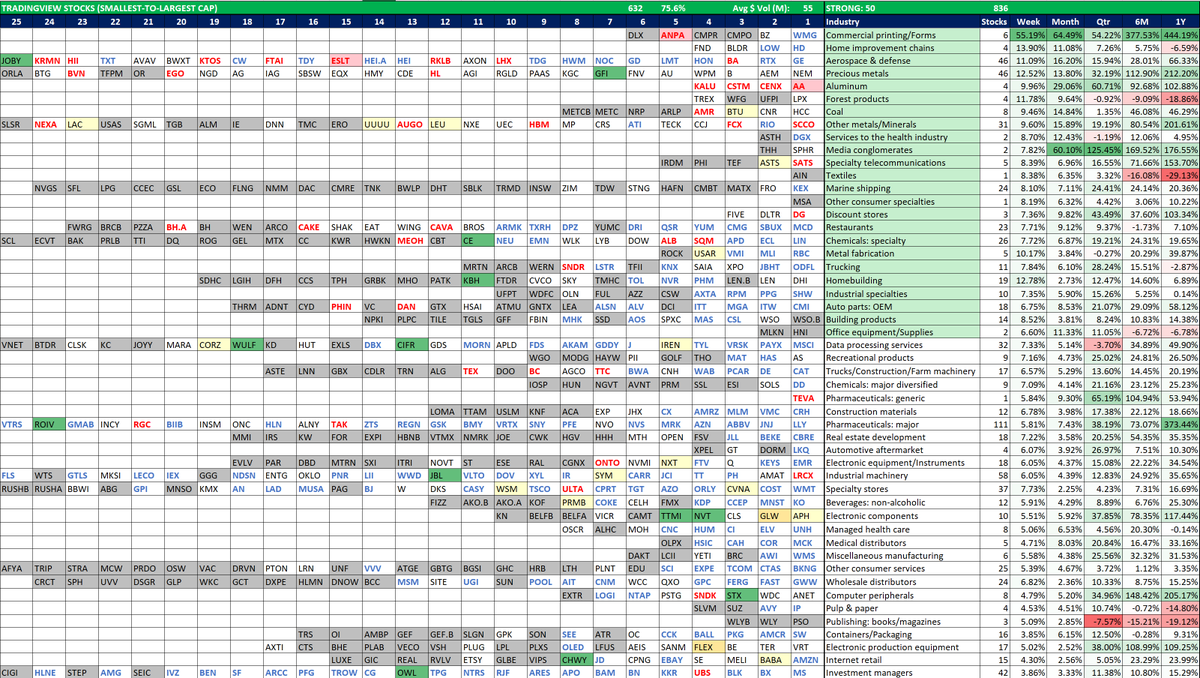
📈Leading Stocks In Leading Industries (TradingView) The chart shows largest stocks in the strongest industry groups, based on "Week x Month" Relative Strength (RS) Watchlist 👀 Scan 1: $GFI $CE $ASO $STX $TTMI $ROIV $IONS $JBL $OWL $JOBY $CHWY $PTCT $KBH $WULF $CYTK $CIFR $NVT Scan 2: $EXEL Sacn 3: $CVNA $FLY $ASTS $PPTA $BTU $CRNX $UUUU $WSM $PRMB $SYM $APH $USAR $LEU $BABA $NXT $MIR $CORZ $IREN Scan 4: $GLW $JAZZ $FLEX 🏭Industries: sorted ⬆️ strongest-weakest ⬇️ Stocks: sorted ⬅️smallest-to-largest ➡️market cap “You want to own the leading stocks in the leading industry groups.” - William O'Neil * Daily $ Vol >= $50M
Steve Jacobs tweet media
English
3
6
42
3.3K