
stock spider
319 posts

stock spider
@spider_stock
All trades are just my opinion. Do your own DD. love you bye!
Utah, USA Katılım Temmuz 2016
42 Takip Edilen40 Takipçiler

🚨When a Stock you have just longed breaks your stops & swipes back up and runs its called "Reclaim" or "Undercut & Push"
Many times stock will do this from
Support Level
Key EMA Levels
Pscyh Levels
When that happens get back in and use same level as stop that it bounced off!
English
@BoxTraderVK Is your R1 a label or just you charting it after it hit there?
English

$MNQ $QQQ
Dont need anything
Clean Chart
VWAP
Pivot Points
Volume
Understanding of Chart Patterns,
FOCUS
that's it

Vinod@BoxTraderVK
English
English

*TRUMP SAYS US TO HELP SOME SHIPS LEAVE HORMUZ STARTING MONDAY
English
@BoxTraderVK Would you not short $SOXL instead of long $SQQQ?
English
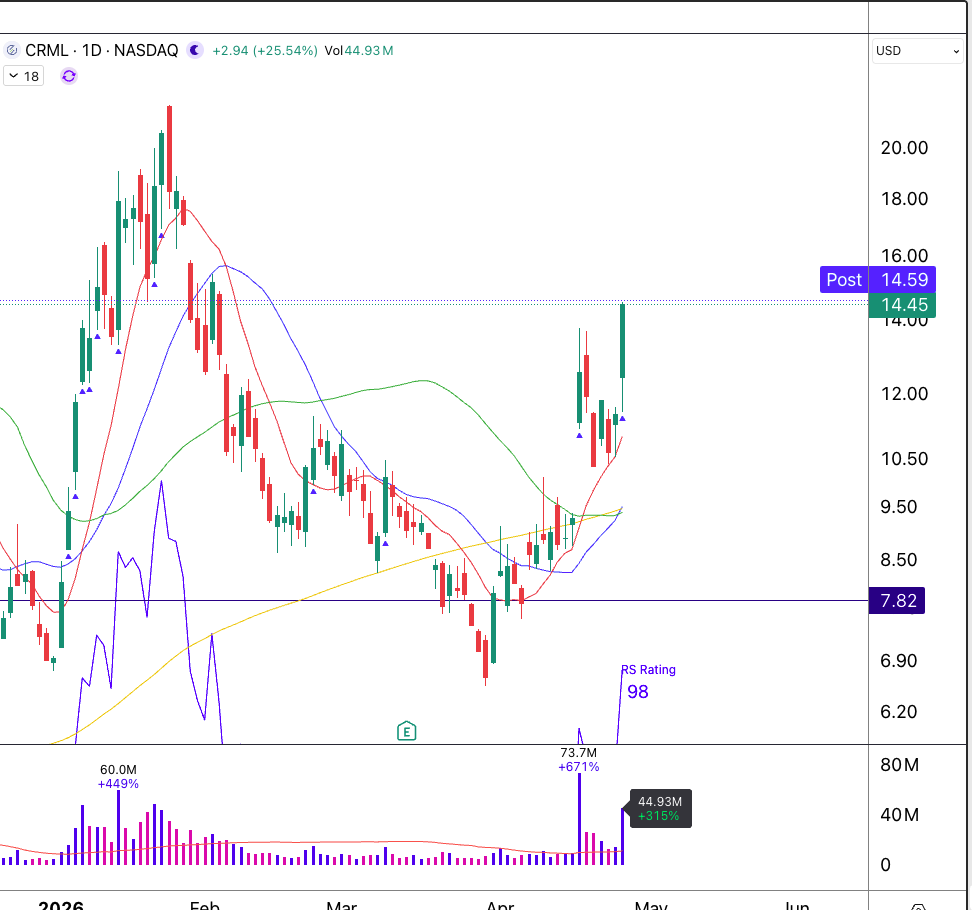
$CRML
Indeed power of KQ Concepts
now, I will chant 10 & 20, 10 & 20 @Qullamaggie
Vinod@BoxTraderVK
$CRML $CRML will you be my next $ARM to hold my hand and show me the POWER of KQ concepts?
English
English

@ripster47 @TENETTRADEGROUP I took a put on $CAR this morning, which I usually avoid meme stocks, but I felt comfortable with your guidance, and I made 152% profit. Thank you!!!
English
$CAR UPDATE 🚨🚨
RIPSTER MTF MAGNET COMPLETE
Concepts i teach here, we execute live
Traders held for targets not cutting early for Huge Returns
@TENETTRADEGROUP
Video Recap tonight

English

The $SPY gap up last week wasn’t confirmed under the hood.
Put premium kept expanding.
IV stayed bid.
Skew stayed defensive.
That’s not bullish positioning - that’s hedging into strength.
I was adding $SPY and $TSLA puts into that move while price was still squeezing higher.
Now we head into open with weekend crude +7% on geopolitical headlines.
This is what I mean by trading positioning, not price.
I shared this - and a lot more - LIVE with subs throughout the week.

English
stock spider retweetledi
stock spider retweetledi

If anyone tells you that in order to be successful in trading you need to make some unknown discovery on your own... This is a lie!!
- I learned about volatility contraction and progressive exposure from Mark. @markminervini.
- I learned about momentum bursts and Episodic pivots from Pradeep @PradeepBonde
- I learned about the importance of creating a model book for myself with 100s of past examples. As well as the idea of focusing on higher ADR stocks from Kristjan @Qullamaggie
- I learned about stage analysis from Stan @StanWeinstein13
- I learned how to read and interpret COT data from Jason @Crowded_Mkt_Rpt
- I learned the right side of the V concept and proper bet sizing on A+ opportunities from Lance @TheOneLanceB
- I learned to think a little more contrarian from watching @TheShortBear
- I learned about the flat base breakout and value in leading groups from @PatrickWalker56
- I learned about the HVC/HVE edge from @AmeetRai
- I learned about trading more aggressively during high momentum periods from @DanZanger
- I learned about the Undercut and rally or Double top short sale setups from Gil Morales @gilmoandco
- I learned how to think about creating and implementing systems from @Peoplewish
- I learned the failed follow through setup on an intraday timeframe from @InvestorsLive
- I learned about the importance of prior day channels from @danshep55
- I learned about support and resistance gaps for entries from @NickDrendel
- I learned about using the 50sma as a guide to measure extensions from @jfsrev
- I learned about creating a daily trading plan from Marcel Link.
- I learned about the CANSLIM methodology from Bill O'neal
I'm sure there are many I missed but the point is:
Trading knowledge is passed down from one generation to the next. But it is up to us, the trader, to implement what we have learned in a safe manner while we put together all the pieces for ourself.
We live in a time where you DO NOT need to make up some magical elixir for trading in order to be successful.
All the people mentioned above have found an exploitable edge in the market, and like myself relentlessly execute that edge over and over.
I am personally grateful for all of the educators I've had along my journey; which is part of the reason I so willingly share any bit of knowledge I acquire along the way. The same way they all graciously imparted knowledge on me.
English
stock spider retweetledi

3 weeks ago I argued the US goal in Iran is to seize the global oil spigot. Venezuela in January -> Iran in February.
Neutralize every supply channel outside the dollar system within 90 days. Achieve a compliant successor government and complete energy dominance.
The oil thesis was the obvious layer. However, when you zoom out & view the last four years as a single sequence rather than isolated geopolitical events, the architecture of the grander US plan becomes visible.
1st was Europe, which laid the groundwork.
The Ukraine conflict provided the justification for sanctions that collapsed Russian pipeline gas from 150 billion cubic meters to 40.
Then Nordstream was destroyed, which rewired the entire European energy system permanently. The US went from supplying 28% of Europe's LNG in 2021 to 58% by 2025, exporting a record 111 million MTs, the 1st country in history to break 100 MT.
Europe was transformed from a customer with options into a captive market now purchasing its survival in USD.
2nd was Syria.
The fall of Assad severed the critical node connecting China's Belt & Road Initiative to the Mediterranean.
The trilateral railway linking Iran, Iraq & Syria, designed to bypass Western maritime chokepoints, was completely destroyed.
This isolated Iran geographically & cleared the path for what came next.
3rd was Venezuela.
In January the US effectively took control of the world's largest heavy crude reserves. The US Gulf Coast has the most advanced refining complex on earth, specifically built for heavy sour crude. Phillips 66, Valero & the rest are now positioned to process hundreds of thousands of barrels of Venezuelan crude daily.
The US captured a massive strategic reserve & solidified its position as the dominant exporter of refined petroleum products, an industry worth $110 billion in 2025 alone.
Venezuela & Iran were the two major oil supply channels that existed outside the dollar system. Both produce heavy crude sold primarily to China & evaded US financial supervision. Both now being neutralized within 90 days, which leads us to..
4th is Iran & the Middle East energy shock.
Israel struck Iran's South Pars gas field, the world's largest natural gas reservoir. Iran retaliated against Qatar's Ras Laffan, the single largest LNG facility on earth, responsible for a fifth of global supply. QatarEnergy's own assessment is that 17% of export capacity is gone and recovery will take up to 5 years. The Strait of Hormuz is closed. European gas prices spiked 70%. Asian spot prices doubled.
The only remaining scaled supplier? The United States.
If Iran falls & a successor government is installed that the US controls or influences (the Delcy model described weeks ago) then roughly 40 to 45 million barrels per day of global production out of 103 million is effectively under US control. OPEC becomes irrelevant because the US coalition is now the marginal producer. Now add the gas dimension & it goes beyond oil.
This war is solidifying the petrodollar system as it evolves into a hybrid petro/LNG-dollar. The old system was built on Saudi crude priced in USD. The new system is built on American crude plus American gas from the Gulf Coast, with no alternative supplier of comparable scale. The dependency is deeper because LNG infrastructure requires long term contracts & regasification terminals that lock buyers into supply relationships for decades. Europe & the Pacific allies (Japan, South Korea, Taiwan, etc.) cannot pivot away as there is nowhere left to pivot to. They're now locked into the US energy system.
The market confirms this. DXY went from 96 to 101. Gold down ~20% from its January all time high. Bitcoin down 20% on the year. Brent above $100. European & Asian institutions are liquidating precious metals and crypto to buy dollars because they need dollars to buy the only remaining scaled energy supply. The world is selling its gold to buy American energy in American currency. The dollar is now being weaponized through energy dependency.
The structural repricing is happening regardless of how the conflict resolves.
But the US grand strategy goes deeper..
Artificial intelligence is a physical industry. It runs on power and chips. Data centers require massive uninterrupted baseload electricity, primarily provided by natural gas. Semiconductor fabrication requires helium & rare earths.
By choking the Strait of Hormuz & crippling Middle Eastern LNG & helium production, the US is systematically degrading China's ability to power its data centers & fabricate semiconductors at scale.
The US is energy self sufficient, especially with newly captured Venezuelan reserves & expanding Gulf Coast capacity running on domestic gas.
On the other hand, China is import dependent & every joule it imports effectively now transits chokepoints the US Navy controls..
Iran was the Belt & Road's overland energy bypass, the corridor that allowed China to mitigate the Malacca Trap. With Iran neutralized that corridor is severed. China faces a world where its compute infrastructure competes for scraps on a depleted global LNG market, while American data centers run at full capacity on domestic energy.
Russia is next in the sequence. A post-war Iran reopening under US influence competes directly with Russia for the same refineries in China & India at lower cost. Iran's production costs are lower. Russia loses its last structural advantage in heavy crude & its economic lifeline. Additionally, under the Iran war cover, Ukraine has been opportunistically destroying Russian energy infrastructure & all signs point towards Russia being at the end of the line. The message from Washington becomes very simple: we dismantled two regimes in three months, your economy is about to get crushed, sign the Ukraine deal.
Then Trump sits down with Xi holding every card. Complete energy dominance. The hybrid petro/LNG-dollar fortified, Iran cleared, Russia cornered, & China facing the Malacca Trap fully closed with no remaining energy bypass.
Israel & the GCC are absorbing the kinetic cost of a conflict whose primary beneficiary, counter to the mainstream narrative, is actually America (First). Qatar offline for 5 years reprices the entire global gas market in favor of US exporters for the remainder of the decade. The Gulf states face years of rebuilding. Europe faces its 2nd energy crisis in four years.
Sure, the average American might face temporary moderate inflation & higher gas prices. But if you are the architect of the US empire & you view the rise of China & Chinese ASI as an existential winner takes all scenario, the collateral damage is acceptable cost.
Whoever controls the energy corridors controls the monetary system. Whoever controls the monetary system & the energy supply simultaneously controls the compute infrastructure that determines which civilization builds ASI first.
The US is seizing all 3.
English


@MikshuAlpha @MikshuAlpha I joined the channel on Sunday. Is there a way I can text you on telegram? My name is shahab s
English
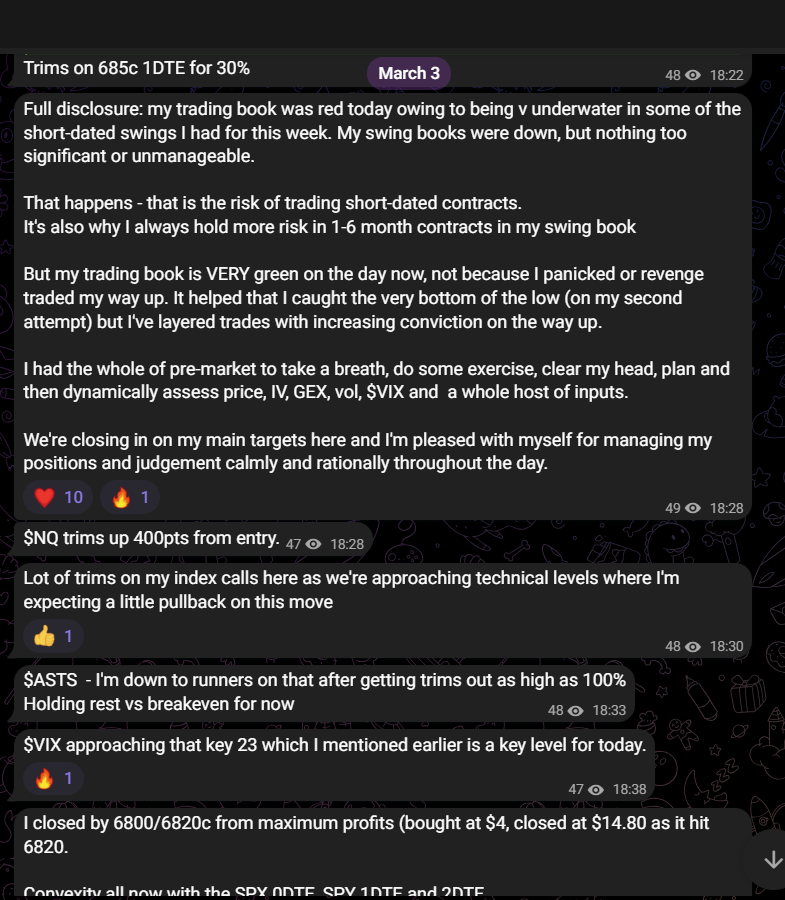
I'm having one today (mildly red so far and there's still 45 mins to go).
It's also not a simple question because I run two books — swing positions and an actively managed intraday trading book. Sometimes one is up while the other is down.
Swing trading naturally has red days. Equities don't move in straight lines.
My intraday book has far fewer. I've been doing this nearly 30 years, half of that on a Tier 1 investment bank desk, so risk management and execution discipline are ingrained.
Over the last couple of weeks I've had some very strong index scalping and intraday trend trades and hadn't had a red day in that book for ~2.5 weeks until today.
Losses are part of the business. I don't hide them.
In fact, here's an example from last week where I started the day red and talked through the process of managing it in real time.
English
Pre-market analysis – Wednesday 11th March 2026
1. Market Summary
$SPY followed Monday’s sharp squeeze with a failed continuation attempt yesterday. Price opened 677.26, pushed to 683.37 just under the 50-day EMA, and then reversed hard on renewed Middle East geopolitical headlines to close 677.07, essentially flat.
The late-day rejection is the key signal. Markets tried to reclaim intermediate resistance and failed. In a fragile macro environment that type of failure usually leads to continued tactical volatility rather than immediate trend recovery.
We are currently in a balanced but unstable regime:
• Index still below key short-term MAs
• Volatility elevated
• Macro catalysts dominating price discovery
• Institutional options flow increasingly tactical
• Consistent mid-term callflow evident in tech/QQQ
Near-term path remains two-sided:
Bull case
Geopolitical de-escalation or positioning unwind could trigger a violent upside squeeze toward ATH zones.
Bear case
Distribution pattern + elevated vol structure suggests a retracement toward weekly lows remains probable in coming weeks.
For now this remains a trader’s market rather than a swing investor’s market. Your focus on index scalping and short-duration momentum trades is exactly the correct playbook in this regime.
2. Macro analysis
The major catalyst today is US CPI.
Consensus expectation:
2.5% YoY headline inflation
Initial CPI prints have broadly come in line, which means the report itself is unlikely to reset the macro narrative immediately.
However several macro factors still dominate:
US
• CPI in line but recent oil spike not yet fully reflected
• Oil stabilising near $88 after a strong rally
• FOMC decision next week remains the major macro catalyst
Geopolitics
• Middle East tensions continue to be the primary short-term market driver
• Yesterday’s late session selloff was directly tied to war headlines
Europe / China / Japan
• No major new policy surprises overnight
• Global macro backdrop still risk-sensitive to energy and geopolitical flows
Conclusion:
The CPI itself may not move markets dramatically, but geopolitics and oil will likely dominate the next few weeks.
3. Momentum and breadth
Momentum structure remains weak.
Key observations:
• $SPY remains below the all key moving averages
• Distribution characteristics visible in recent selloffs (impulse gap down moves followed by slow, low volume retracements)
Breadth has also deteriorated recently:
• Small caps continue to underperform
• Equal-weight indices failing to lead
• Momentum leadership fragmented
This confirms we are not in a broad risk-on environment.
Instead we have tactical rotations and squeezes driven by positioning and volatility.
4. Volatility
Volatility regime remains elevated and unstable.
$VIX
Range yesterday: 22.14 – 26.17
Close near 25
$VVIX
Opened 128
Spent most of the session around 116
Spiked back above 120 on geopolitics
Critical signals:
• VIX term structure remains in backwardation
• VVIX elevated
• Volatility risk premium rising again
Backwardation historically means:
• Market stress remains present
• Probability of additional volatility spikes remains high
= Another volatility expansion is likely soon.
5. Credit and liquidity
Liquidity conditions remain fragile.
Observations:
• Market on close yesterday was +762m buy imbalance, suggesting late positioning support
• Oil price shock acting as a macro liquidity drain through inflation expectations
Credit markets are not yet flashing systemic risk, but they are not supporting risk-on either.
Net interpretation:
Liquidity is neutral to slightly risk-off.
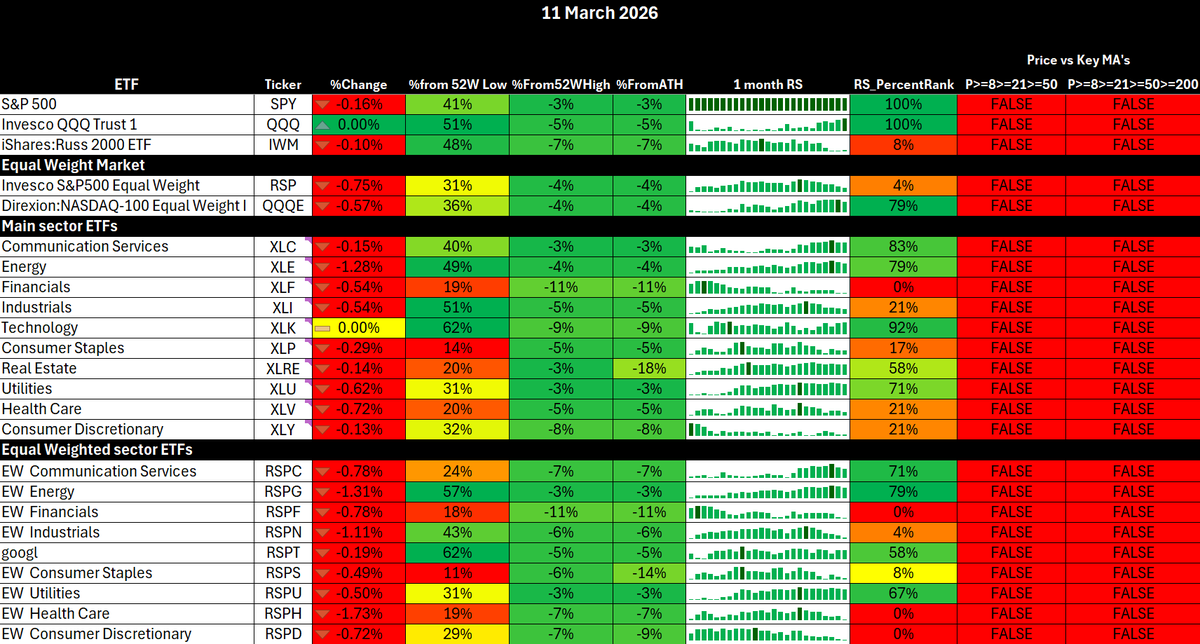
6. ETF and Sector rotation
Index ETFs
Defensive sectors showing relative resilience
Strongest relative performance from:
• XLC Communication Services
• XLU Utilities
• XLE Energy
This reflects the current macro environment:
Energy strength = geopolitical risk
Utilities strength = defensive rotation
Cyclical and growth laggards
Weakest sectors currently include:
• XLRE Real Estate
• XLF Financials
• XLY Consumer Discretionary
• XLK Technology
These are classic risk-on cyclical sectors, and their weakness confirms risk appetite remains suppressed.
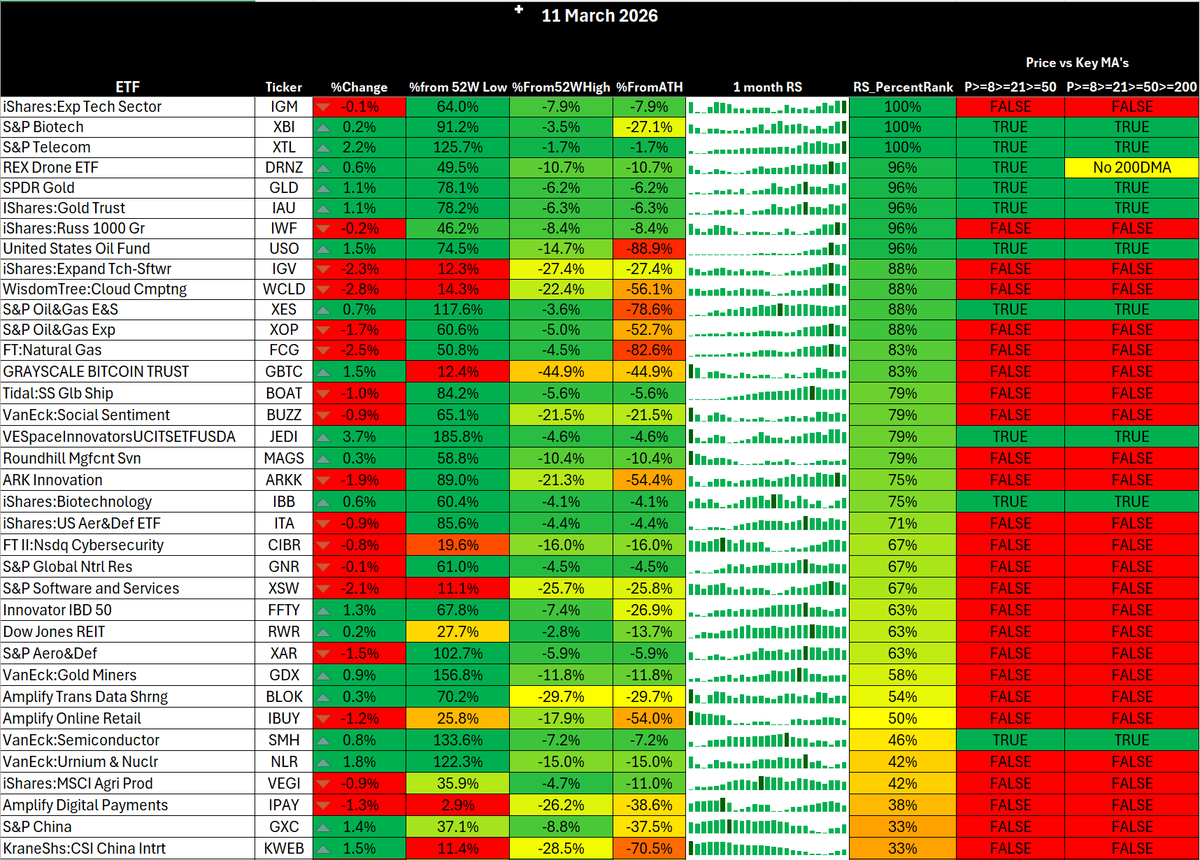
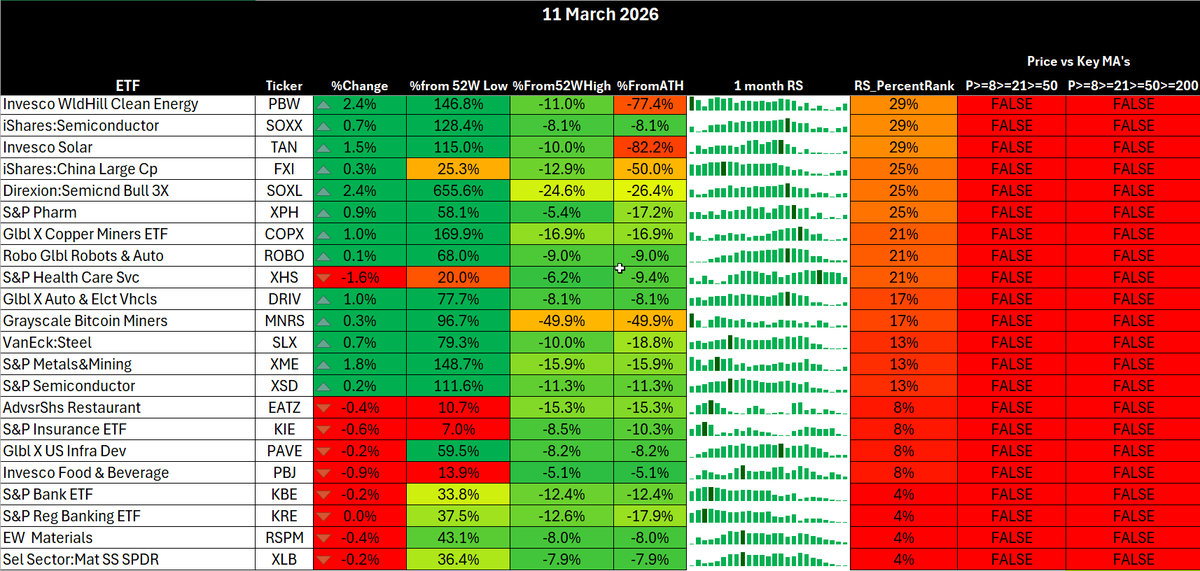
High RS thematic sectors
Relative pockets remain in:
• Telecom / communications
• defence and drone ETFs
• energy complex
Meanwhile large drawdowns are visible in:
• cloud software
• biotech
• speculative growth
Key takeaway
The rotation profile remains defensive and macro-driven, not growth driven.
7. Summary
Market regime remains high volatility and tactical.
Key signals:
• $SPY failed reclaim of 50DMA
• Volatility structure still stressed
• Geopolitics dominating price discovery
• Sector leadership defensive
This aligns strongly with what I've been trading: short-duration index momentum trades rather than directional swings.
My bias:
Short term
Neutral to slightly bearish.
Medium term
High probability of a deeper corrective move to backtest recently lows near the 200DMA within the coming weeks.
However the path there will likely include violent squeezes and positioning unwinds.
Tactical framework
Best strategies in this environment:
• Index scalping ($SPX, $NQ)
• Tactical options flow tracking
• Relative strength setups only
• Reduced size due to volatility
English
Based on this analysis, I posted positioning in my channel earlier today and now I am:-
1. currently trimming $SPX puts bought pre-market (on IBKR) for 500% and covering some of my $NQ short for 290pts.
2. delivering commentary based on GEX, IV skew and chart technicals on downside targets to further optimise PnL on remaining position.
Channel link in my bio.
MikshuAlpha@MikshuAlpha
What the VIX complex is quietly telling us about the next few sessions The volatility surface is starting to shift in a way that’s worth paying attention to. Front-end VIX curves have repriced higher today, particularly around the Mar10 and Mar17 expiries, with upside strikes seeing the biggest adjustment versus yesterday. That usually signals traders are paying up for short-dated protection rather than broad macro fear. The term structure is also very front-loaded right now. Near expiries are elevated while the curve falls away further out, which typically points to specific event risk over the next few sessions rather than a prolonged bear regime. On the charts, VIX is pushing back into the mid-20s while VVIX is turning higher, which means the market is bidding optionality on volatility itself — something that often happens when participants expect the next move in equities could be fast rather than gradual. Flow is consistent with that theme as well, with notable purchases of upside VIX calls in March and April, including size in the Apr15 25C and 28C. My interpretation is that the market is clearly hedging near-term sharp downside risk, with positioning pointing towards a selloff today and/or Monday, but that sell-off gets bought up quickly (e.g. a sharp candle wick down and back up sameday) I'm positioning for a sharp move down to test trendlines at 675.32 and 660-661 I post this kind of positioning analysis daily in my MikshuAlpha channel. If you want to understand what the options market is positioning for before it shows up in price, that’s where I share it first. Link in bio.
English
stock spider retweetledi
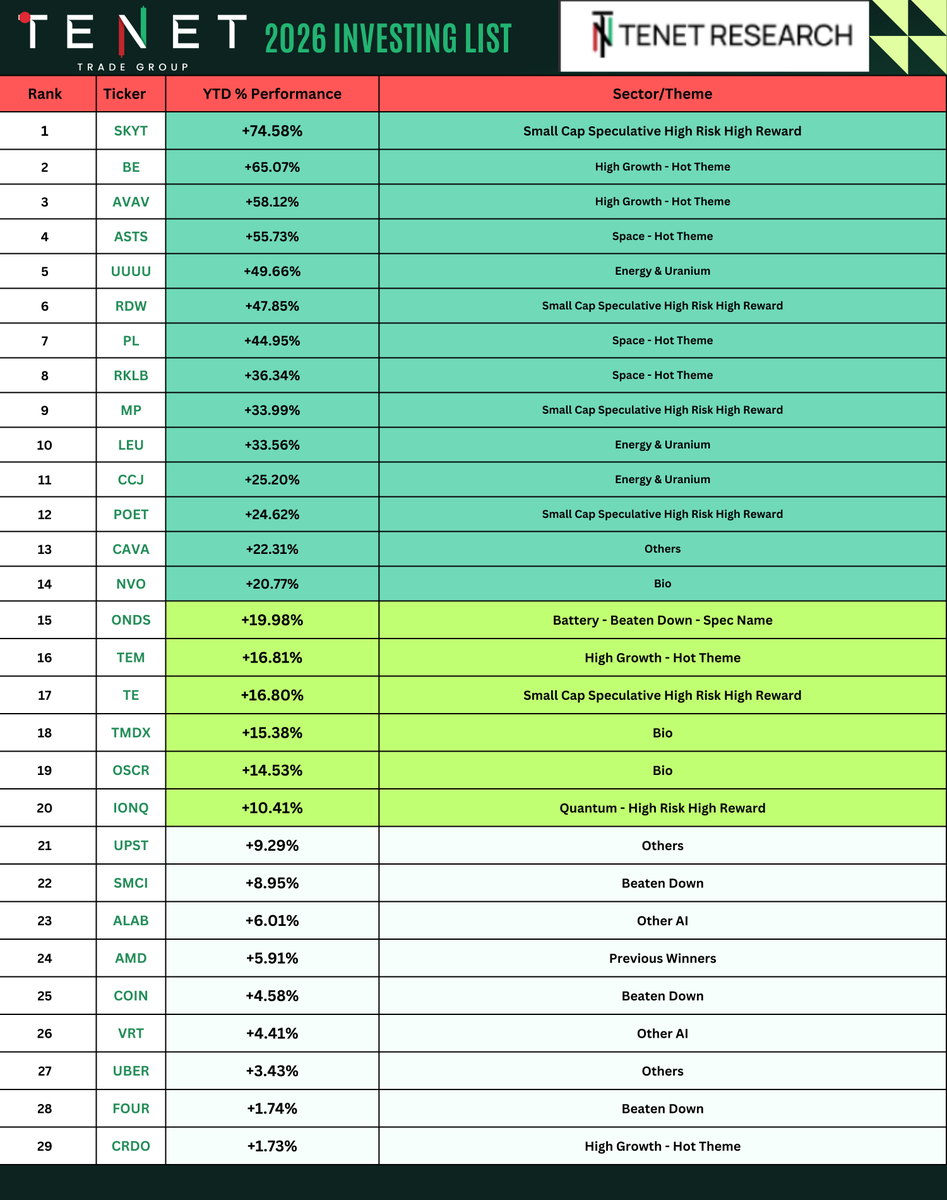
🚨 2026 Investing Performance Update
Here is our full investing names at Tenet Research @tenet_research ,
29 out or 52 Names are starting year huge green
These Year list is skewed toward Mid Cap, Hot Themes!
Insane performance already but software names big drawdown.
English
stock spider retweetledi
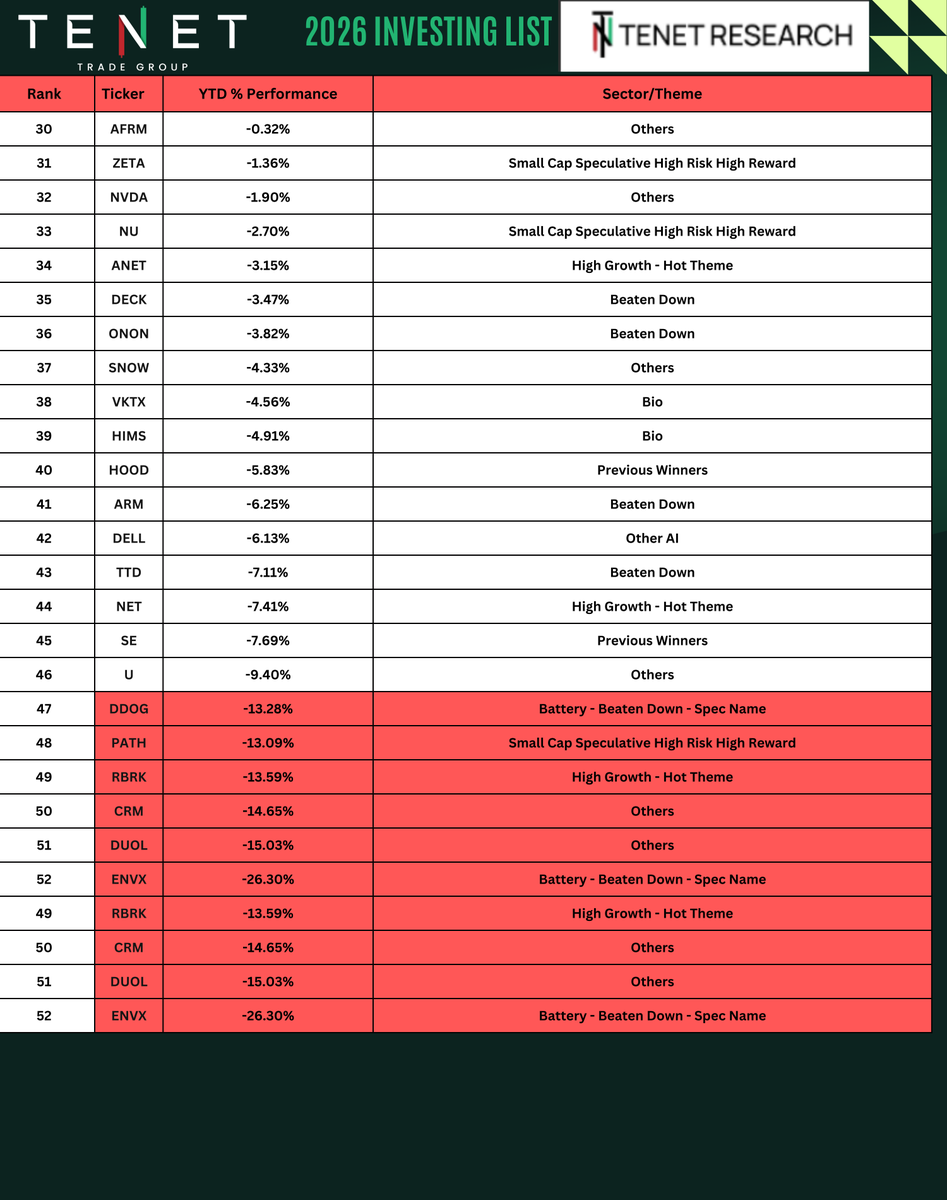
🚨2026 Investing Names Update
Here is our full investing names at Tenet Research @tenet_research Performance so far , 20 out or 52 Names are starting red , most of these are Software and Large Cap Sector as love is all in HOT THEMES
English

stock spider retweetledi
🚨🎁Cash Giveaway As promised!
4 X $250 Cash - Total 1K$
Will be picked from comments
Enter
✅RT/LIKE THIS
✅Follow All Our Accounts:
@tenet_research @TenetCharts @TENETTRADEGROUP @ripster47
✅Say Something Positive & Uplifting in Comments
Result in a week

English