Sabitlenmiş Tweet
Narayan
2.9K posts
Narayan
@student_charts
Student of Stock Market. Learning Technofunda. Charts and views are for educational purposes only. Not SEBI registered
Katılım Nisan 2010
103 Takip Edilen394 Takipçiler

@VineetGala I dont know when he sold SNDK, but BE bought in December as per disclosure around 100$.. 3x already..
English

Stanley Druckenmiller turned a 90day 400% gain in SanDisk into a rotation straight into the next AI bottleneck: power
He loaded up on Bloom Energy, which is already up 150% in the last month. Different league altogether 🐐⚡️ thestreet.com/investing/stoc…
English
@thechartist26 more than doubled from multi year breakout if 3 years is considered multi year
English

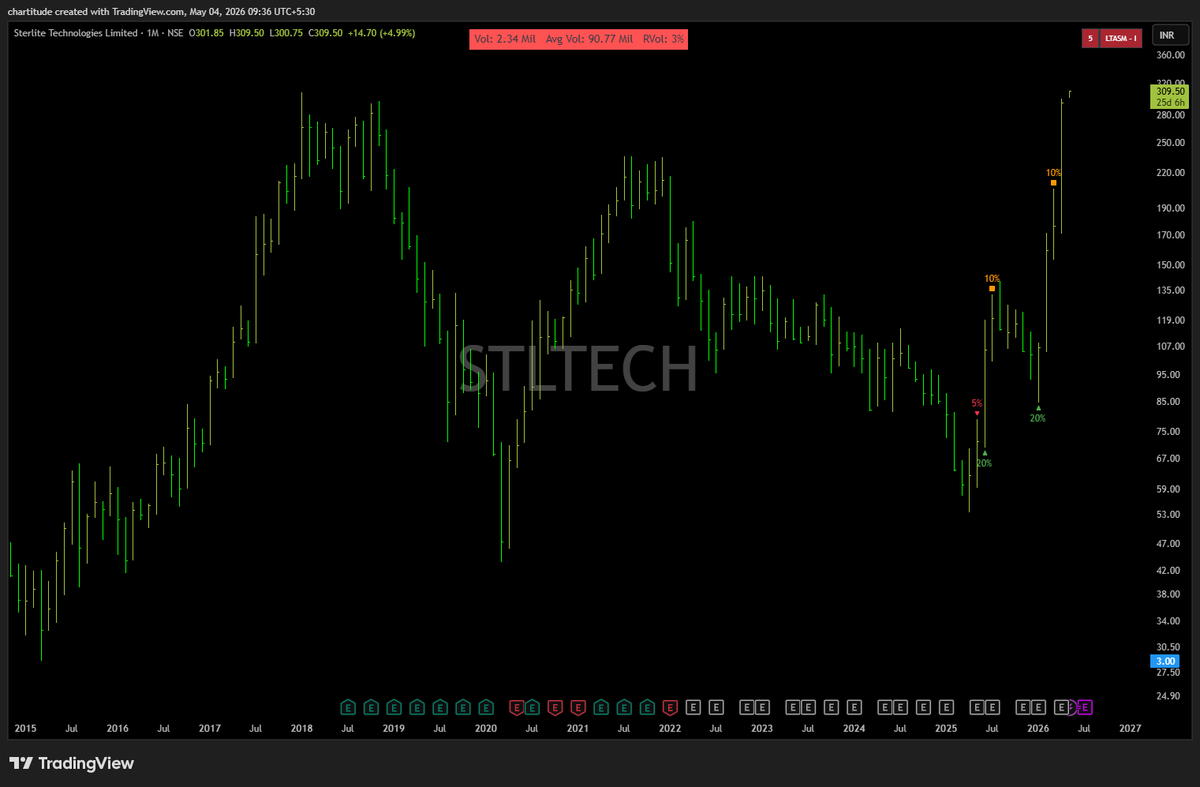
I am now waiting for multi-year breakout posts on Sterlite Technologies on X.
English

TradingView is mostly wrong with the earnings calendar, and it has been like this for years now. I don’t understand why they don’t fix it.
@tradingview
English
Narayan retweetledi

Narayan retweetledi

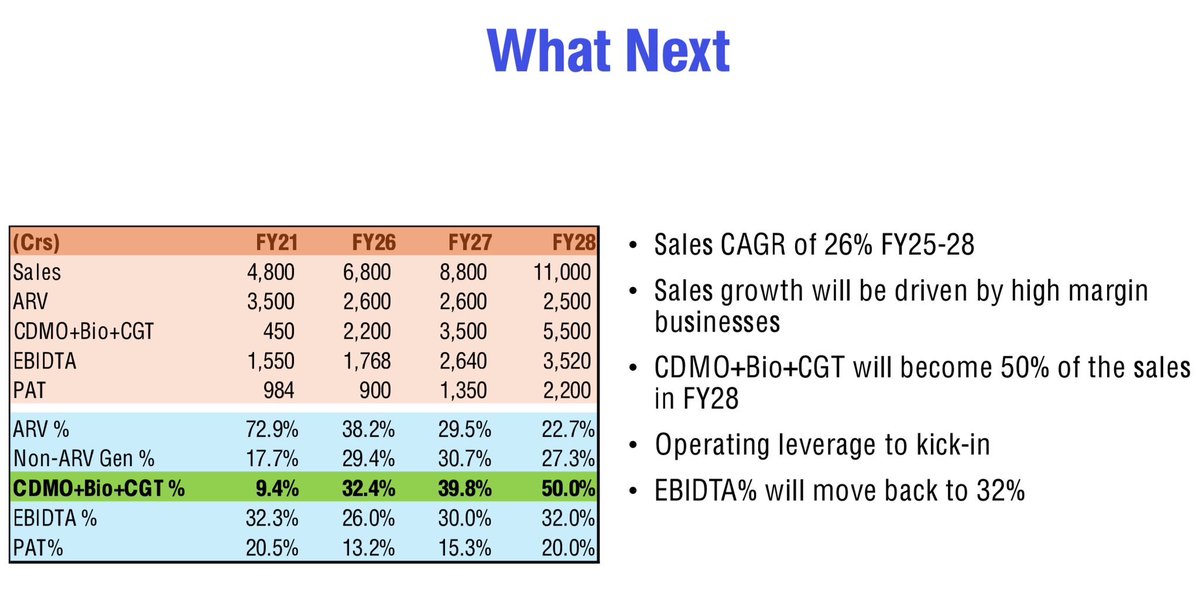
#Lauruslab meets my expectations- Sales, EBIDTA, PAT - margins everything.
This is what happens when you track the business for very long
jeevan patwa@jeevanpatwa
#Lauruslab my hypothesis presented today at Alpha ideas Transformed itself from ARV leader to fastest growing CDMO- 50% CAGR for CDMO FY25-28 FY28 nos will match with Divis FY26 nos. Similar top line 11000 crs with similar EBIDTA 32-33% and similar contribution from CDMO(50%). In fact, it has wider canvas (Bio, CGT, ADC) to play than Divis. Will it have mcap then similar to Divis now?
English
#MTARTECH
Now this looks like exhaustion move as its steepening up above trendline.. Let us see

Narayan@student_charts
Underestimated the move in #MTARTECH and also did not wanted to go oversize in this market
English
Narayan retweetledi
If the answer to “Can it give a 30-50% move from here?” is not a convincing yes, it’s not a stock worth putting on your watchlist.
Easy way to trim your list.
#BroTip
English
Last week markets had a 2 days pullback after monster move up from lows. Week started with recouping the losses of pullback on SMID indices. Young bull🐂🐂🐂
But Nifty need to reclaim 50dma, stay above it for SMIDs to sustain
#POWER #DEFENCE #DATACENTER #PRECISIONENGINEERING
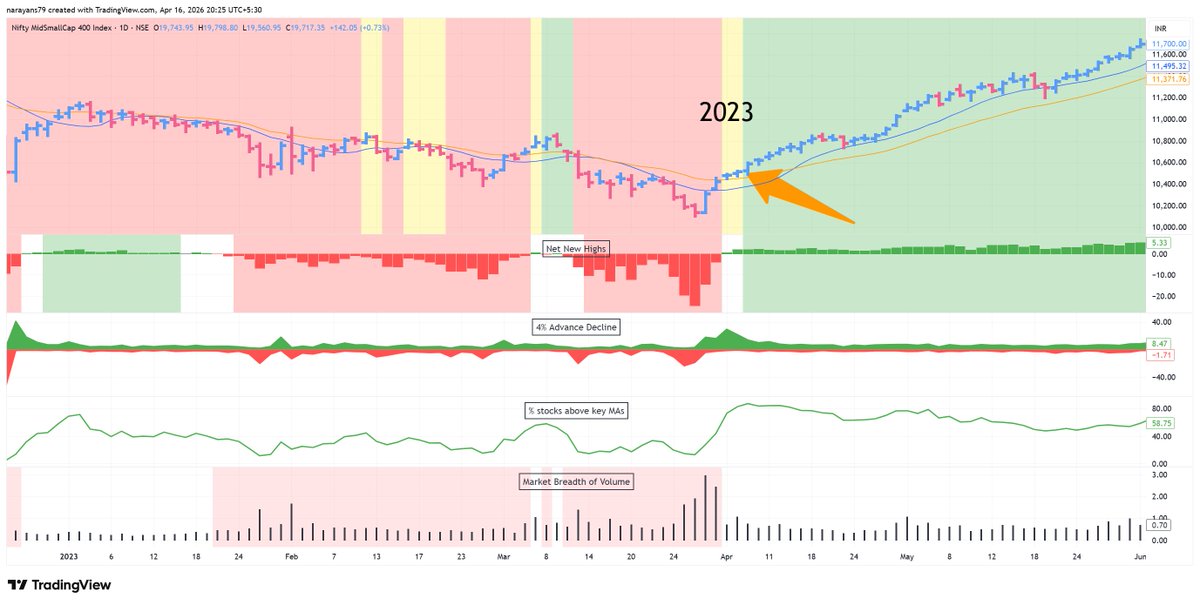
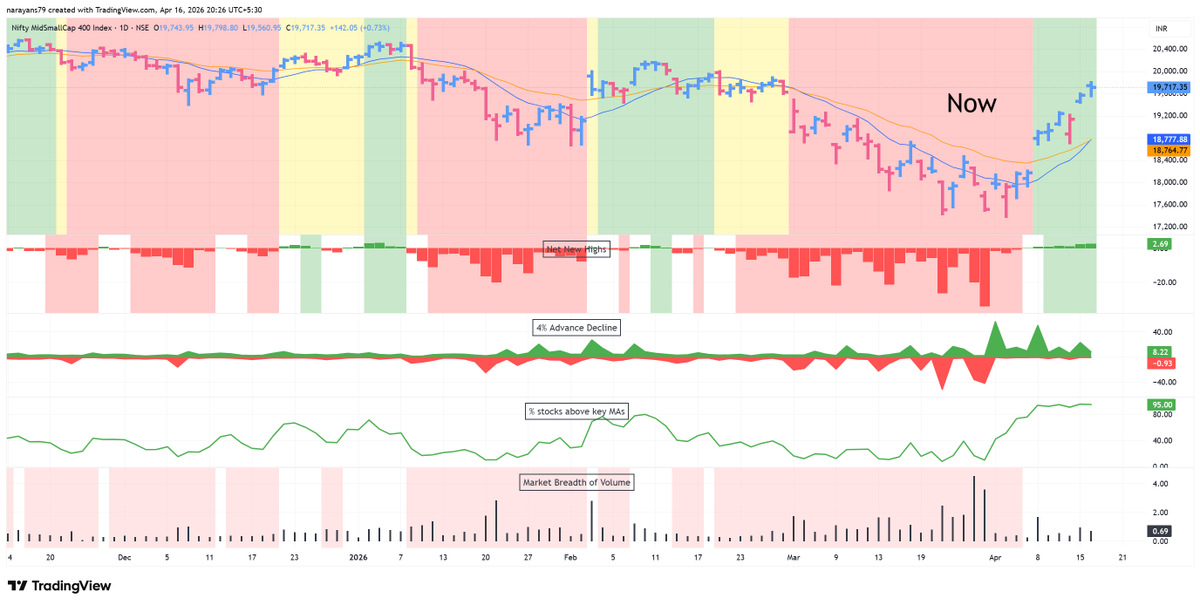
Narayan@student_charts
Are we in similar phase as April 2023 start of the bull run? Seasonility and near 18 months of correction supports the thesis.. And there is lot of urgency in buying of some leading stocks Let us see
English
Narayan retweetledi

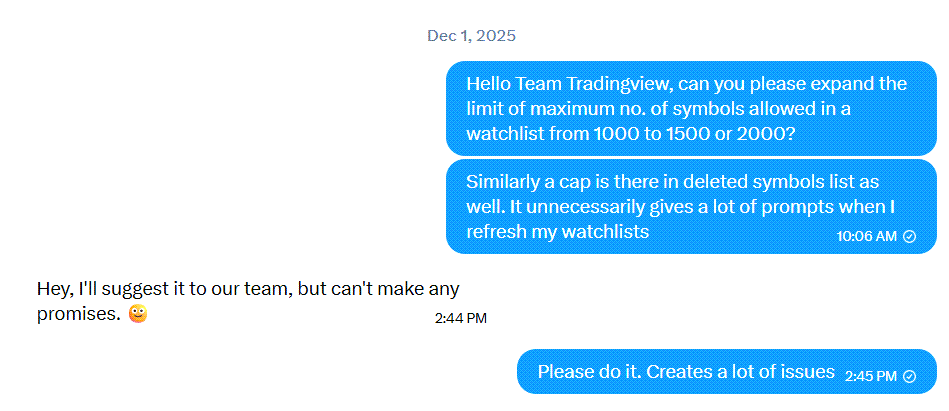
AN OPEN LETTER TO TRADINGVIEW FROM AN ADMIRER
I’ve always been a big admirer of the team at @tradingview for what they’ve built and how they’ve transformed the charting experience for traders. I’ve also been quite vocal about the importance of investing in essential tools rather than hesitating over such costs.
However, the recently introduced symbol limits per watchlist, even on paid plans, feel like a step backward. I understand the intent to increase ARPU and push upgrades, but reducing the Premium plan limit from 1000 to 500 symbols is quite restrictive, especially considering it’s already at the upper end of what retail traders in India can afford.
This change feels unjustified and, ideally, the earlier limits should be restored. If that’s not feasible, then at least increasing the caps would be a fair middle ground, bringing Premium back to 1000 symbols, and raising Essential and Plus tiers to 250 and 500 respectively.
Now, one might argue why anyone would need such a large number of symbols in a watchlist and how it actually helps.
What most traders, and even the team at TradingView, may not fully understand about India is the concept of circuit filters enforced by our regulators. This is quite unique to Indian markets. Since international platforms don’t provide a way to exclude stocks based on these filters directly in scanners, we are forced to first eliminate such stocks using local tools.
To avoid illiquid names, especially those stuck in 2% or 5% circuit filters, we have to create a refined “Total Universe” watchlist first. Only then can we effectively run scans on TradingView. If we skip this step and rely purely on inbuilt scanners, results often get cluttered with circuit-bound stocks, which are practically untradeable and hard to filter out afterward.
Currently, National Stock Exchange of India has around 2300 listed stocks. Even after filtering out illiquid names and those under strict circuit limits, we are still left with roughly 900 to 1100 stocks depending on market conditions. This already exceeds even the earlier limits. I had earlier requested increasing these limits, but the recent change has gone in the opposite direction, making it almost impractical to use TradingView’s watchlist-based scanning effectively in Indian markets.
I’ve used multiple platforms over the years, free and paid, desktop and web, and haven’t encountered such restrictive limitations elsewhere. This kind of constraint could actually give competing platforms an opportunity to challenge TradingView, at least in the Indian market.
On behalf of retail traders and the fintwit community, I would strongly request the TradingView team to restore the earlier limits. If changes are unavoidable, then at least consider increasing the limits as suggested earlier.
I’d also urge the fintwit community to support and amplify this, so the importance of this issue is clearly communicated.

English
@InvesysCapital @sachin_rt Same nostalgia.. One of the epic innings etched in memory.. Happy birthday Sir @sachin_rt
English

1998 . I was in college hostel. Friends gathered on footpath outside TV showroom to watch the match which turned out to be DESERT STORM.
Nobody moved. Crowd kept increasing to the point it caused traffic jam.
Happy Birthday Master Blaster @sachin_rt
English
Narayan retweetledi

Top Performers in US Stock Market since 2000
I want to share a self-hosted stock research tool that identifies and visualizes the most powerful price moves in US equity market from 2000 to current date. It processes raw daily OHLCV data for over 12,000 US tickers — including delisted stocks — and surfaces the top 7% performers each year for in-depth chart study.
Github link: github.com/willhjw/big_mo…
The project is inspired by the trading methodology of Kristjan Kullamägi (Qullamaggie), which focuses on learning from stocks that made exceptional gains in a short period of time. By studying these historical moves in detail — their price structure, volume behavior, and timing — traders can develop a sharper eye for recognizing similar setups as they form in real time.
This is also a use case for my open-source charting platform. github.com/willhjw/ib_cha…
If you find this project helpful, welcome to buy me a coffee. buymeacoffee.com/willhu
Disclaimer
Stock data and any statistics or charts derived from it are not guaranteed to be 100% accurate or complete. You are responsible for independently verifying the accuracy and suitability of the data before using it for any purpose.
Will Hu@traderwillhu
Thanks to AI coding, a complex learning process is now much simpler. I filtered the top 7% YTD stocks from 2000–2026 (including delisted ones), get 1400+ stocks, and visualized them with TradingView Lightweight Charts, featuring auto-marked highs/lows and direct period displays. Browse by year or symbol, even delisted stocks from the last decade like $LVGO and $TWTR are fully accessible. Once I refine the charting and annotation features, I will open-source this learning project.
English
Narayan retweetledi
@pankajgarg_ciet Nice write up Pankaj. Again active as with Market 😀.. Keep writing and share 👍
English
Narayan retweetledi

Narayan retweetledi

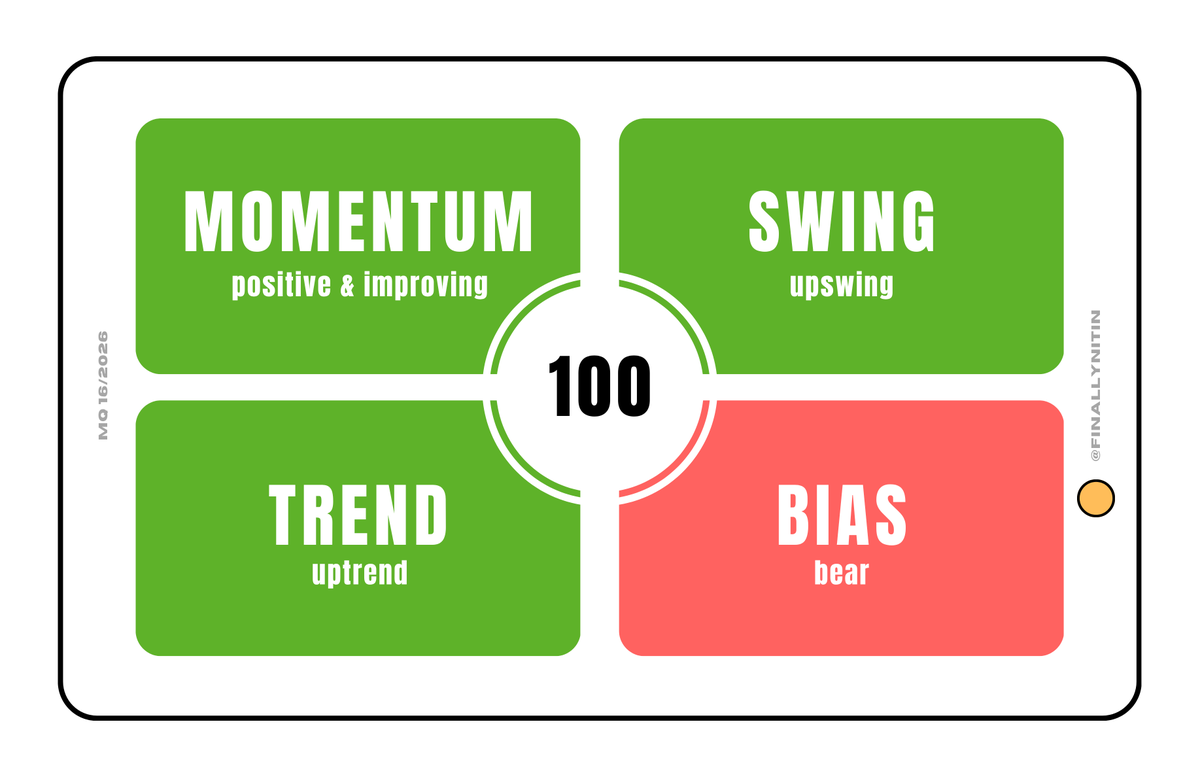
Market Quadrant 16/2026
An easy-money environment, with broad participation in the markets. Most stocks are still moving straight up without waiting to form conventional setups. Still, the market seems to need some more time to form a healthy number of constructive chart structures at the right sides of their respective bases.
Aggressive swing portfolios are making the most of this one-way bull swing, while conservative swing portfolios are still waiting for more quality setups to emerge in the coming days. Anyhow, all the swing traders participating in this upswing should follow strict risk management to handle the upcoming pullbacks.
⦿ Bias → Bear
From a long-term perspective, we remain in a bear market, as only about one-third of all stocks are positioned above their 200-day simple moving average.
⦿ Trend → Uptrend
The 52-week Net New Highs have remained consistently positive for the past three days. We are still in single digits, though. Over the past three days, most broad indices stayed consistently above their 50-day moving averages. About 75% of all stocks have remained above their 50-day MAs.
⦿ Swing → Confirmed Upswing
Most of the sessions in this truncated week had extremely strong 4.5R numbers. MBI stayed green throughout. All the broad indices stayed consistently above their 10-day MAs. About 95% of the stocks are trading above their 10- & 20-day MA, & for the second consecutive week, we stay overbought on very short-term timeframes. A consolidation/pullback would be most welcome here to improve the longevity of this upswing.
⦿ Momentum → Positive & improving
The overall market now has positive but improving momentum. Capital market, Power/Energy, Metals, Defence, Realty & Consumer durables are the strongest indices at present. There is no index with worsening momentum.
That's all for this week.
English
Narayan retweetledi

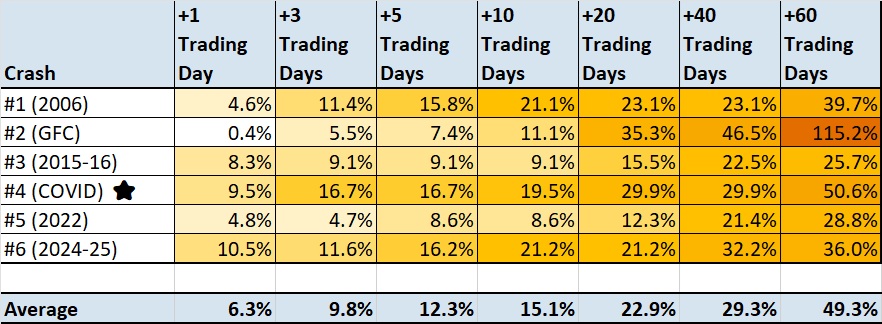
Since the recent market bottom on March 23rd, over the last 13 trading days, the Nifty Small 100 index has bounced by 14.5% from the bottom. Many other indices have shown similar moves.
As seen in the table below, such bounces are common once markets bottom. I am not sure if we have seen the bottom, but if we go by the analysis presented in my recent memo—that most bottoms have historically occurred in February/March—the probability is reasonably high.
Bounces from market bottoms generally climb walls of worry. They occur during periods when conditions on the ground are still difficult, but markets have already started pricing in the future.
Performance of Nifty small 100 index post bottom (in number of trading days)
English
Narayan retweetledi
Overhead supply is a hoax in most situations. I’ve spoken about this multiple times in the past, in fact, I had questioned it as early as 2020.
I can go into detail on it, but for now, I’ll just share this reference from Darvas’s You Can Still Make It in the Market. It captures the idea quite well.
I can share many more valid reasons beyond this, but I’ll leave it here for now.

Mac@yt_mac07
@swing_ka_sultan Also everyone talks about overhead supplies and not to buy stocks having massive overhead supplies. But you tend to buy stocks that are at the bottom and have huge supplies above. Can you please explain why you don't give much importance to overhead supplies
English