Sabitlenmiş Tweet
Here we go again, Gooners ❤️🤍
💸 With a budget of £10 million and all players in top form, build your Arsenal attacking 👇
#AFC #ArsenalFC #COYG
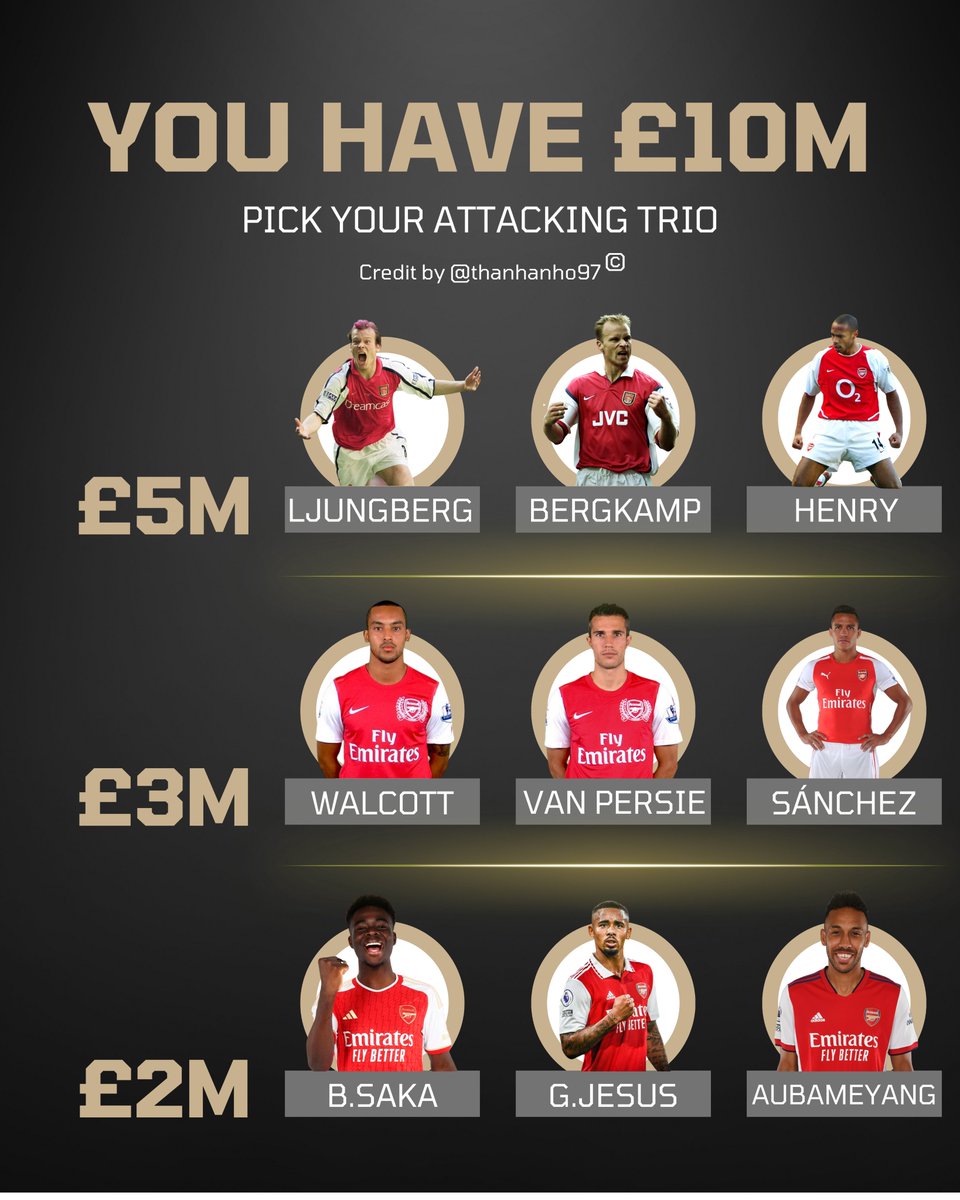
COYG@thanhanho97
💸 With a budget of £10 million and all players in top form, build your Arsenal midfield 👇 #AFC #ArsenalFC #COYG
English