Josh Graham

104 posts

Josh Graham banner
Josh Graham

Josh Graham

@truejoshg

Founder at Alpha Inbound | We Grow CPG Brands With High Converting Creative and Media Buying

Katılım Mayıs 2020
40 Takip Edilen74 Takipçiler
Josh Graham
Josh Graham@truejoshg·
Audited a DTC account at $50K+/month in spend this week. 3 leaks I found in 90 minutes: 1. Their testing campaign was 80% statics. Net new reach needs videos in the mix, so Meta was retargeting their warm audience instead of finding new buyers. 2. Purchase exclusions on the testing campaign were blank. Meta was harvesting existing customers and reporting it as new acquisition. 
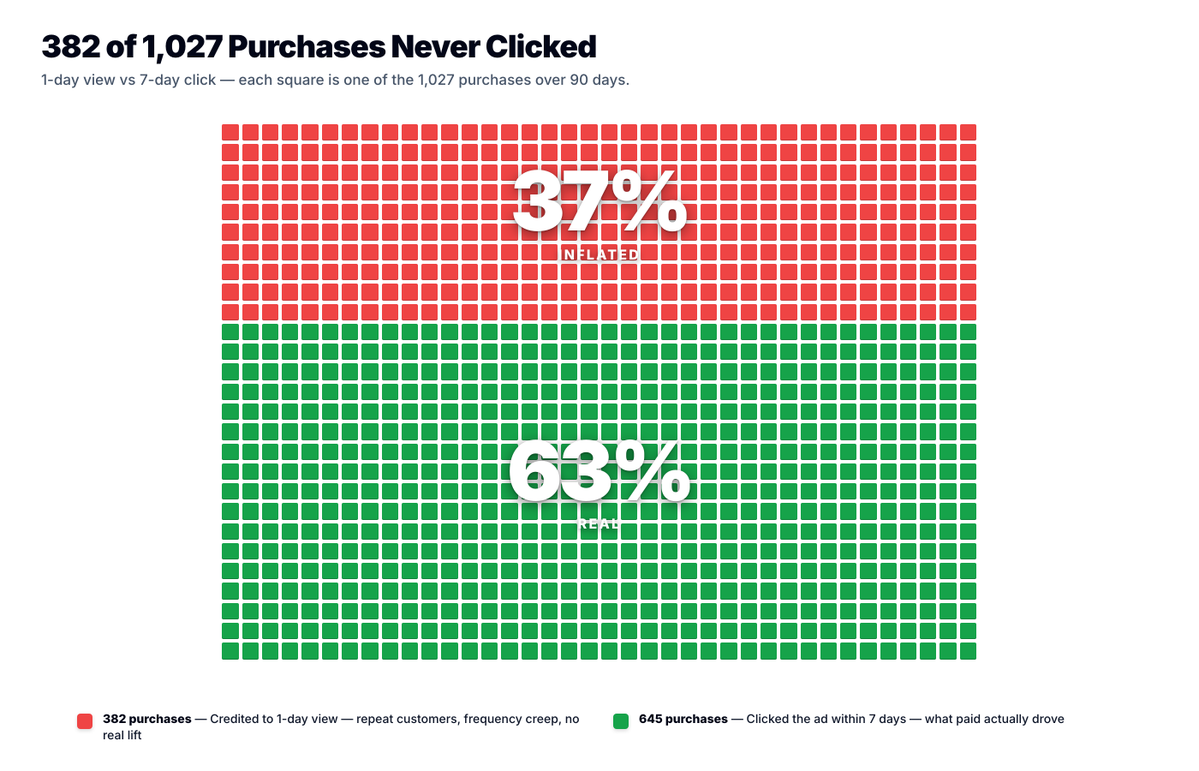
3. Default attribution window with 1-day view-through layered in. Reported ROAS was 1.4x. Actual incrementally below 1.0x. Fix list: • Diversify testing creative — keep statics for testing depth, add videos to drive net new reach • Set purchase exclusions on every testing campaign • Pull attribution to 7-day click + 1-day engage-through, drop view-through from the operating window Save this!
English
3
2
12
897
Josh Graham
Josh Graham@truejoshg·
Before you scale a single ad past $50K/month in spend, here's the baseline checklist worth running through: • Mobile page speed score of 70 or higher. • Add-to-cart rate above 15% on low-AOV traffic. • Purchase rate above 50% from the checkout screen. • Brand search holding at 10-15% of Google spend. • Contribution margin tracked weekly off the P&L. • Attribution pulled to 7-day click + 1-day engage-through, view-through stripped from the operating window. • Initiate-checkout rate above 50%. You don't need every box checked. You need most of them, because the post-click experience and the holistic view of the business are what scale absorbs. If a single ad is working, you scale it regardless. The checklist exists to raise your ceiling. It doesn't gate the next dollar of spend. But if half the boxes are open, the ad that's working is carrying weight the rest of the funnel was supposed to share.
English
3
2
12
721
Josh Graham
Josh Graham@truejoshg·
I just audited a brand where 382 of 1,027 purchases over 90 days came from view-through attribution. 37% of reported conversions credited to people who never clicked the ad. In-platform ROAS looked great. Pull 7-day click out separately, and it's a different story. Then Meta updated click attribution in March, and the conversation got more layered. If you're running paid above $50K/mo, here's what matters now. What changed: • Click-through now means actual link clicks only. Likes, shares, saves, comments, and 5+ second video views no longer count as clicks. • Everything that used to live inside click-through but wasn't a link click moved to a new bucket called engage-through. 1-day window. • View-through (1-day) still sits next to it, doing what it always did. We operate on 7-day click + 1-day engage-through. Here's why each window deserves the weight we give it. 7-day click attribution • Only counts conversions where the user actually clicked through to your site. • The cleanest signal of paid-driven demand. • CPA on this view is the closest thing to "the ad caused the sale." 1-day engage-through attribution • Counts conversions from saves, shares, likes, comments, and 5+ second video views inside a 1-day window. • Some of this is real signal: creative is doing its job and pulling people back to convert. • Some of it is irrelevant... existing customers engaging with content they were going to buy from anyway. • Worth tracking and evaluating honestly. 1-day view-through attribution • Credits a sale if Meta showed the ad in the last 24 hours, with zero interaction required. • Most of these are repeat customers buying organically. • This is where most of the inflated ROAS hides, which is why we strip it from the operating window. A few things tend to happen quietly inside the account when all three are stacked. 1. Meta over-relies on engage-through and view-through because they're easier to find than click-through. 2. Frequency creeps up because the platform keeps showing the ad to the same warm pockets to harvest those conversions. 3. First-time-impression ratio drops because new audiences aren't where the easy non-click conversions live. Reported CPA stays flattering on the dashboard either way. The diagnostic is still simple. In Meta, go to Columns and hit Compare Attribution Settings, then split the same campaigns three ways: 7-day click only, 7-day click + 1-day engage-through (what we run on), and Meta's platform default (which stacks 1-day view-through on top). You'll see three different CPAs. They will not be the same number. For most accounts above $50K/month, here's how I read them: • 7DC alone is your floor. The most honest paid-driven CPA, but it can under-report when creative is genuinely driving social-engagement-led conversions. • 7DC + 1-day engage-through is the operating number we run on. It captures real social signal without view-through inflation, and it's what every campaign decision should be measured against. • Meta's default is your ceiling. It adds 1-day view-through on top of everything else. Useful for understanding what Meta is willing to credit, but not a window we'd ever optimize on. The cleaner read will show a higher CPA than your default dashboard. That's fine. It's the number that actually correlates to new customer acquisition. Revenue numbers inflate easily. Contribution margin will survive a board meeting. Save this and send to your team for later!
Josh Graham tweet media
English
0
0
2
46
Josh Graham
Josh Graham@truejoshg·
What's the perfect amount for retargeting allocation? (hint: it's not dead) After 8 years and $100M+ spent on Meta, here's my answer: 15% to 20% of total spend. Never 10%. Never 50%. Yet... both extremes show up in nearly every audit, and they come from the same misunderstanding of how the warm audience scales. Quick definition first, because brands get this wrong all the time. Retargeting for us means website visitors plus Instagram and Facebook engagers who haven't bought yet. Past purchasers go in a different bucket. Here's what's actually happening inside each allocation. THE 10% ACCOUNT: This is usually a brand obsessed with new customer acquisition. The thinking sounds reasonable on paper, where retargeting just harvests people who would've bought anyway, so why pour budget there. The reality looks different inside the account. A fully optimized prospecting layer creates warm pools every week, and if you don't allocate enough retargeting spend, those pools cool off before they convert. The signal you'll see is dynamic product ads and review-based creative starved of budget while your prospecting CPAs creep up. THE 50% ACCOUNT: This is usually a brand chasing platform ROAS. The thinking is that retargeting has the lowest CPA, so the most spend should sit there. The reality is that retargeting is a finite audience. Push too much spend into it and frequency breaks the experience. People who would've converted at frequency 5 stop converting at frequency 12. The signal you'll see is platform ROAS holding up while MER slides, frequency climbing past 7, and prospecting starved because retargeting keeps overtaking it. -- The middle: 15% to 20% of total Meta spend on retargeting. This is the Pareto principle applied to paid media. • 80% of the budget goes to building new audiences. • The remaining 20% closes the warm pool. Don't jump from 10% to 20% in one move. Move from 10% to 15%, watch performance for a week or two, then move from 15% to 20%. Retargeting frequency between 5 and 7 is fine because the pool is finite. Above 7, the experience degrades and conversion rates drop. A lot of people say retargeting is dead. It still works for us because we don't reuse prospecting creative on a warm audience. Our retargeting libraries are built around three creative buckets: • FAQ-style videos that answer the questions warm shoppers actually have. • Objection-handling content that addresses the specific reasons they didn't buy on the first visit. • Founder videos that bring trust into a purchase decision warm shoppers are already weighing. The job of retargeting creative is to convert. Re-pitching the prospecting angle just burns frequency on a finite pool. Refresh assets quarterly because the warm pool is small enough that creative fatigues fast. Run 15% to 20% with rotating creative if scale is the goal.
Josh Graham tweet media
English
4
1
14
857
Josh Graham
Josh Graham@truejoshg·
We're scaling a $450K/month Meta account profitably. ​ Their ROAS is 1.2. ​ That looks broken until you see how we got there. ​ Most people set a profit target (let's say 1.5x) and optimize every ad against it. ​ If you optimize EVERY ad off 1.5x, you cut your top of funnel, you cut your middle, and you only scale the ads with the highest ROAS. ​ Those are bottom of funnel ads. ​ Meta then cycles through the same people who already know your brand until your CPA doubles. ​ Instead, you weight ROAS by funnel tier: ​ • Top of funnel (80%+ new visit %): a 1.0 ROAS is fine • Middle of funnel (40-60% new visit %): 1.3 ROAS minimum • Bottom of funnel (under 40% new visit %): 1.8+ ROAS to pull the average up ​ The weighted average is what hits 1.5. ​ Optimizing only off the average kills the funnel that feeds it. ​ Try this.
English
4
1
14
458
Josh Graham
Josh Graham@truejoshg·
This is the easiest & most profitable founder-led content strategy any eCom brand could start TOMORROW: ​ ​STEP 1: Export every product review and customer complaint from your store. Most Shopify apps do this in two clicks. ​ STEP 2: Drop the export into ChatGPT or Claude. Ask for the most-asked questions and the most-recurring objections. The model clusters them by frequency. ​ STEP 3: Open your phone. Have the founder answer each one in 30-60 seconds. Front camera only. ​ STEP 4: Cut the answers into TikTok-comment style overlays for paid. Same files into Reels for organic. ​ The reason this works: The founder is answering questions actual customers asked, on camera, in 60 seconds. Authority and utility at the same time. ​ Layer in any comment-monitoring tool and you'll never run out of new objections to film. ​ Bookmark this.
English
5
2
17
1K
Josh Graham
Josh Graham@truejoshg·
I can predict when a Meta ad account is about to plateau. ​ It almost always starts with this ONE rule: ​ "If it hits our ROAS target, scale it. If not, cut it." ​ That sounds disciplined. ​ But what it actually does is slow growth. ​ - Top-of-funnel gets cut because it misses the same ROAS threshold you use everywhere else. - Fewer new people enter your funnel. - Audience replenishment slows. - Meta starts cycling delivery through the same pool of users who’ve already seen your ads. ​ Then: ​ - Frequency climbs. - Performance looks stable for a while… until it doesn’t. ​ The problem is NOT your ROAS target. ​ It’s using one efficiency benchmark for every stage of the funnel. ​ An ad driving 80–100% new visitors to your site is doing a completely different job than one where 60%+ of clicks are returning visitors. ​ - One is creating demand. - One is harvesting it. ​ They should not be measured the same way. ​ When they are, growth stalls. ​ This is the system we’ve used across accounts spending $50K–$500K+ per month on Meta to scale without starving the funnel or compressing margin. ​ I packaged our 4-Stage ROAS System into one free guide. ​ Inside: 1. A 90-second break-even ROAS calculator using your real P&L numbers 2. Funnel-stage thresholds built on new visit percentage 3. The "first time impression ratio" hack (reach divided by impressions) to track this for free in Meta 4. A creative diversity system to break Meta's habit of retargeting the same people 5. A weighted-average model that ties every stage back to profitable growth 6. Fill-in worksheets, worked examples, and a weekly scaling checklist ​ This is the exact process behind accounts we manage at meaningful scale. ​ If you want me to send it to you: ​ Comment “ROAS” ​ Send a connection request if we’re not connected yet. ​ And I’ll DM it over. ​ PS ​ Section 3 covers why statics are naturally bottom of funnel regardless of your angle. ​ Meta just locks onto the same audience. ​ If your creative mix is mostly statics, that's likely why your top-of-funnel spend keeps underperforming. Activate to view larger image,
Josh Graham tweet media
English
13
2
20
1K
Josh Graham
Josh Graham@truejoshg·
@balanced_alex @dailycopywriter Anyone who manages ad budgets should treat it like it's their own money...that's my frame of mind. The finance guy in me treats any dollar spent like an investment that I need to get an ROI from.
English
1
0
1
29
Alex
Alex@balanced_alex·
@truejoshg @dailycopywriter Guess what's harder to do? Much easier to just raise the budget and inflate metrics to show on paper, that brands are growing, while funders just keep getting deeper into debt…until they filed for bankruptcy. And the agency simply moves on.
English
1
0
1
20
Josh Graham
Josh Graham@truejoshg·
Why do agencies still pitch brands on top-line growth? "we 3x'd their revenue." NONE of that means the brand made money. The longest-standing clients we work with send me their P&L every month. Inside the ad account, performance can look COMPLETELY fine while the P&L tells you the brand is losing money on every order. Revenue is the easy part.
English
6
1
15
934
Rashi Umapathi
Rashi Umapathi@rashiumapathi·
@truejoshg Finance + marketing = dangerous combo. No wonder you survived longer than the hype chasers.
English
1
0
0
15
Josh Graham
Josh Graham@truejoshg·
"you studied finance... why are you in marketing?" This is the single biggest advantage I've brought into every ad account under my watch. And it's how I've been able to profitably manage over $100,000,000 in spend across Meta & TikTok. Understanding finance is FUNDAMENTAL once you're inside an ad account. Why? Because every dollar deployed has to earn its return, the same way every position in a portfolio has to. Some of our longest-standing clients send me their P&L every month. > KPIs get built backwards from the gross profit line. > Every campaign gets stress-tested against the actual cash that hits the bank. If you can't tie a dollar of ad spend to a P&L line, the dashboard you're optimizing won't survive a 6-month review. Run the math.
English
5
1
18
1.7K