
Veda Khadka retweetledi

I recently stumbled over the tmap R package and was amazed by its capabilities! With tmap, you can craft dynamic, interactive maps with ease. The package offers a flexible syntax similar to ggplot2, but with a dedicated focus on maps.
Key Features:
🌟 Interactive Maps: Switch between plot and view modes for static or interactive experiences.
🛤 Multiple Shapes & Layers: Combine various spatial objects and layers for intricate map designs.
🌈 Facets: Segment your data visually with facets, enhancing comparison and analysis.
🏞 Basemaps & Overlay Tile Maps: Integrate beautiful basemaps and overlay tiles to enrich your maps.
🎨 Customizable Options & Styles: Tailor your maps with numerous styling and layout options.
🔄 Shiny Integration: Seamlessly embed maps in Shiny applications for interactive web apps.
📊 Quick Thematic Maps: Generate thematic maps swiftly with a single function call.
📝 Exporting Maps: Easily save your creations as images or interactive HTML files.
For those interested in delving deeper, there's a comprehensive guide to get started, available at CRAN: cran.r-project.org/web/packages/t…
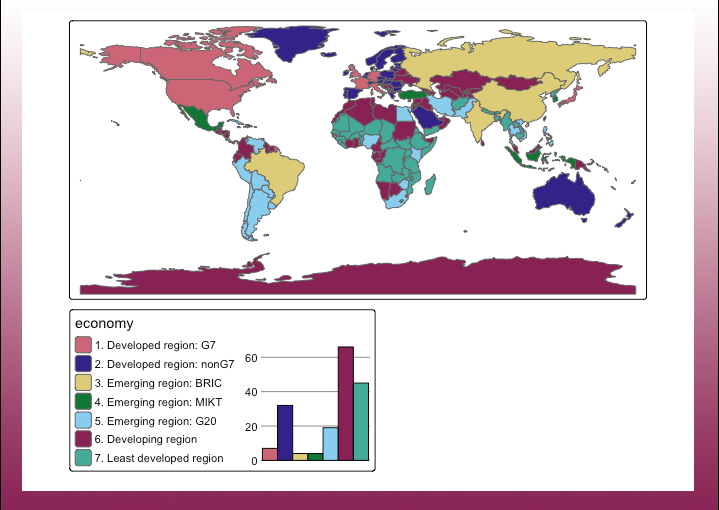
I've also learned from a recent post by Jakub Nowosad, one of the contributors to this package, that the development version of tmap now supports adding various charts to the maps (see image of this post).
Thanks to Martijn Tennekes and the other contributors for their great work on this package!
Want to stay ahead in statistics, data science, and programming? My free newsletter delivers regular insights directly to you. More information: eepurl.com/gH6myT
#statisticsclass #R #datavis #Statistical #DataVisualization #RStats #Data
English