@FrankAFetter You trolling or was that the case w other MS etfs? Tx.
English
whythatnickname
2.7K posts


Six hours and 45 minutes until futures open. Kiss your children goodbye. Savour a final meal.
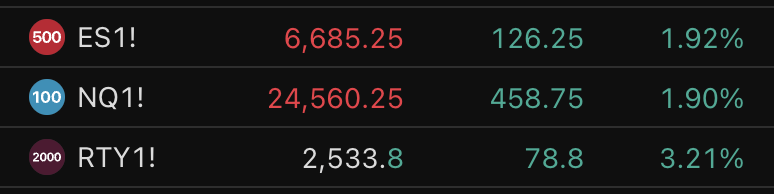
GOLD FALLS TO UNDER $4500, SET FOR ITS BIGGEST WEEKLY FALL SINCE 1983.


This chart has been circulating everywhere. Problem: it’s outdated. I rebuilt it with the latest data. Result: The current surge in real oil prices is already the 4th highest ON RECORD. 🤯 Historically, that’s been a strong recession signal.


Just finished coaching the 3rd group of Bitcoin leaders and builders in 3 days. People are building companies and having meetings that are already influencing the energy of nation states, onboarding charities, small businesses, corporates, Doctors, Lawyers, Family Offices, everyday moms and dads, and making products that make it easier to use Bitcoin. The movement is unstoppable, the future is bright! Incredibly grateful that I get to work with such an inspiring group of people.