ทวีตที่ปักหมุด
LARZ
2.8K posts

LARZ
@BizCycles
“The very best thing you can do for the whole world is to make the most of yourself.” Student of the game
Pressure is a Privilege เข้าร่วม Mart 2014
788 กำลังติดตาม337 ผู้ติดตาม
I know $XNDU is super thin for a lot of the big account on here, but the setup into today was A+. You had a higher low with a 10DSMA reclaim yesterday. Today you had an OEL + in the wick setup (CC: @TCMLLC ) and if you look at a 5m chart, you had 4 straight, super tight, hammer candles just under VWAP before the intraday breakout.
English

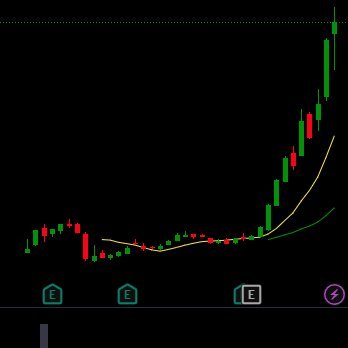
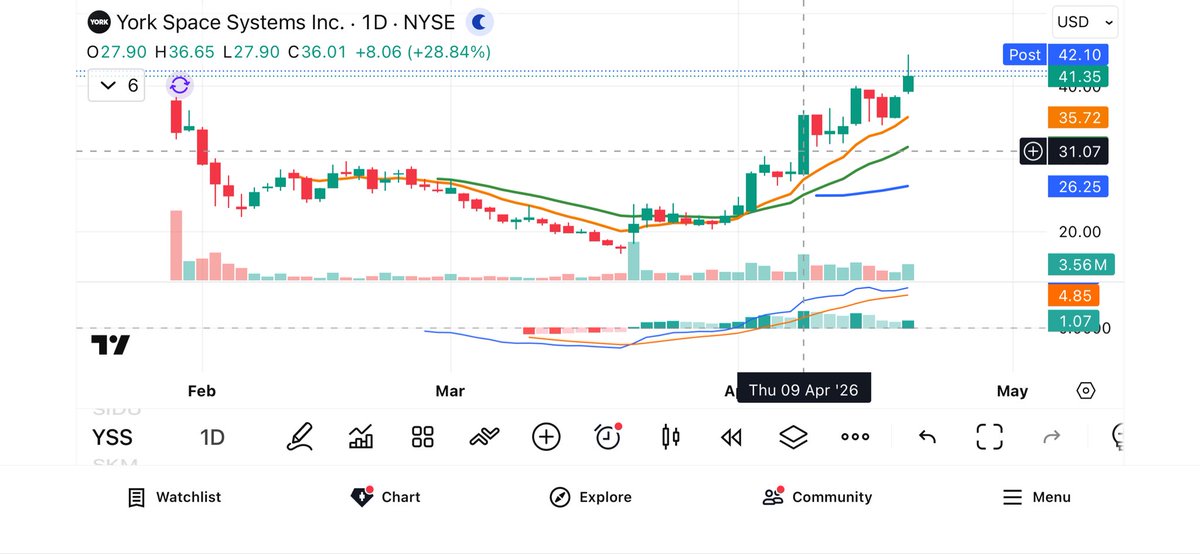
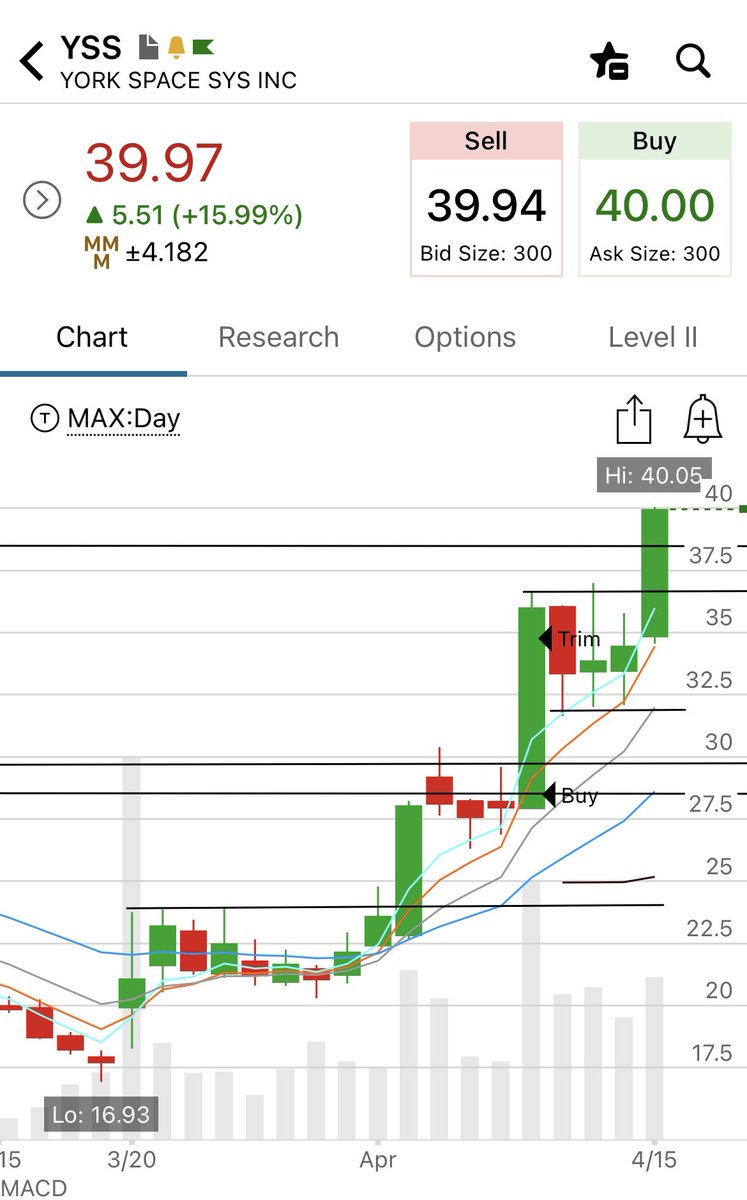
I bought $YSS $31.04 on 4/9 -> look how many different opportunities it presented me to panic since
Sometimes you literally have to do NOTHING
Shake Pryzby@ShakePryzby1
The best adjustment you could ever make for your trading is to X out that PnL intraday and stare at your stocks daily charts instead. We had a big discussion today how daily PnL is the trap that only heightens emotions every tick, naturally leading to emotional decision making and therefore trading mistakes. The entire goal of trading is to avoid this behavior at all costs. If a stock goes 30R and you sold it for 10R you have made a grave, year-altering mistake. To get to the 30R trades you will likely have to go up 8R down to 3R before the stock consolidates and sets up for the next leg. Need to see the forest from the trees. The best trading quote that's helped me so much in terms of sticking with trades: "If you buy a train ticket from NY to California, are ya gonna get off in Chicago?!"
English
Is the crash over
x.com/PurpleDrink_LL…
PurpleDrinkCapital@PurpleDrink_LLC
How’s everyone handling this market crash today
English
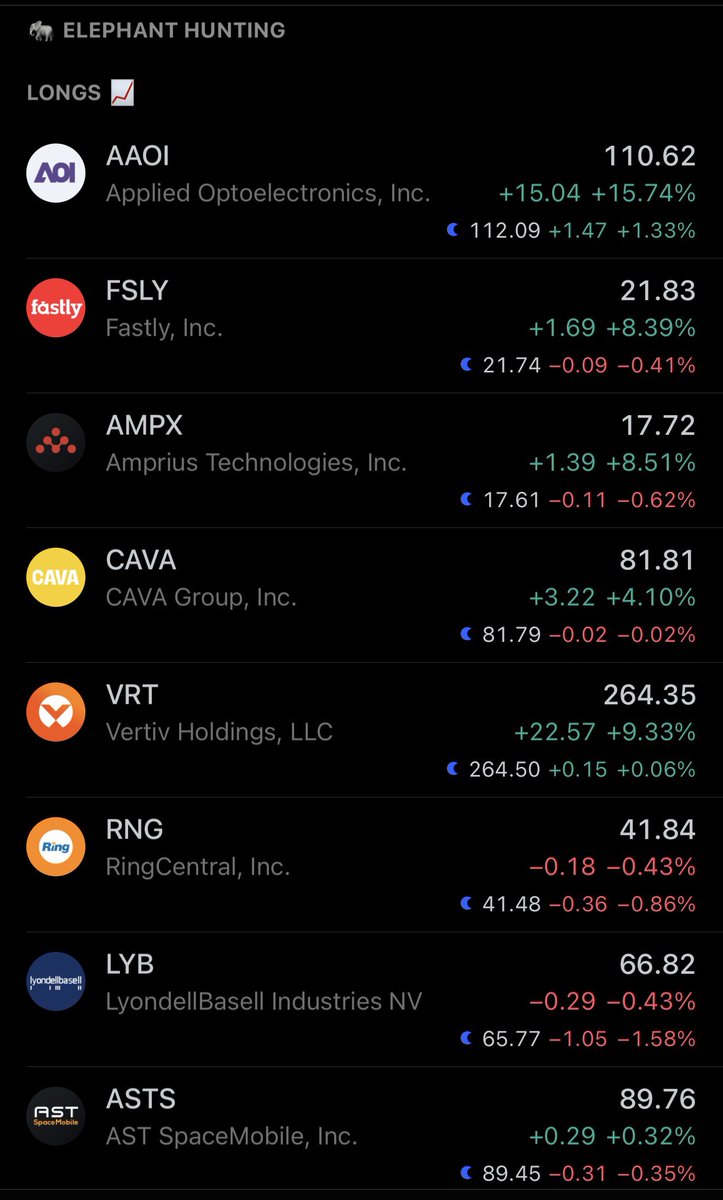
@PurpleDrink_LLC Many of the leaders are green or barely red. $MU, $MRVL, $NBIS, $DELL, $IRDM, memory names, etc. Love to see it.
English
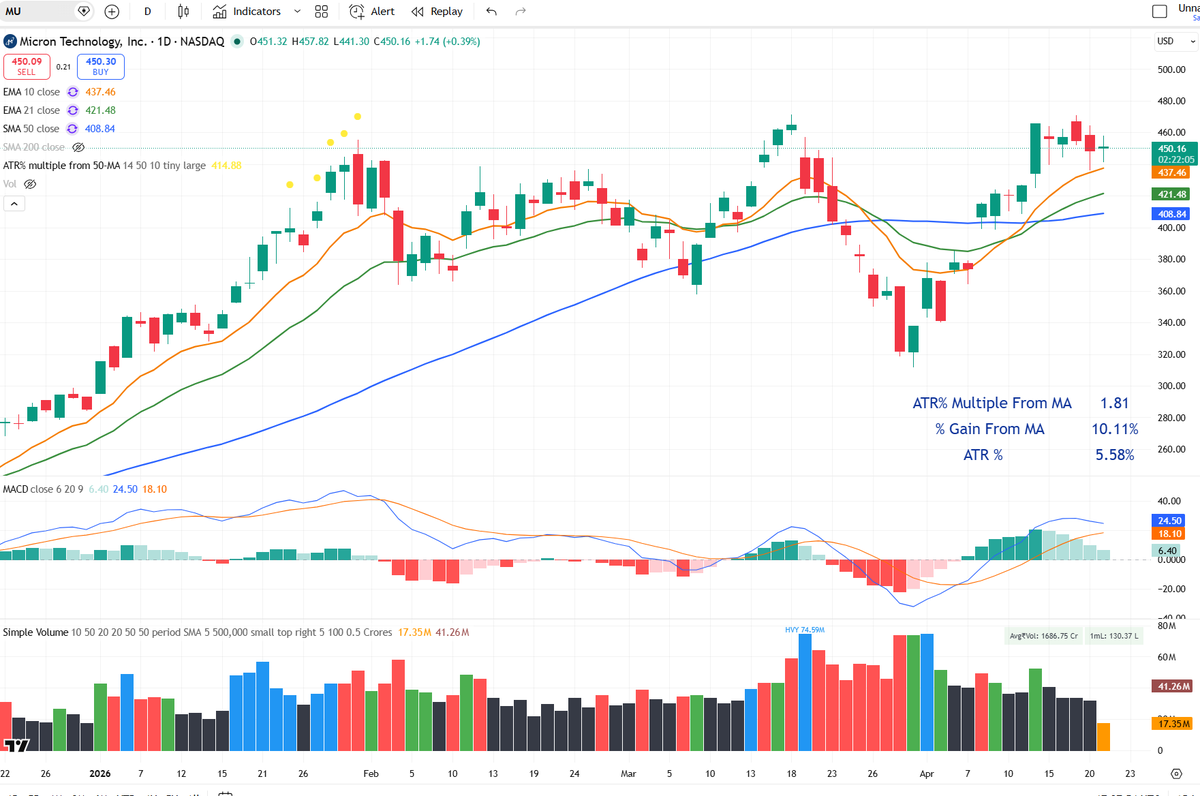
Inside daily candle w/lowest volume in the range building here on $MU
English

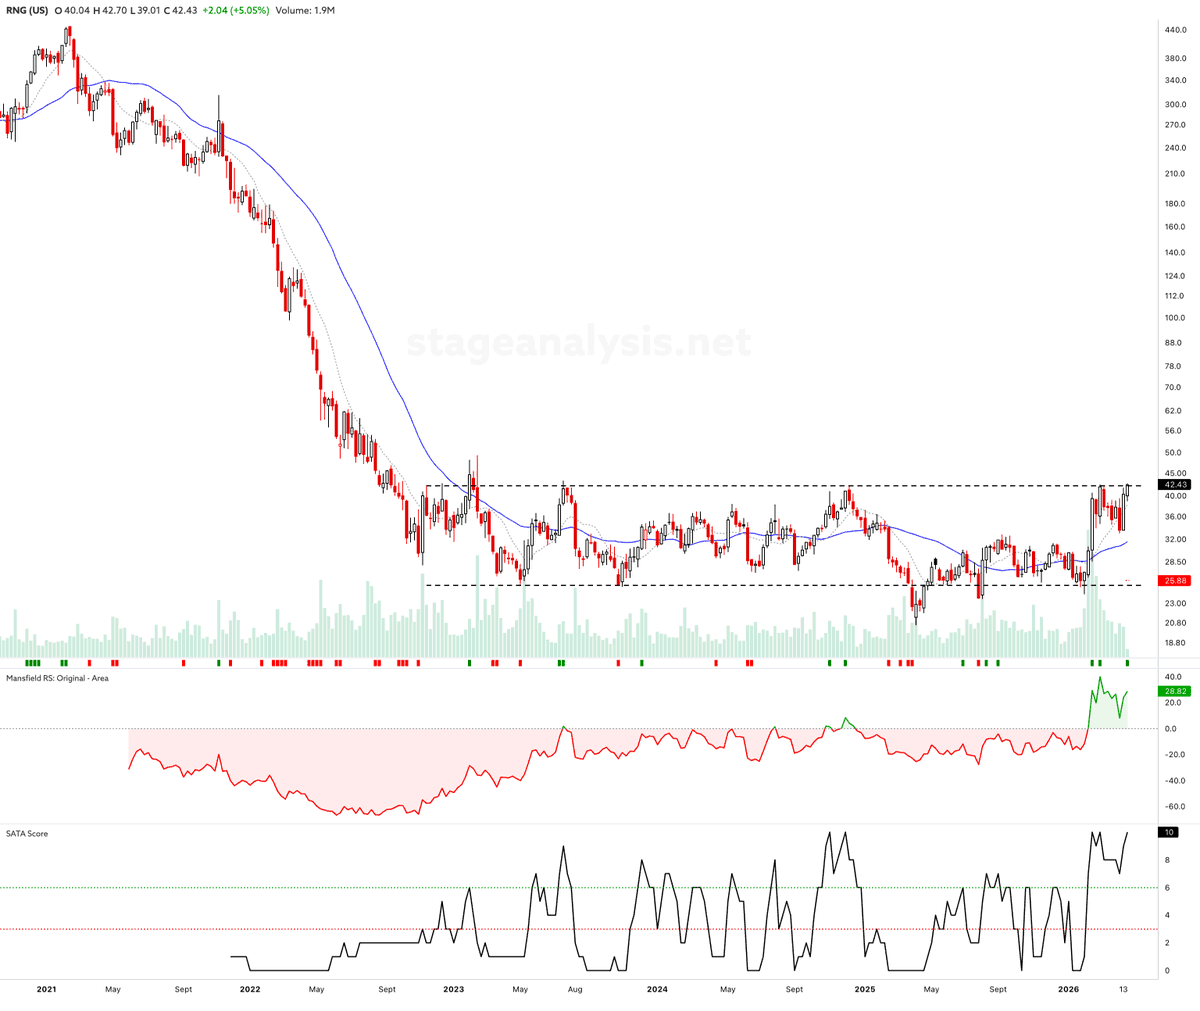
$RNG broke out into early Stage 2 in February on heavy relative volume. But is now attempting to breakout of the much larger 3+ year broader base structure which could see a more significant Stage 2 advance get underway.
English

LARZ รีทวีตแล้ว

I see people trade a lot of random stocks. Stick to the momentum leaders and your results will improve. Scan for the top 1% or 2% strongest stocks on any timeframe (1, 3, 6, 12 months etc) and look for the ones that obey the rising 10-, 20-, and 50-day moving averages.
English
@WallStreetMav How about they pass an audit before they're handed more money?
English

Increasing the US Military budget from $850 billion in 2025 to a new level of $1.5 trillion per year would increase the US budget deficit from $2 trillion to about $2.6 trillion per year.
Over 10 years it would add about $7 trillion more to the national debt than current estimates.
We would probably grow the debt from $39 trillion (today) to about $70 trillion in the year 2036.
Interest payments on the national debt already consume 25% of all US govt revenue. Growing the debt that fast would likely force the govt to spend about 35% to 40% of all revenue on interest payments by 2036.
Buy more gold and silver … this spending and debt train is accelerating.

English
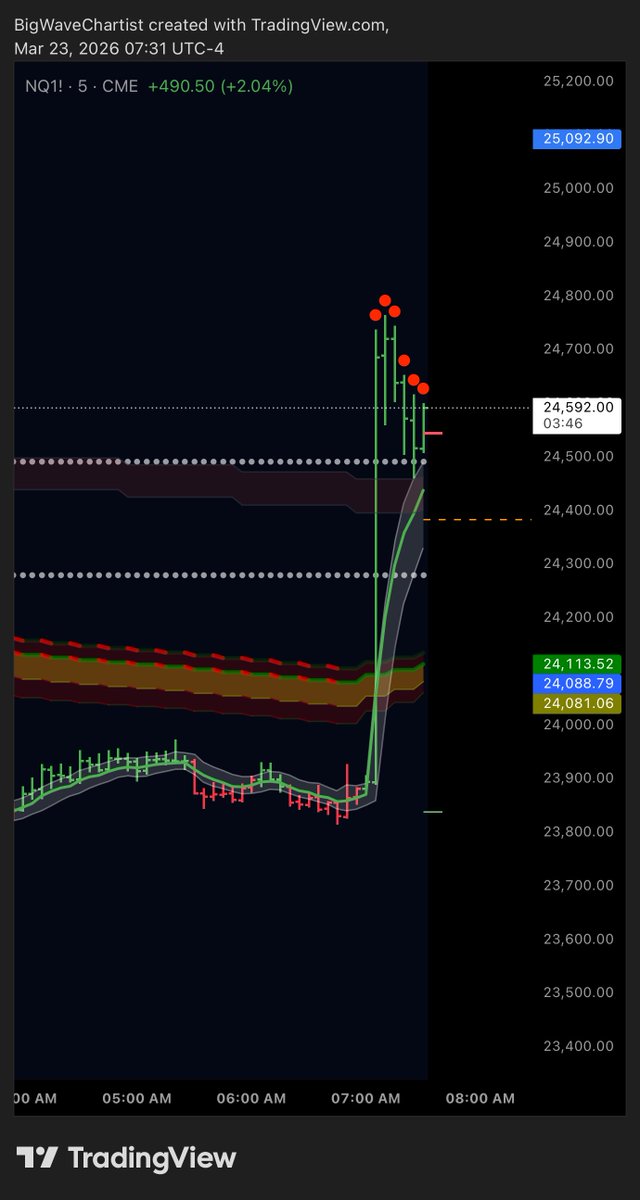
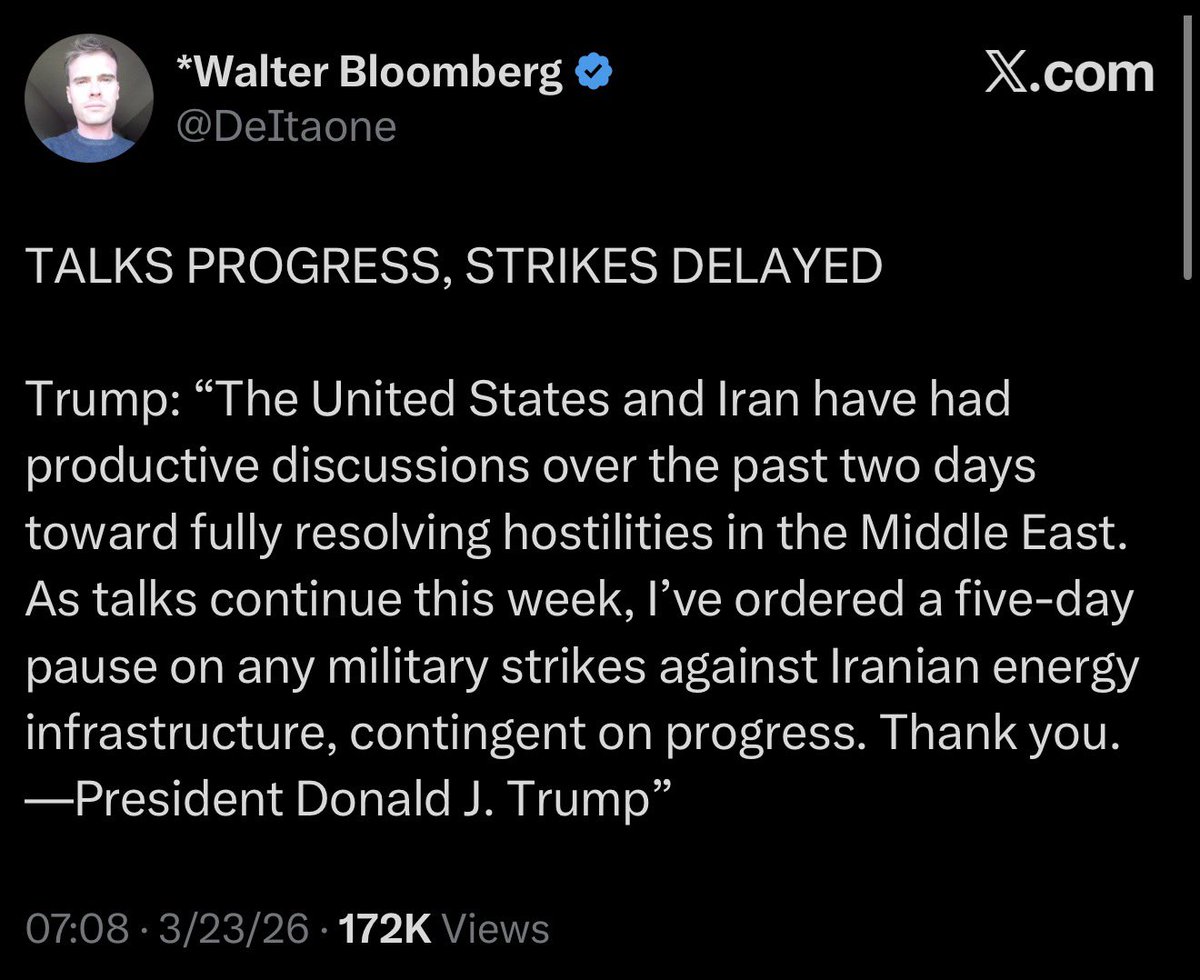
@BigWaveChartist Ofc many will have been long Friday in anticipation of this move no doubt.
English

I feel there may be a lot of chasing this move today… lol
English

Will @RichardMoglen be next to escape the millionaire tax?
Wall Street Mav@WallStreetMav
California, Illinois, NYC, Seattle ... all losing their top taxpaying citizens to zero income tax states like Tennessee, Texas and Florida. Countries like the Netherlands recently tried an unrealized capital gains tax. The wealthy are leaving for lower tax European countries. Bigger and bigger names are moving. Huge companies are moving. And yet the far left states and countries keep doing more of the same. Companies are moving their HQs to Texas, Florida and Tennessee in record numbers. Why does it keep happening? The politicians in those far left states don't seem to care that their policies are actually negative by tax revenue leaving. To the financially illiterate on the left, it is all about equity and fairness. They don't care, they just want billionaires to pay more. If they leave, it doesn't matter.
English
@BigWaveChartist Do you use a min $ Vol in your scans? If so, what's the cut off?
English
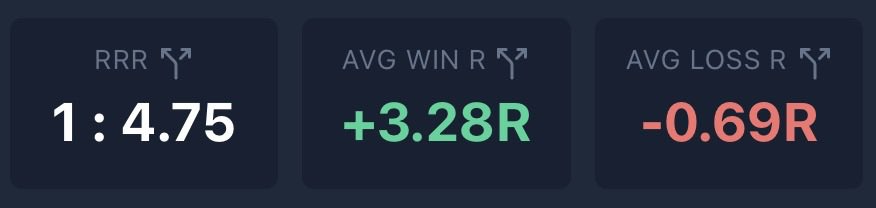
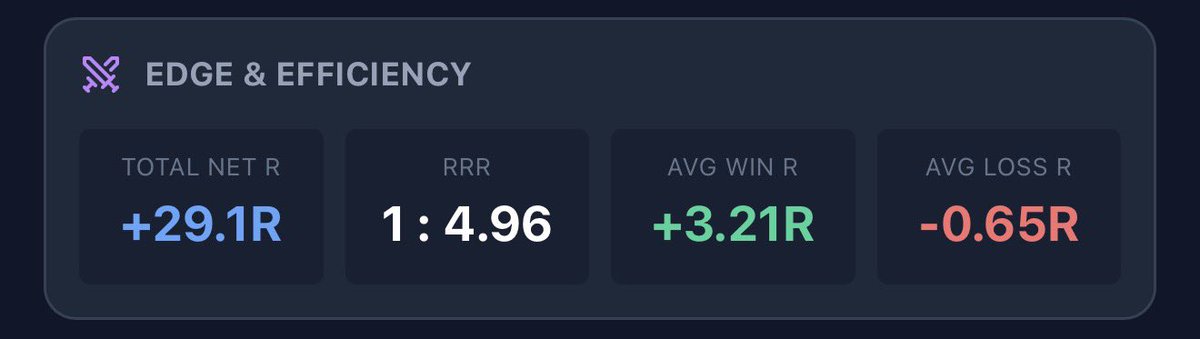
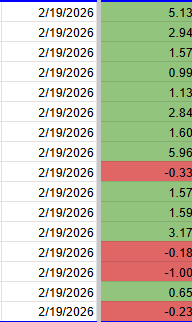
Here’s my stats YTD. My average win rate over years is in the mid to high 30’s.
In the world of trading, the debate between win rate and risk-to-reward (R:R) ratio is a classic one, but the reality is that neither metric matters in isolation. As a trader, you should be most concerned with how these two variables interact to create a positive expectancy.
Expectancy is the average amount you can expect to win or lose per dollar at risk. You can have a very low win rate and still be highly profitable if your R:R is high, or you can have a very high win rate and still lose money if your "big miss" wipes out dozens of small gains.
There is an inverse relationship between win rate and risk to reward ratio (RRR or R:R). Generally, the higher your profit target is relative to your stop loss (high R:R), the harder it is to hit that target, which naturally lowers your win rate. Conversely, if you take profits very quickly (low R:R), your win rate will likely be higher, but one large loss can be devastating.
To be a "breakeven" trader, you must meet the minimum thresholds in the chart below.
Do you know your stats? Any trader wanting to be profitable absolutely needs to know these data points!

English
LARZ รีทวีตแล้ว

@BigWaveChartist Thank you for the concise explanation, it makes a ton of sense. Loss control is one of those things that I am still refining in my system, so I appreciate you giving your perspective on it.
English
Thanks! No worries. I’ll try to put together something more official. But I buy stocks that are in an uptrending 8ema structure. So I’ll generally place the SL at low of structure and each day iam holding the stock I move the SL up with the rising structure low. So eventually I can move the SL up to cost basis or above even without selling any of my original position. It brings overall avg R-loss down. I also limit my entries to when market windows are higher probability (hence my Trend MAP system)
English
Hi Dario, thanks for sharing. To confirm, these are all stocks that met your "setup" criteria and then triggered the next day (or during the week)? Also, do you view this info as an indicator on the over health of the market for breaksouts/follow through? With my breadth quality indicator, I too have noticed improvement this week.
English
A great reminder. "There's a time to trade and a time to watch" and right now it's most definitely a time to watch. But don't just watch passively -- continue to execute your daily routine and note which stocks are showing RS, which sectors and groups are "hot", and what the general indexes are doing.
peoplewish@Peoplewish
Reminder to all the swing traders out there: it should be pretty clear this isn’t the kind of market environment that leads to big gains for the portfolio, and that’s fine. In a good year, we might get three solid legs where we make the majority of our gains. Outside of those windows, we do virtually nothing, and that’s what makes swing trading so attractive.
English
@TheOneLanceB @Qullamaggie @Peoplewish @Banana3Stocks @RealSimpleAriel @1ChartMaster AFAIK the bias is bullish because:
-Mentors teach/talk more about the long side
-Markets tend to be bullish historically/long run
-Most practice "situational awareness" where they wont go long if general market is trading below KMAs
English

Curious anyone’s thoughts…
It seems that most of the swing traders on here (@Qullamaggie @Peoplewish @Banana3Stocks @RealSimpleAriel @1ChartMaster) tend to focus on swing momentum longs.
-Is that solely due to the fact that markets tend to go up over time?
-Is that bc you get far more asymmetry with longs?
-Do most of these traders also apply swing shorts using the inverse of their methodology?
-Would they do so if in a prolonged bear market?
-Or is a long bias that powerful for their data?
Most stocks tend to be stairs up and elevator down so seems like shorts could be higher ROI per day?
English