Inbetween Days รีทวีตแล้ว
Inbetween Days
1.3K posts


Inbetween Days
@Cryptosdontcry
Y9B5X8 Dreamcash referral code
เข้าร่วม Ekim 2014
134 กำลังติดตาม48 ผู้ติดตาม

@Sykodelic_ Read somewhere that Gold also selling off as GCC countries and China etc tap their gold reserves to meet fiscal obligations as they can’t get their hands on oil and/or as oil exports are collapsing due to the geopolitical situation. Could be
English

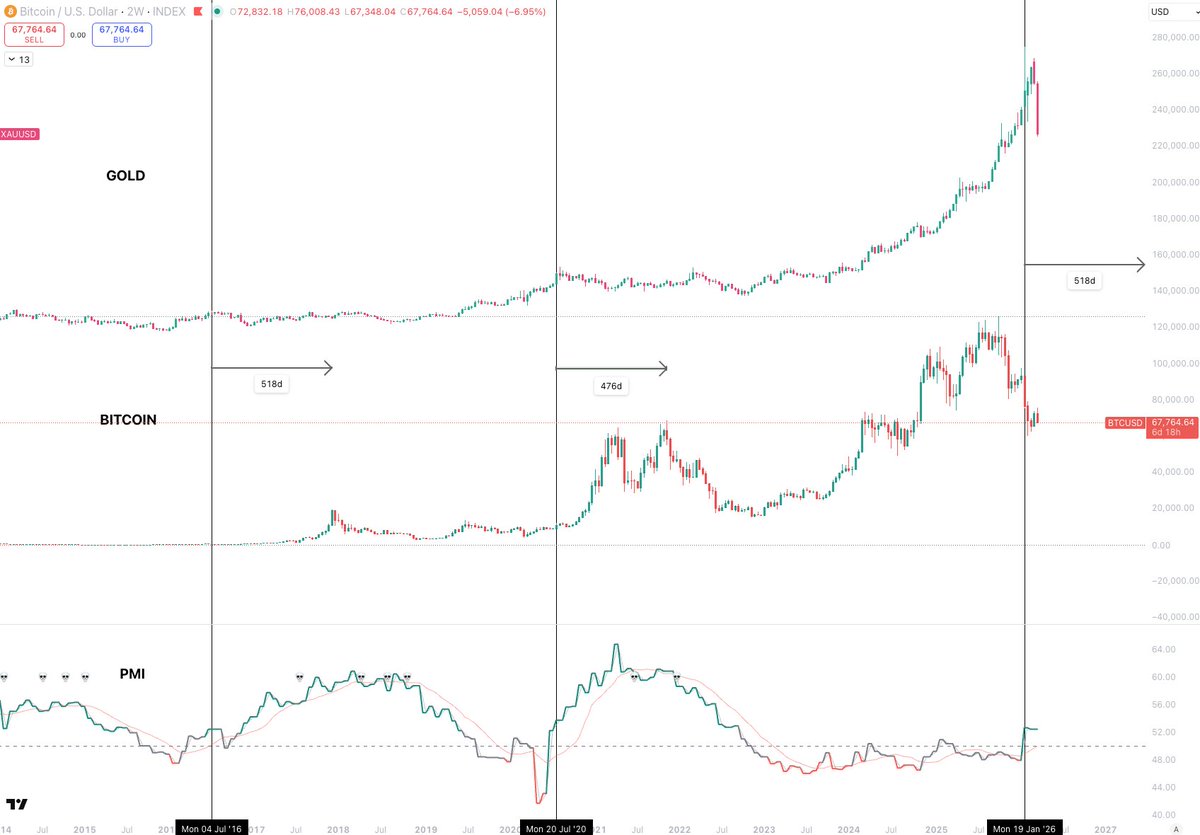
Gold has topped.
The craziest thing is that I was speaking about this 6 weeks ago, and no one wanted to hear it.
Even when the historical macro patterns are this clear.
When Gold was over $5,000 everyone was laughing at anyone suggesting it was time for the rotation of risk and for Bitcoin to bottom out.
But that is exactly what is playing out.
And it is not a coincidence that Gold tops at the almost exact week that the business cycle starts to expand again.
Yet, there are still so many people out there who think a magical 4 year timeframe governs financial cycles.
Gold is risk off and runs in uncertain times, such as economic contraction(PMI below 50).
Bitcoin is risk on and runs in times of certainty, such as economic expansion(PMI over 50).
And historically, when this shift happens, Bitcoin goes on to outperform for around 500 days.
There are also a lot of people out there confused why Gold is dumping when the US/IRAN conflict is happening.
No asset is outside the buy the rumour sell the news paradigm.
Gold runs within uncertainty with the anticipation of issues - in the lead up to.
And as things shift to expansion and certainty, it tops.
Whether you realise yet or not we are in that shift.
And it does not matter the narrative of the moment, war, covid, whatever...
This chart does not care about that.
It simply shows you the shifting of certainty and uncertainty, and how assets react.
And Bitcoin is next.
Sykodelic 🔪@Sykodelic_
You do not need to overcomplicate it. I don't understand why everyone finds its so hard to see these things. Well, I do, because emotions rule 99% of people. But anyone can line up these three fundamental macro charts and analyse where we are. It literally takes two minutes. In every single cycle we have had: 1. GOLD tops as ISM moves into expansion 2. Bitcoin tops between 476d and 517d after It is very clear to see that. And it is not a coincidence this happens, it happens for fundamental macro reasons. GOLD is a strong risk off asset that performs well in economic and geopolitical uncertainty. When ISM breaks into expansion, that uncertainty is removed and GOLD finds its top, as ISM continues to expand. An expanding economy improves liquidity conditions and that is why Bitcoin then has its turn. Again, this is not a random chart that has no intrinsic link. These three charts represent different stages of a macro cycle and when you put them together, it becomes clear. Take a look at this again now... Do either GOLD or ISM look like they are anywhere near a position that signals Bitcoin having 9 months of a bear market left? Not at all.
English
@cryptofergani Your screen shot is to my mind misleading. Still a way to go before tapping the bottom of the purple line as is did in 2022
English

So many are saying the bear market has officially begun.
No. The bear market is almost over.
And I really think crypto is going to shock everyone this cycle.
I bet my entire life, 10yrs worth of research & entire net worth on this moment.
I’m warning you that life changing wealth is about to come.
The masses do not see this.
When I look at the business cycle… What the US dollar is doing…what Trump is doing…the stimulus that’s coming after years of prolonged draining…What metals are doing. The new FED chair…
Institutional interest in crypto. Retail distributing to big money. The Clarity Act, etc..
Understand that, and you beat 95% of investors.
You all deserve what’s about to happen.
If you still haven’t followed me, you’ll regret it.
English
Inbetween Days รีทวีตแล้ว

hyperliquid HIP-4 prediction markets on testnet with mainnet imminent. the real alpha: unified margin with perpetuals. your $10m perp position becomes collateral for prediction market bets. polymarket requires fresh capital. HIP-4 lets you bet on iran outcomes using your BTC long as margin. everyone watching oil markets. nobody watching testnet.
English
@Vivek4real_ Err, Raoul Pal says a lot of things. Banana man said 5 years ago the space would be 100T in 10 years (so in 5 years time). He’s the guy made me go down the rabbit hole and I love him for that…but not much of it panned out. Just sayin
English

@MerlijnTrader A 70% jump from here is not “Altseason”. Altseason is when OTHERS hit 3T MC.
English

THE ALTCOIN MARKET CAP JUST PRINTED A BULLISH MACD CROSSOVER.
Last time this happened: April 2025.
Altcoins rallied 70% from that exact signal.
Same descending wedge. Same crossover. Same support level.
Hold $170B: altseason begins.
Lose it: wedge breaks lower first.
The signal fired once before. It just fired again.
English
English

point farming prices. 15 perps and terminals
@edgeX_exchange - $4
used to look insane when points were valued at $20–25. now it’s xp instead. total xp supply ~13,000,000 with 5% token allocation.
assuming ~$800m fdv → 5% = $40m pool → ~$3 per xp at tge.
@variational_io - $2
OTC $5 + they might compensate losses depending on how the final structure lands.
@GeniusTerminal - $0.05
estimated 0.1$/GP on TGE in month. technically not a perp. more like a terminal similar to gmgn or axiom + aggregating aster and hyperliquid
@hibachi_xyz - $0.1
doubled weekly point emissions during “march madness” so ~3 weeks window where farming is much cheaper than previous months
@01Exchange - $0.01–$0.7
largest variance. project launched recently so people still don’t understand optimal farming routes. btw dont forget 3-in-1 farming - 01, n1 and terminal
@etherealdex - $0.001
fdv collapsed toward ~$50m but upside still includes ENA rewards.
@hyenatrade - $0.0014
same logic + potential rewards from Based + ENA
@extendedapp - $0.2
otc bids around ~$0.8.
@grvt_io - ~$10
tge pushed to june. in compensation they added another 6% token allocation for users
@OstiumLabs - $0.5
basically no upside at current expectations.
@pacifica_fi - $0.05
actually more downside risk than upside.
@StandX_Official - $0.1
hard to judge. no clarity on total token supply yet.
@BullpenFi - $0.05
main risk is smol valutation for now
@nadoHQ - $0.7
consistently decent.
@o1_exchange - $0.012
not exactly a perp. more like a terminal with hyperliquid integrated but points only from spot trading.
rough math: weekly volume ~ $5m. fee 0.75% (⅓ cashback). divided across ~2m weekly points. campaign runs 10 weeks (3 left)
tldr.
valuations compressed hard but some farms still look attractive depending on bonuses and fee rebates.
drop your own numbers if you calculated different costs
English
@kaseemsei What are the 2million users actually DOING on $Sei?
English

Brooo 2 MILLION daily active wallets???
First time ever and we're just getting warmed up.
$Sei is literally becoming THE chain people actually use every day.
Y'all said adoption takes time? Nah, adoption is happening RIGHT NOW.
Who's still sleeping on this?
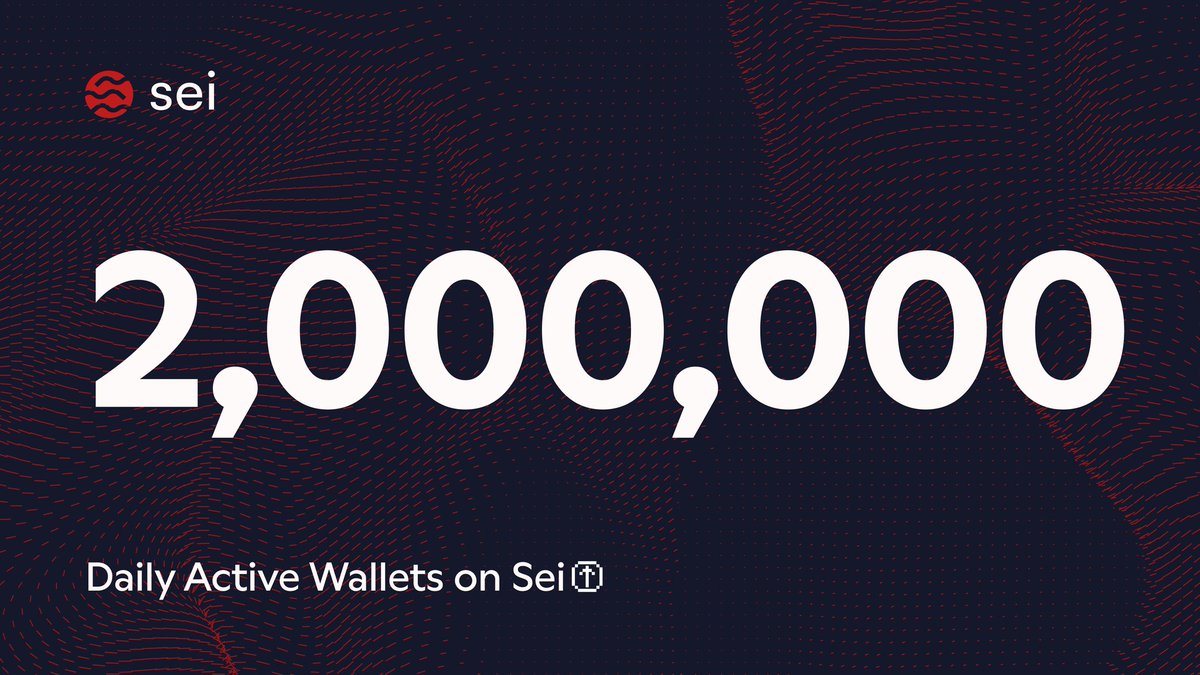
Sei@SeiNetwork
Sei just crossed two million daily active wallets for the first time. From gaming to payments to DeFi to agents, onchain activity moves faster on Sei.
English

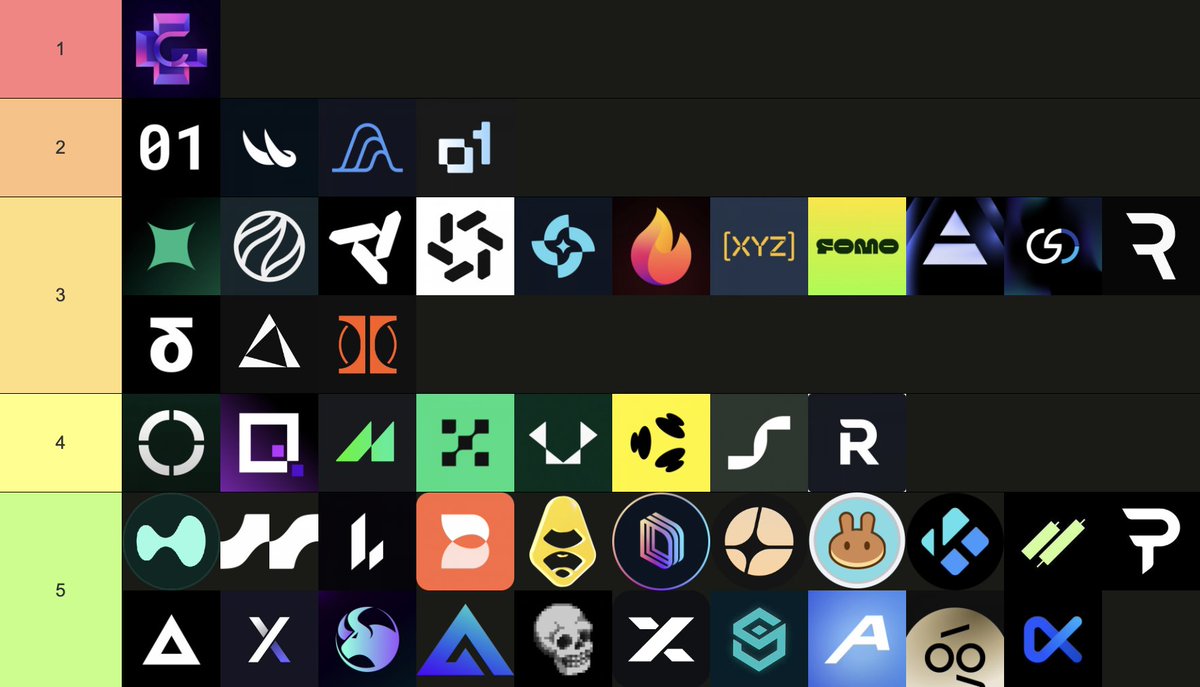
If a perp can’t generate fees, how strong is the business really?
Cumulative fees are one of the cleanest metrics in perp rankings because they show actual monetization over time, not just temporary volume spikes.
Here’s the current picture:
@edgeX_exchange - $283M
@extendedapp - $20.8M
@OstiumLabs - $19M
@paradex - $17.5M
@BasedOneX - $15.1M
@tradexyz - $13.8M
@nadoHQ - $10.5M
@reya_xyz - $3M
@tread_fi - $2.8M
@etherealdex - $2.2M
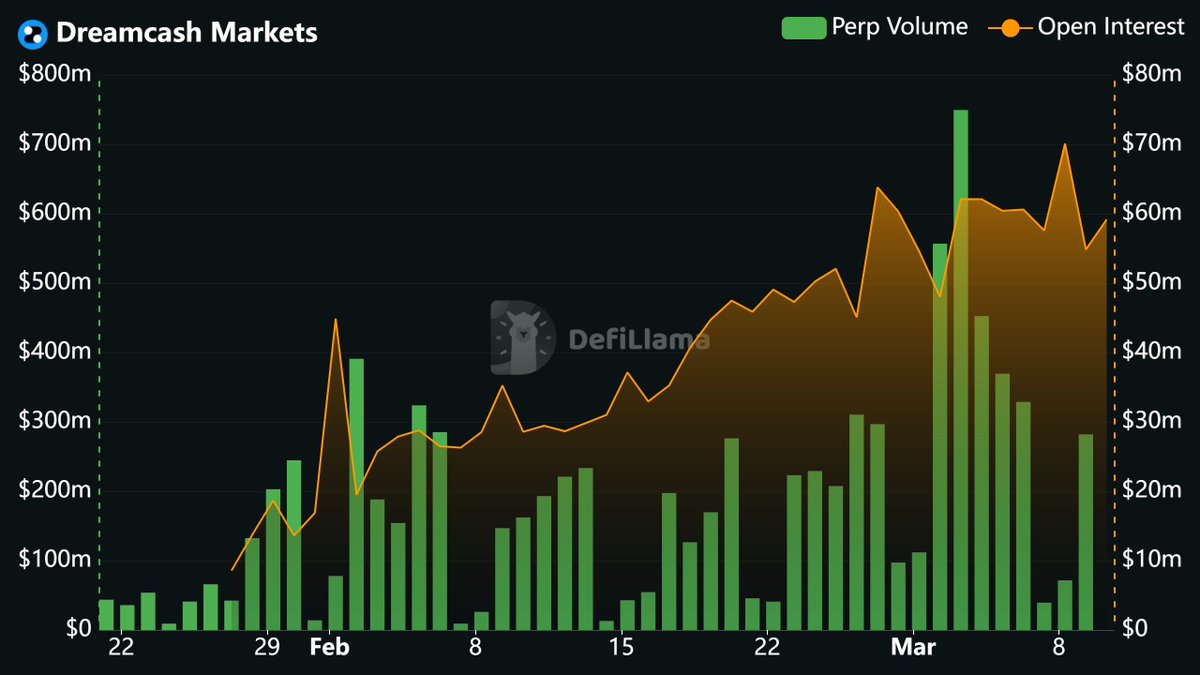
@Dreamcash - $2.1M
@StandX_Official - $1.7M
@BullpenFi - $0.5M
More perp stats, funding rates screener and ultimate points calculator on capys.app
Of course, fees alone do not define the best perp.
But ignoring them in a tier list makes no sense.
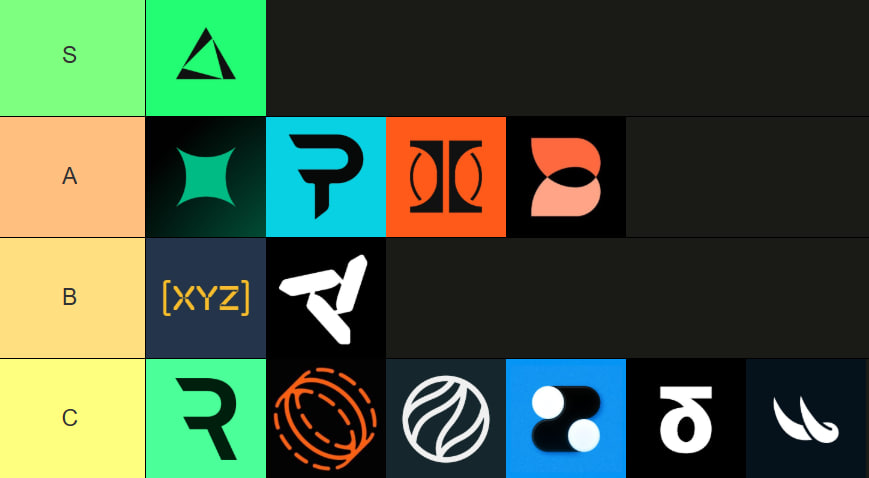
What would your perp tier list look like based on this?
English
Inbetween Days รีทวีตแล้ว

"Dreamcash is not a one-size fits all Oracle type deal...there's a lot of custom logic behind this" — @Marco_Beam
60 seconds on why @Dreamcash chose @PythNetwork + SEDA to power their 24/7 markets.
English
Inbetween Days รีทวีตแล้ว

@capy_onchain @edgeX_exchange Interesting. What’s your take on Aark which promotes itself as a “Leverage everything” perp dex?
English
@capy_onchain @variational_io @extendedapp @nadoHQ @pacifica_fi @hibachi_xyz @grvt_io @edgeX_exchange @StandX_Official @etherealdex Ah ok. When I’m a millionaire I’ll buy you a pint
English
@capy_onchain @variational_io @extendedapp @nadoHQ @pacifica_fi @hibachi_xyz @grvt_io @edgeX_exchange @StandX_Official @etherealdex How do you know the number of tokens there’ll be? For example Dreamcash shows 6M tokens.
English
I built the ultimate Perp DEX points calculator.
Estimate your potential airdrop value across top perp DEXs like @variational_io, @extendedapp, @nadoHQ, @pacifica_fi, @hibachi_xyz, @grvt_io, @edgeX_exchange, @StandX_Official, @EtherealDEX and more.
Check it here: capys.app
What perp am I still missing?

English
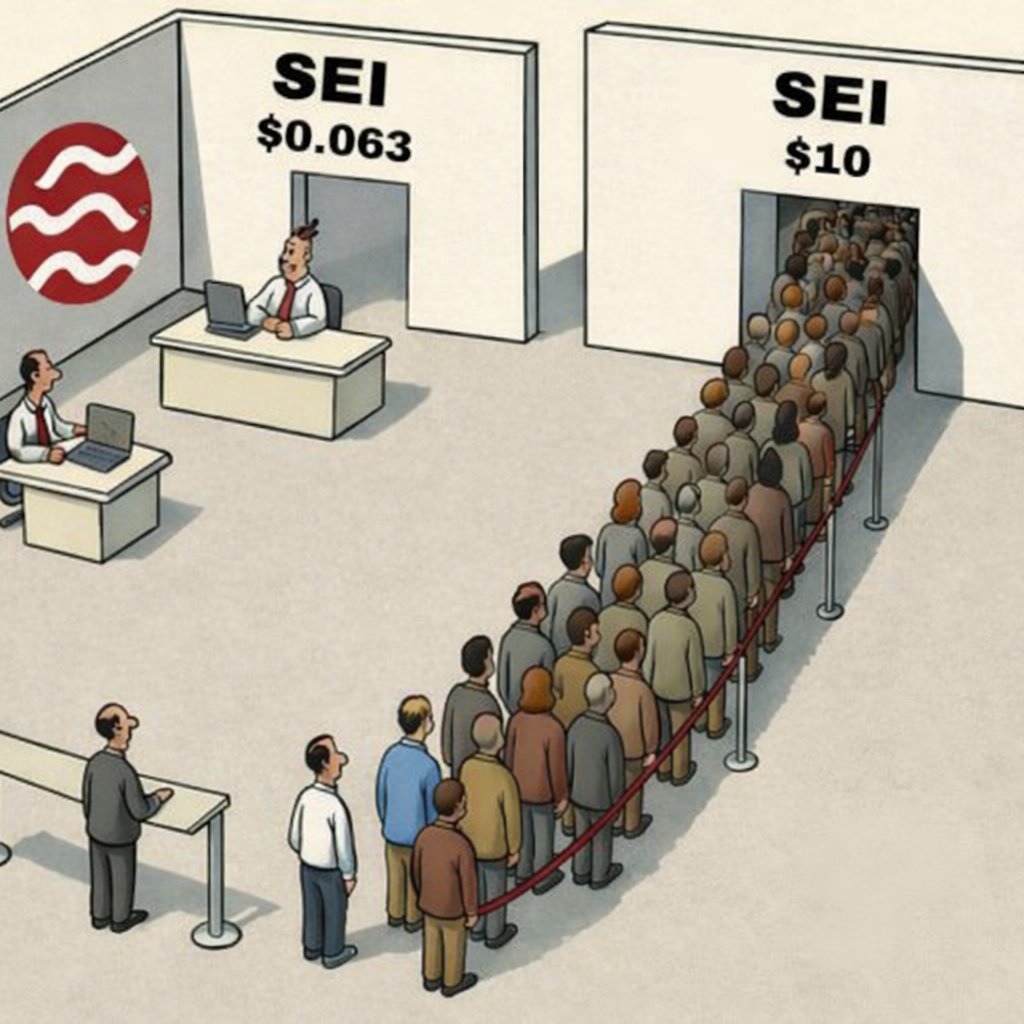
@kaseemsei You can actually buy it at $0.063. Just saying
English
You are early on $SEI
Buy $SEI at $0.63 or Buy at $10
The choice is yours
English
@kvzuobai @Dreamcash Download the app with invite code Y9B5X8 and start earning XP points as you trade. Tonnes of pairs to trade. Airdrop likely
English


@CryptoHayes $Dreamcash built on Hyperliquid lets you perp everything. Referall code Y9B5X8 if you need one when you download the $Dreamcash app.
English


@SeiNetwork @coinbase $SEI token continues shitting the bed though.
English