Alex Cupps

1.4K posts

Alex Cupps banner
Alex Cupps

Alex Cupps

@CuppsAnalytics

software engineer / data analyst / m.s.e., data science / trying to predict the future of fantasy football using data & machine learning🔮
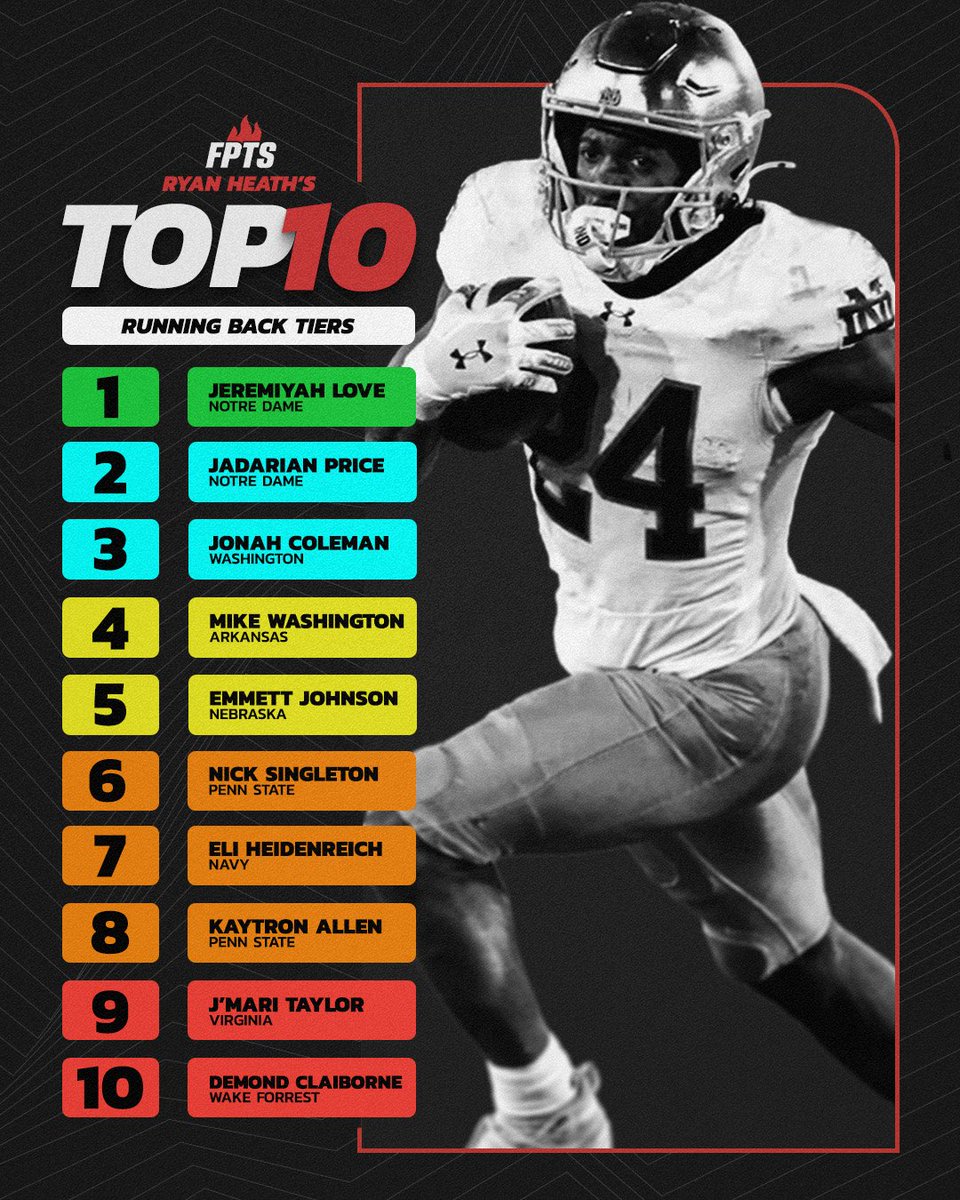
San Diego, CA เข้าร่วม Kasım 2022
157 กำลังติดตาม574 ผู้ติดตาม
ทวีตที่ปักหมุด
Alex Cupps
Alex Cupps@CuppsAnalytics·
My entry for “So You Think You Can Tout (Pilot)” Let’s slap it up @peteroverzet 🦭🤝
English
14
14
108
19.6K
peter overzet
peter overzet@peteroverzet·
the @UnderdogDrafts crew gave me 20 draft tokens to give away for the dance (NBA) & the zamboni (NHL) 10 each for the playoff best ball contests to win one, reply to this post with 1) ur underdog username 2) ur favorite submission you've seen thus far for so you think can tout
peter overzet tweet mediapeter overzet tweet media
English
51
9
34
4.6K
Alex Cupps
Alex Cupps@CuppsAnalytics·
@MaxAdamFF Good looks! Def too small of a sample to draw anything from, but interesting data for sure🤝
English
0
0
1
8
Max Adam
Max Adam@MaxAdamFF·
Noteworthy On/Off data (Data: NFLReadR): 3 Bears all on (n=95): Loveland: 31% tgts 42% yds Odunze: 17% 17% Burden: 16% 16% AJB off since 2022(n=241): Smitty 27% tgts 42% yds Goedert 17% 23% JT on/Pittman off since 2020 (n =145)/2025 (n=55): JT: 19% tgts 16% yds / 26% 17%
English
1
0
1
75
Alex Cupps รีทวีตแล้ว
Alex Cupps
Alex Cupps@CuppsAnalytics·
@StartSitEmFF Last couple classes brought the position all the way back🙏🙏
English
0
0
1
12
Alex Cupps
Alex Cupps@CuppsAnalytics·
We Need to Talk About Tyler Warren… Don’t let Loveland’s awesome rookie season diminish how good Warren’s was too. We were super lucky to get both of them in the 2025 class (plus another guy I’ll talk about Friday)…🔥🔥🔥 Today’s episode⤵️⤵️ youtu.be/7qMikcP8ePU?si…
YouTube video
YouTube
English
1
2
5
378
Alex Cupps รีทวีตแล้ว
JJ Zachariason
JJ Zachariason@LateRoundQB·
I see prospect data analysis on here all the time related to things like yards per route run, and it's great that people are doing that. But I do think there needs to be more work adjusting for strength of schedule/program strength and age. Extreme example: KC Concepcion might have an overall career yards per route run profile that's rather mid for a first-rounder, and you might compare it to Bryce Lance and say that Lance's looks better. But that's missing an insane amount of context. Concepcion played three years of college football, and he played against relatively good competition. Lance had one reception across his first three years of college. His career yards per route run profile looks better because he only started really running routes when he was older, and he was playing against weaker competition. What if Concepcion came back and played two more years of college football? You don't think all of his marks would continue to improve? (I mean, maybe you don't, but more experience generally brings better production.) This, to me, is a big reason early-declare status shows signal, too. The bigger reason is that good, talented players declare early, of course. But if you're prospecting via data, declaring early also means the player only had three years to compile production, putting themselves at a disadvantage compared to the guys who compiled for four, five, or even six years. This isn't a take on either of those guys (and both are very different players), but comparing the two without adjustments is borderline meaningless.
English
11
5
95
28.3K
Alex Cupps
Alex Cupps@CuppsAnalytics·
We’ve been in the short form content lab recently👨‍🔬🔬 Go tap into the other socials to keep up to date🤝⤵️ linktr.ee/cuppsanalytics
English
0
1
1
140
Alex Cupps
Alex Cupps@CuppsAnalytics·
For reference, Skattebo’s closest year 2 comps (taking into account his 4th round draft capital/mediocre prospect score) Checks every box we want for a day 3 guy after their rookie seasons.
Alex Cupps@CuppsAnalytics

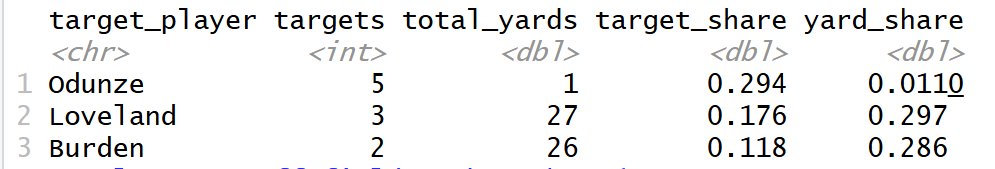
Cam Skattebo - Year 2 Statistical Comps 19/20 hit 1+ Top 24 FPPG finish (95%) 11/20 Top 12 (55%) 4/20 Top 5 (20%) Year 2 FPPG distribution specifically: Floor → 5.48 Q1 → 10.96 Median → 13.45 Q3 → 15.95 Ceiling → 22.64 One of the most undervalued players in dynasty. BUY.

English
0
0
1
171
Alex Cupps
Alex Cupps@CuppsAnalytics·
Literally the most nothing burger of a quote has people PANICKING on Cam Skattebo’s job security after he had one of the better analytical rookie RB szns in recent years. Remains a generational buy opportunity
The Coachspeak Index@CoachspeakIndex

it bears some noting that this was not an unprompted line from Joe Schoen, who was specifically asked by Giants beat writer Jordan Raanan whether he views Jeremiyah Love as a running back or an offensive weapon

English
1
0
1
421
Alex Cupps
Alex Cupps@CuppsAnalytics·
We Need to Talk About Colston Loveland... Loveland was more than my favorite TE prospect in the 2025 class. He was my 3rd highest graded TE prospect over the last decade… and his rookie szn metrics only made me like him more today’s vid on loveland⤵️🐐 youtu.be/41D9ohdd0cE
YouTube video
YouTube
English
1
2
9
517
Alex Cupps
Alex Cupps@CuppsAnalytics·
In today’s video, we’re wrapping up the 2025 receivers, yapping about some of the lesser-discussed guys. Anyone outside the big names worth taking a flyer on in 2026? @peteroverzet name another tout grinding chimere dike data in april, i’ll wait🤫 youtu.be/uE3QD6Jq1p4?si…
YouTube video
YouTube
Alex Cupps tweet media
English
1
4
8
574
Alex Cupps
Alex Cupps@CuppsAnalytics·
Yeah there are quite a few less samples in the y1/y2 comp than all years. Also the y1/y2 segment is a subsample of the overall n->n+1 sample so that’s probably not the best practice. I’ll take a look at how it compares to a similar/different sample of something like y3->y4! PASS looks like a super intriguing metric, I love it! I’m planning on making the jump from PFF to @FantasyPtsData for everything I’m doing starting this upcoming season. Can’t wait to get in there and see all the sick stuff you’ve been cooking up brother🤝
English
0
0
1
54
Ryan Heath
Ryan Heath@RyanJ_Heath·
If I'm understanding what you did here correctly, I don't think you can directly compare the RSQ of y1 YPRR -> y2 to all years YPRR -> year n+1 . The y1 -> y2 version probably has fewer total observations, right? Sample size is going to affect RSQ. (In general, fewer observations can mean an artificially higher RSQ, which is the opposite of what's occurring here, but if you want a fair comparison, I'd probably do something like y1 -> y2 vs. y3 -> y4 among all the same players.) The main thing though, relating to what Jakob said, is that a 100-route minimum is probably too low to expect comparable per-route results. Part-time players are often on the field to be utilized in specific ways their coach thinks will take advantage of their skillset. The extreme example is 25 screen targets on 100 routes for Kadarius Toney being a 0.25 TPRR, but it can be more subtle than that. Our separation data got a lot more useful when combined with total route volume in my testing last year; being able to separate against a variety of defensive looks across a full route tree is more valuable than running a couple of different types of routes in a part-time role. CTRL + F "after a lot of testing and tinkering" in this article and read the attached footnote for more of my thoughts on the topic fantasypoints.com/nfl/articles/2…
English
1
0
2
98
Alex Cupps
Alex Cupps@CuppsAnalytics·
We Need to Talk About Luther Burden... everybody knows burden had some of the best per-route metrics not only in the 2025 class, but any WR class in recent years. it begs the question...how predictive is this type of analysis anyway? go find out!🤝⤵️ youtu.be/yCyx2CaNGyk
YouTube video
YouTube
English
2
3
13
1.9K
Alex Cupps
Alex Cupps@CuppsAnalytics·
Appreciate the insights Ryan!🙏🙏 A couple thoughts… 1. I totally agree on the front of trying to identify the players that have the highest chances of breaking into that above-replacement range. I also agree that the edge gained when using per-route stuff has gotten DRASTICALLY smaller over the past several years. I’d even push it a step farther and say we’re probably due for a convo about the diminishing returns on this front 2. You mention that RSQ is highly driven by the guys who (predictably) score a lot and continue to score a lot YoY. Not a whole lot to learn on that front, which I honestly never thought of from that angle. One note here - after Jakob and JJ weighed in yesterday, I decided to look at how the RSQ changes for these metrics when looking ONLY at the rookie -> sophomore year jump. In theory, this would address the issue of overemphasizing the big name studs propping up the overall n -> n+1 RSQ numbers. What I found was odd…the per-route stuff was actually lower when looking specifically at y1->y2 (much lower in some cases, like tprr). I wouldn’t necessarily expect it to EXCEED the n->n+1 counterpart, but to see a relatively drastic dropoff was a bit surprising to me. Curious your thoughts here!
Alex Cupps tweet media
English
1
0
0
54
Ryan Heath
Ryan Heath@RyanJ_Heath·
Jakob and JJ have already made some good points here, but I thought I'd chime in with this: One factor in the value of per-route vs. per-game metrics (or any two metrics) is how much the market in an opportunity-cost- and power-law-driven game like fantasy football reacts to them. The goal every year is to find the 12-18 players that actually matter, of which half or more will usually go in the top 12-18 picks of drafts. So you're really trying to find the ones the market hasn't. Per-game metrics (and really anything that's volume-driven) will have the best RSQs. But you can think of that as being driven by the studs who've scored tons of fantasy points recently, whom everyone (largely correctly) expects to continue scoring tons of fantasy points. There are some exceptions (e.g., Rashee Rice last year) that can make sense to attack aggressively, but for the most part, the market is already in on all the guys who stand to benefit from that higher RSQ. The same isn't always true of per-route stats (though the edge probably gets smaller every year as more people incorporate them into their process). In most instances, you shouldn't really think of their RSQ as competing against that of FPG; it's competing against the profiles of the other players you could draft in that range instead.
English
1
0
0
97
Alex Cupps
Alex Cupps@CuppsAnalytics·
I changed the threshold from a game minimum to a route minimum and I’m seeing an increase in overall signal on the per-route stuff now! Like you said, definitely not the end-all, but absolutely an important piece of the puzzle for sure Your work was one of the main reasons I decided to do an entire master’s thesis on this predictive fantasy data stuff, I really appreciate you taking the time to chime in JJ!!
English
1
0
1
139
JJ Zachariason
JJ Zachariason@LateRoundQB·
Yeah that’ll do it. Not saying per route run numbers are the end all at all, but per game are giving you better correlation because it’s going to capture volume more. And volume is a big driver. When there’s no baseline for routes run, you’re capturing some players who ran, say, 30 routes. One big play can skew that data and drive down correlation. That won’t happen per game, since they’d have to do that week in and week out. I believe @JakobSanderson was saying something similar in his response.
English
1
0
4
136
Alex Cupps
Alex Cupps@CuppsAnalytics·
@LateRoundQB I should add, I did have a # games threshold (>=5) but perhaps a routes threshold would be better…
English
0
0
0
32
Alex Cupps
Alex Cupps@CuppsAnalytics·
@LateRoundQB Looking at burden’s rankings among his fellow 2025 WRs, yes - 100 routes! But when running the predictive feature comparisons across the 5 models, I did not set a route threshold there.
English
2
0
0
123
Alex Cupps
Alex Cupps@CuppsAnalytics·
@JakobSanderson Totally agree that we want to evaluate each profile in their own context. There’s obviously no one correct answer on the best approach so I appreciate your insight brother🫡
English
0
0
1
51
Jakob Sanderson
Jakob Sanderson@JakobSanderson·
@CuppsAnalytics Well we definitely shouldn't be putting much weight on cherry-picked thresholds. But I also don't think we should be trying to predict individual players' futures by looking only at league-wide R^2 data We should be trying to evaluate each profile as a whole in their own context
English
1
0
1
92