Indeed
336 posts


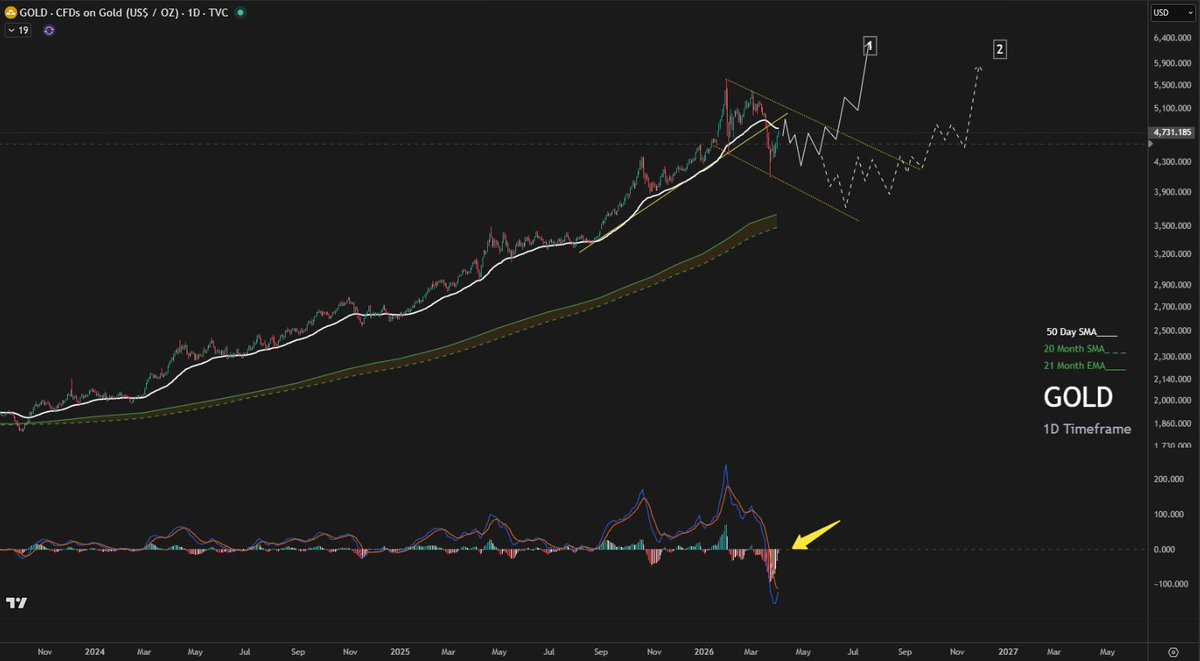
#Gold - Looking at the 4H chart, I think price could react to the 50-EMA as resistance. I'll be following short-term momentum to get back in for a quick long as explained before. If I see momentum building at the 50-EMA, I'll long again. Otherwise, if Gold can re-test into the 200-Day EMA, I'll be looking at volume and how price reacts in order to jump in. IMPORTANT: On higher timeframe structure (monthly chart), it's crucial to understand that long-term momentum has been invalidated with this current monthly candle. I believe price could either range at this current zone, but in case price breaks lower between $3700 to $4000 range, could represent a great long-term buying opportunity. I hope it's clear how I am trading this from short-term into long-term perspective.