Tweet ghim

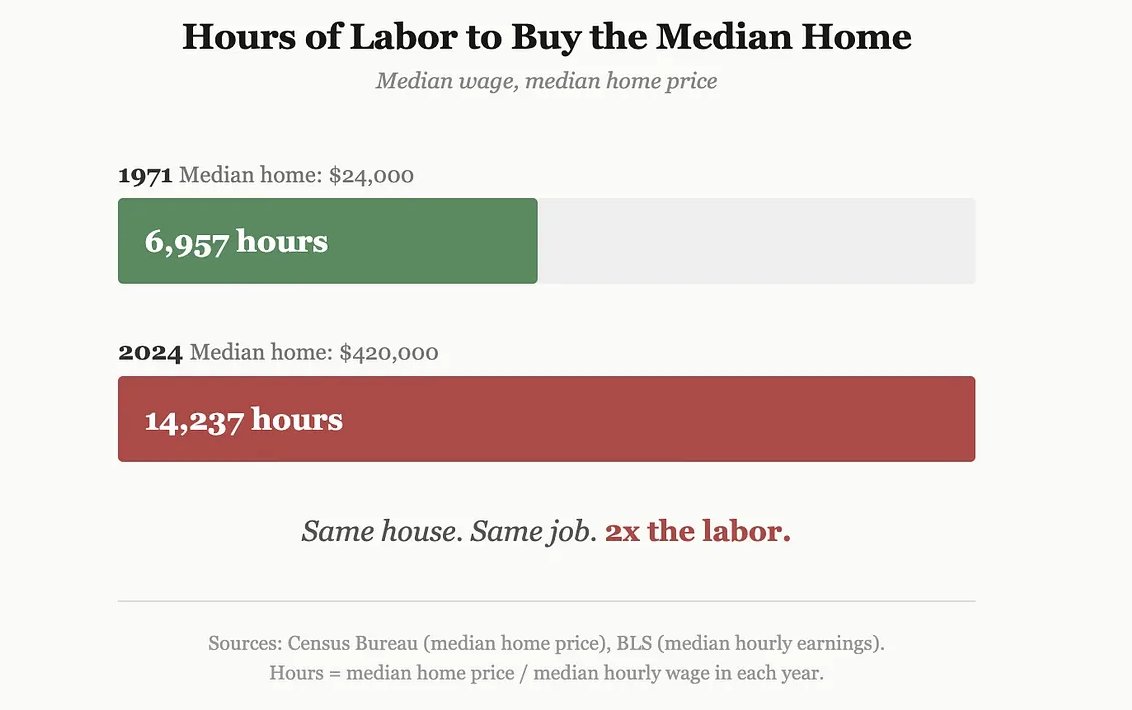
In 1971 the median worker needed 6,400 hours of labor to buy the median home. By 2024: 14,000 hours. Same work. Same effort. The house costs twice the labor it used to. The house didn't change. The hours did.
English
Nick Manteris
227 posts

@thecostofwork
Why a regular paycheck used to cover a regular life and doesn't anymore. Restaurant server. Reader. Writing about what the economic debate keeps leaving out.


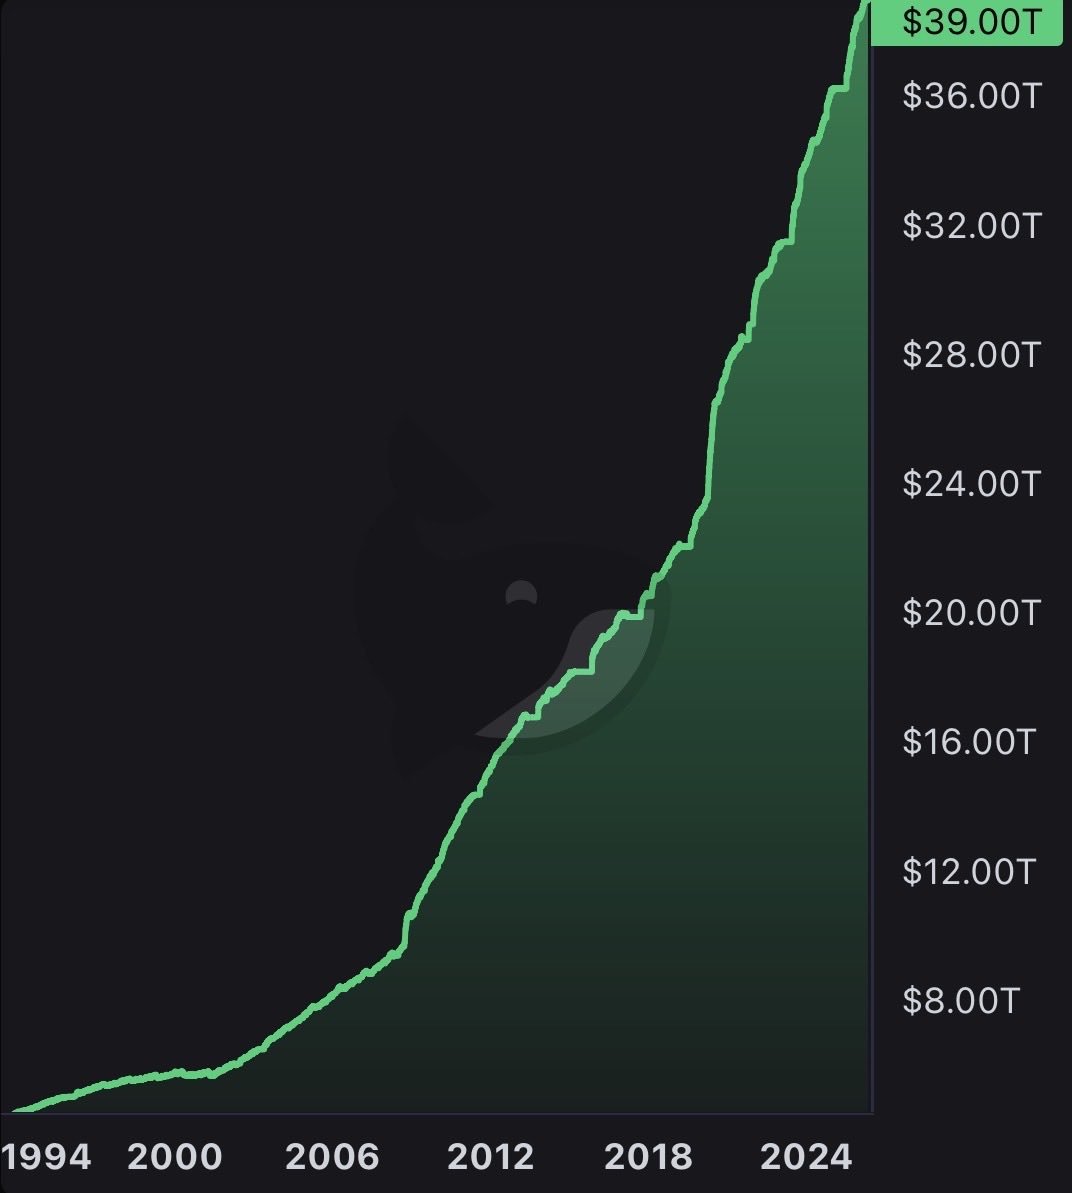
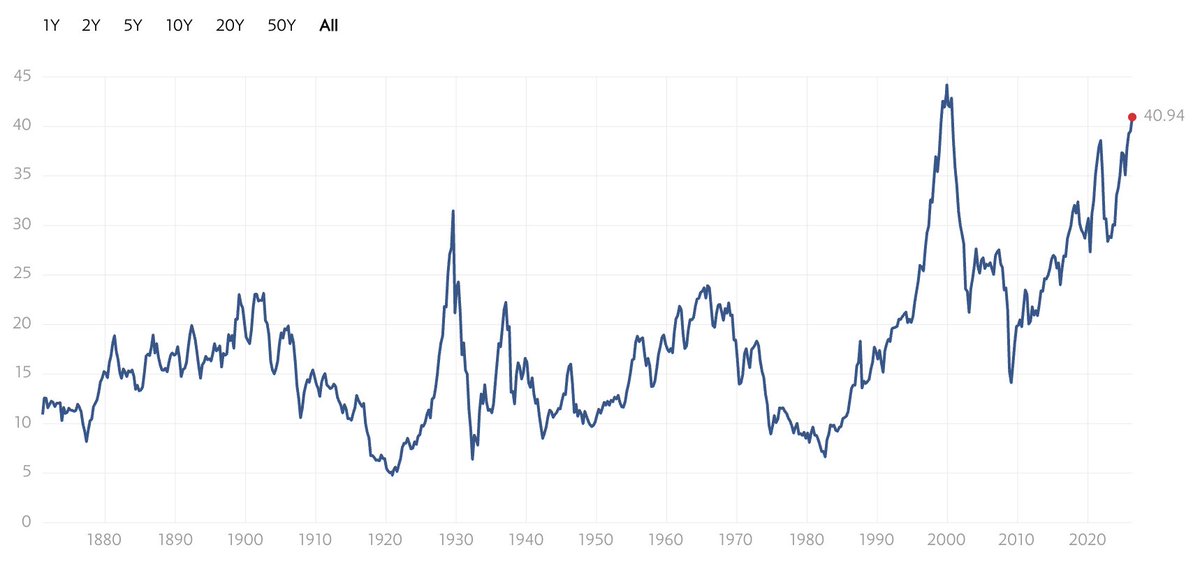
Wall Street outgrowing Main Street at the fastest pace in history 🚨🚨


an economist explains how rent control is actually fine and good currentaffairs.org/news/rent-cont…

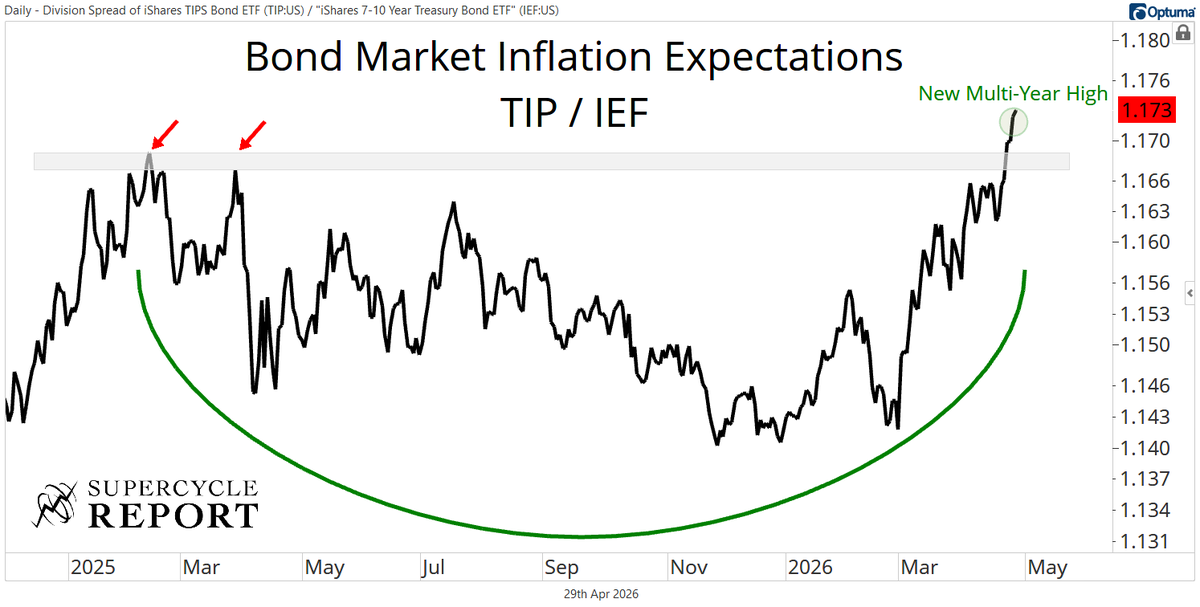
The bond market is yelling from the rooftops that inflation is about to soar. And you're betting on the Fed remaining dovish?? Think again!