Tweet épinglé
Jacob
2K posts


Jacob
@JacobBeckerman
I watch candles print for hours every day.
Inscrit le Nisan 2021
361 Abonnements837 Abonnés
@ZenomTrader Looking forward to seeing what you come up with. I built something similar with dynamic scaling plans, account sizes, risk-per-R, etc.
English

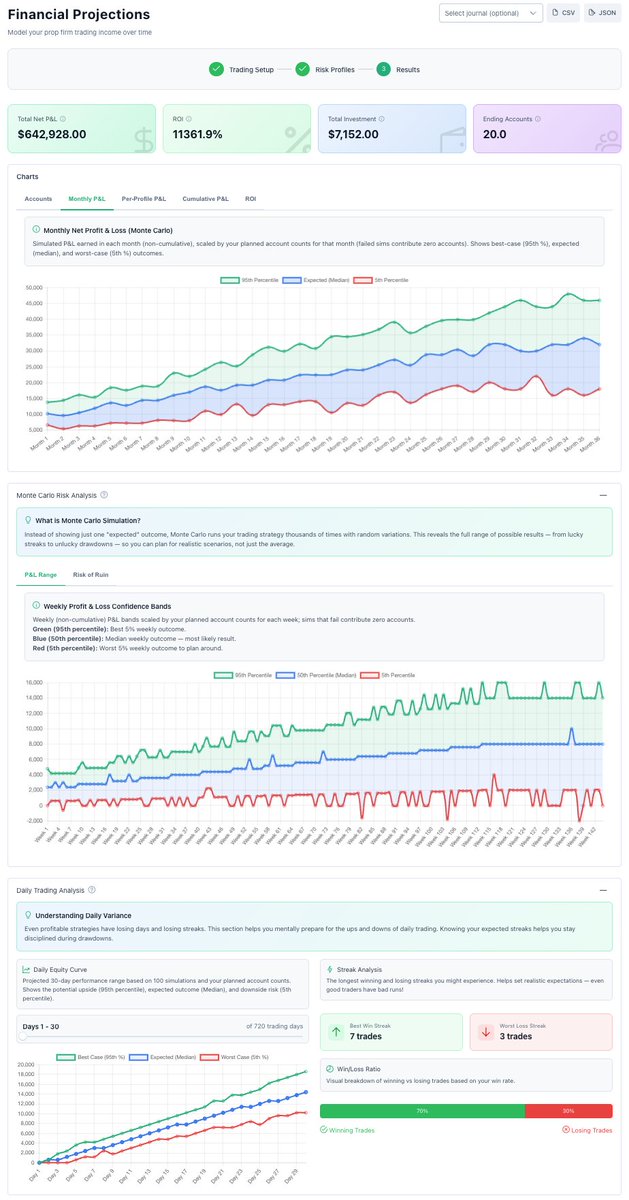
I’m working on one of the best tools ever created in the trading industry.
It includes everything from portfolio level analytics to correlation analysis and monthly performance tracking.
The prop firm simulator is also almost finished,
With full support for prop firm rules, including CFD firm templates and futures firm templates.
You’ll be able to see:
the average duration for a strategy to reach a payout,
the ROI % over the entire backtested period,
all of it mapped onto the prop firm business model, scaling included.


English
@KennyTrader_ Why did you move off of simple Golden SBS? This seemed to be your most profitable phase.
English


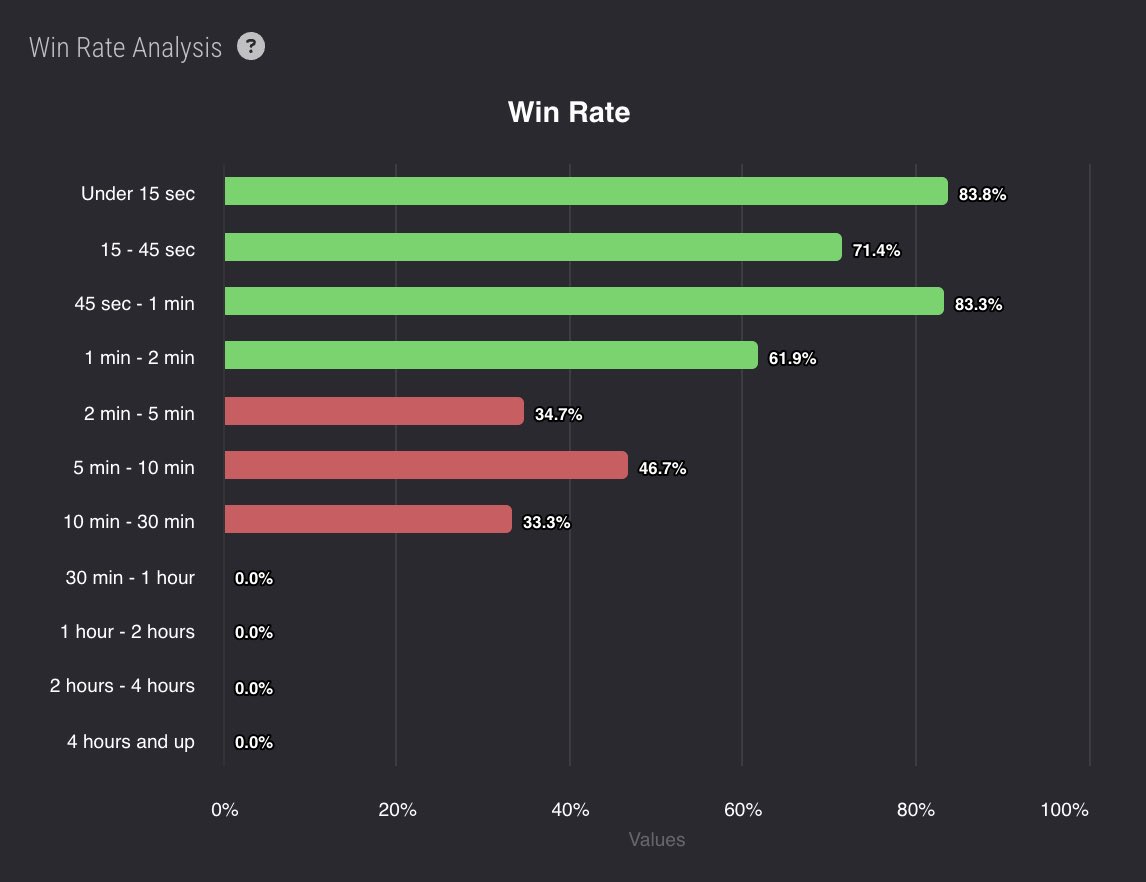
@TheAlg0mist If it works on any timeframe why is your higher timeframe win-rate so much lower?
English

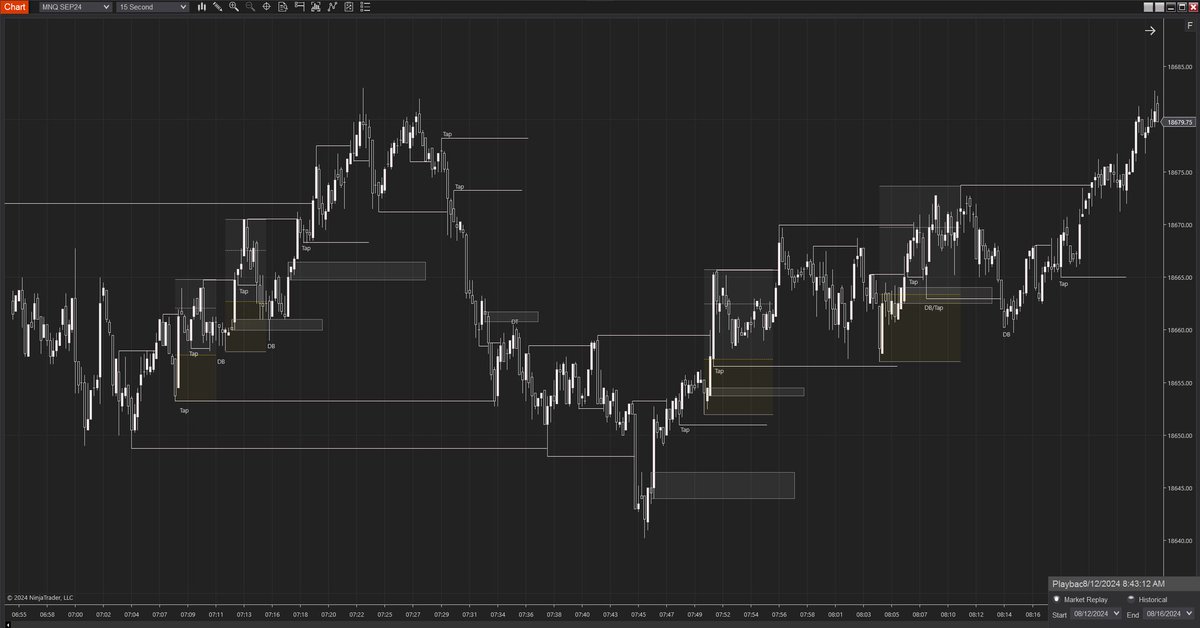
One of the biggest improvements
in my trading has been scalping on the Lower Timeframes.
🕰️ Time is fractal.
If you’ve got edge🔪
it works on any timeframe.
I prefer being in the markets
as short as possible.
Get in, get my piece of the pie
& go on with my life 😉
English


@JacobBeckerman I will check when I get back on pc. Can you attach a screenshot and tell me what is wrong
English
NQ H1 Stats+ is out now: Magic Box excursions, and percentile edges. RTH mode, alerts, visuals.
Feedback? Hit me.
tradingview.com/script/SO4RNLQ…
jay@jay555b
● Strategy: Targets Mean Reversion to the Hourly Open after 1H Liquidity Sweeps. ● Data: Displays historical probability and sample size based on the specific breakout time. ● "Magic Box": Highlights the optimal entry zone using historical price extension data. ● Visuals: Dynamic box coloring (Green/Orange/Red) indicates the probability tier. ● Validation: Auto-marks successful setups with a ✅ when the target is reached.
English

🚨UNPOPULAR OPINION: 🚨
Its better to be the guy who spends $5k-7k/mo on prop firms and gets $25,000/mo in payouts than it is to be the guy who spends $0-200 per month on prop firms and gets $2,000/mo in payouts.
Price of eggs wont change for you just cause you didn't blow any accounts this month. Money talks.
English
@JBActors @Higher_Lows_T @BillAckman @ZohranKMamdani So how do you propose Israel solves the issue? Hamas launches a barbaric attack and then hides behind children.
Oh well, we can't attack them there....
Hamas needs to be eradicated and then the unfortunate death of children can stop.
English

@Higher_Lows_T @BillAckman @ZohranKMamdani Using civilians as shields is a war crime. So is bombing them anyway.
Genocide isn’t measured by who started the fire, but by who refuses to stop burning children once they know they’re there.
English

.@ZohranKMamdani in his own words 36 hours after the launch of the Hamas slaughter and rape of Israelis including 43 Americans killed and 12 hostages taken.
Is this who we want to be our mayor?
Zohran Kwame Mamdani@ZohranKMamdani
My statement on the last 36 hours across Israel and Palestine:
English
@Eddie_Fibonacci Something to bear in mind with this type of analysis is that correlation does not equal causation. You have to factor in how often the London Session closed bullish regardless of the 2AM candle over the test period.
English

📊NQ 10-Year Backtest Insight
If the 2am hourly candle closed bullish, then:
65% of the time, the London Session (2am - 8am) closes bullish as well
53% of the time, the session closes above the 2AM candle high
#statisticaltrading
English
@GoshawkTrades Huge CON with MQL is the language. If NT has a steep learning curve than MQL is Mt. Everest.
English

Pros:
- Same MQL code for backtesting and live execution
- Huge broker support worldwide
- Good amount of resources and developer base
Cons:
- Limited to mostly forex/CFDs - no stocks or futures
- The interface and some functions are becoming a bit outdated
GIF
English
4 platforms and brokerages that changed the game for trading automation.
1. NinjaTrader

English
@mohitmishr93531 Untapped Goldmine and your first thought is too broadcast it to the world. Riiiight....
English

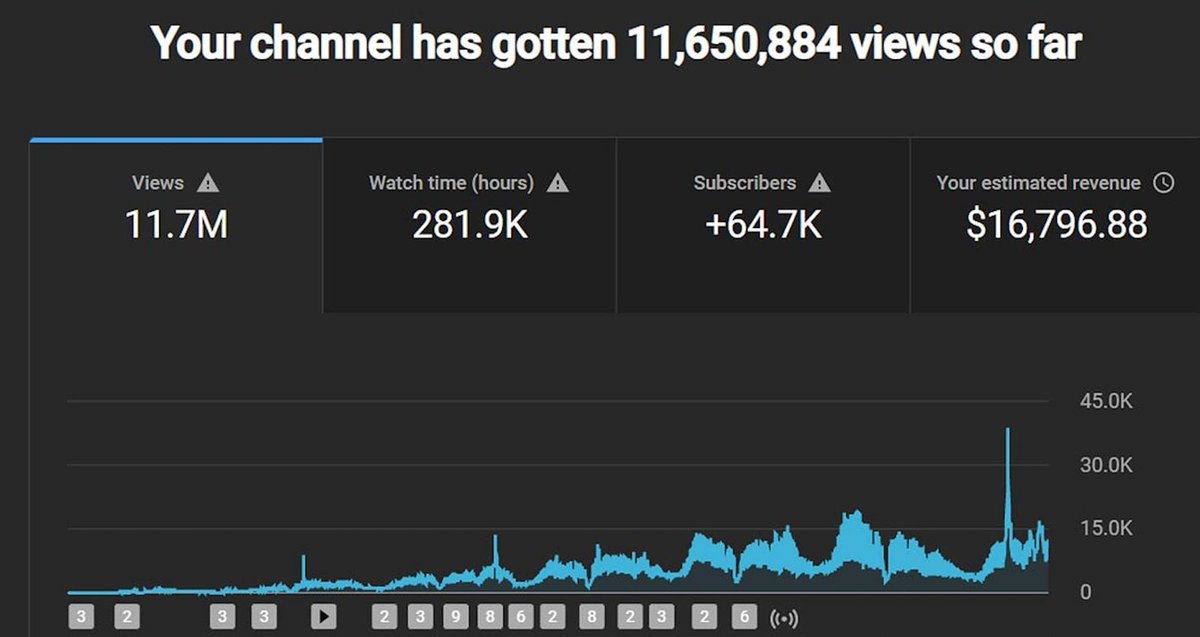
Untapped Goldmine: YouTube Shorts
12 days. 11.7M views. $16.7K in ad revenue.
All I do? Cut trending long-form videos into short clips.
AI handles editing + uploads.
Almost no one is monetizing Shorts like this
Reply “SHORTS,” like & retweet — I’ll DM you (must be following)
English

@KatherinaNote The issue with this is that it doesn't factor in how many days were bullish regardless of the first hourly candle. Correlation does not equal causation.
English

Tested from 1-1-2016
You're welcome
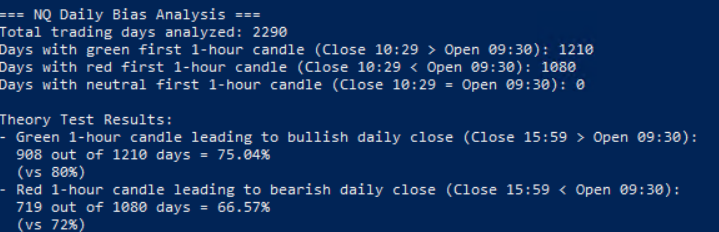
Trader Theory@tradertheory
The first 1 hour candle on NQ can give you daily bias According to the data, the first 1 hour candle of the NY session has over a 72% chance of dictating how the daily candle will close: 1. 80% of the time, a green 1 hour candle led to a bullish daily close. 2. 72% of the time, a red 1 hour candle led to a bearish daily close. 1 year of data provided by @edgeful.
English

@JacobBeckerman did you have any updates on that hourly indicator you are working on?
English
@CheddahGetta Well, turns out you're 100% right. I had an error in my calculations and just ended up getting lucky this time.
English

@JacobBeckerman The probability of reversion should be higher the earlier you are in the hour, the same would be for every hour. I would double check the logic/code on how you are pulling that.
English
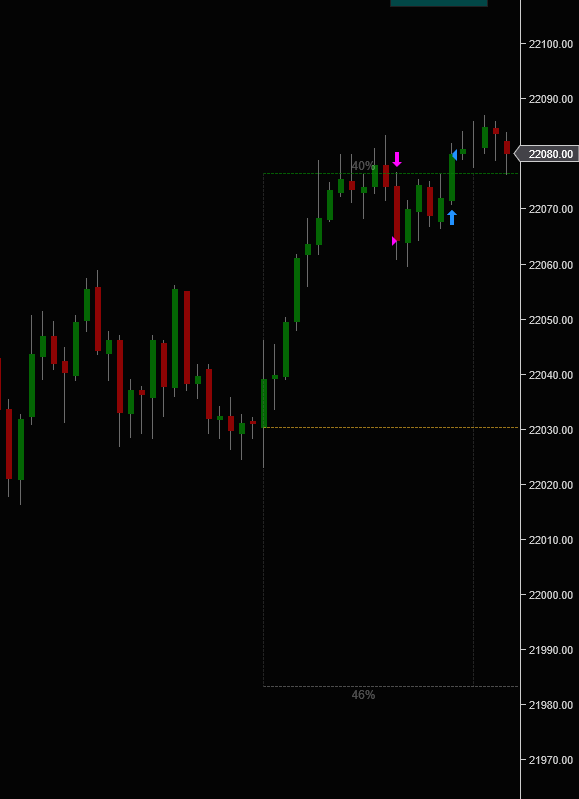

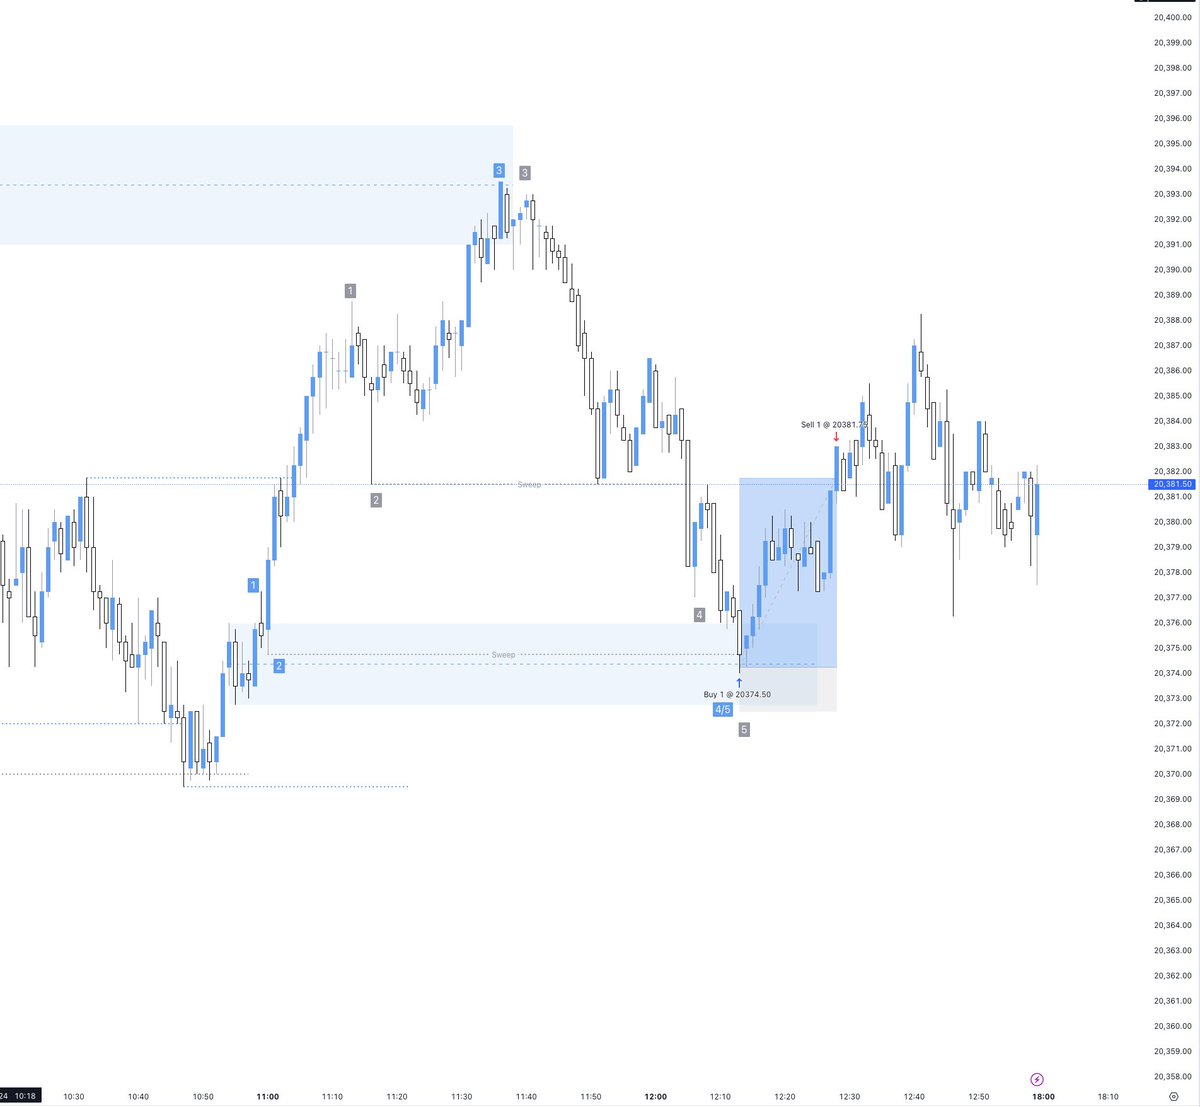
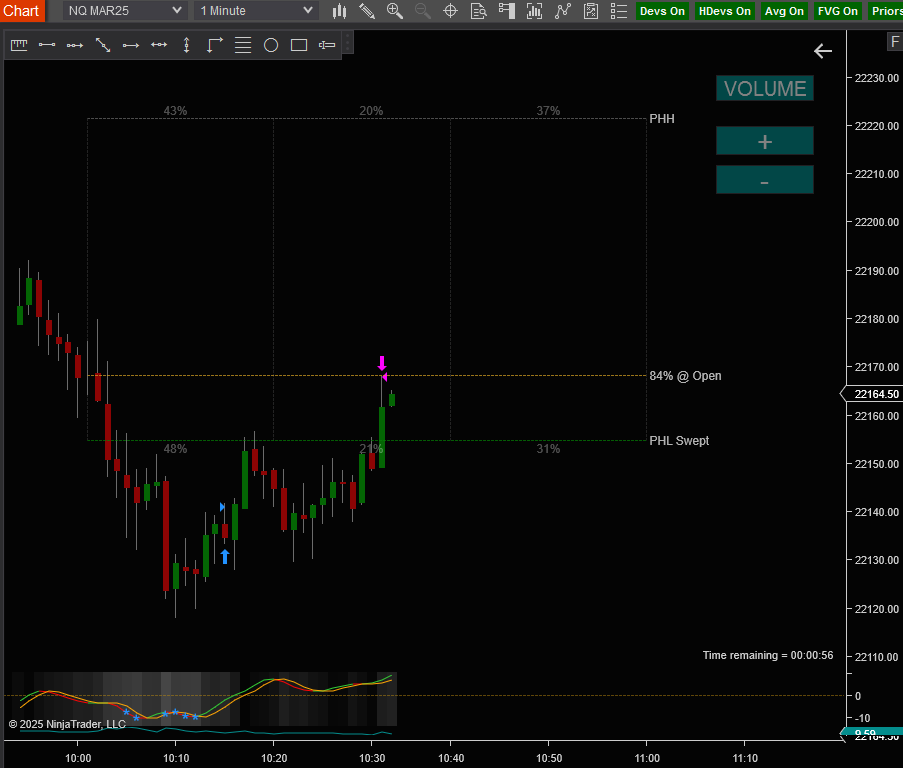
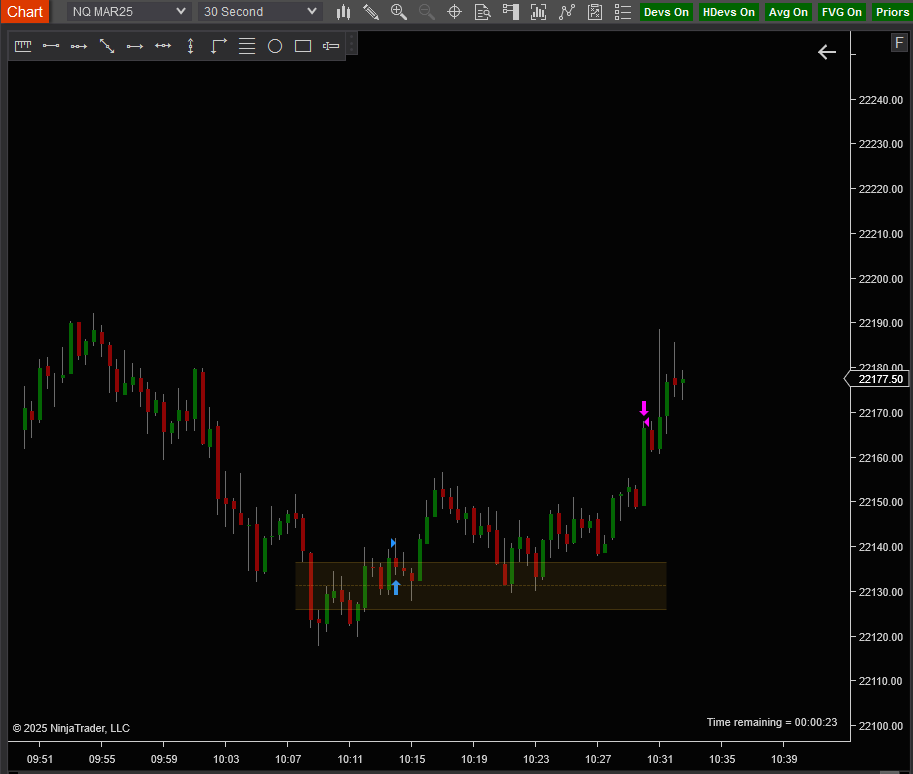
$NQ | 2/19/2025
+27pts
30sec Inversion after prior hour low sweep. 84% probability retrace to hours open.
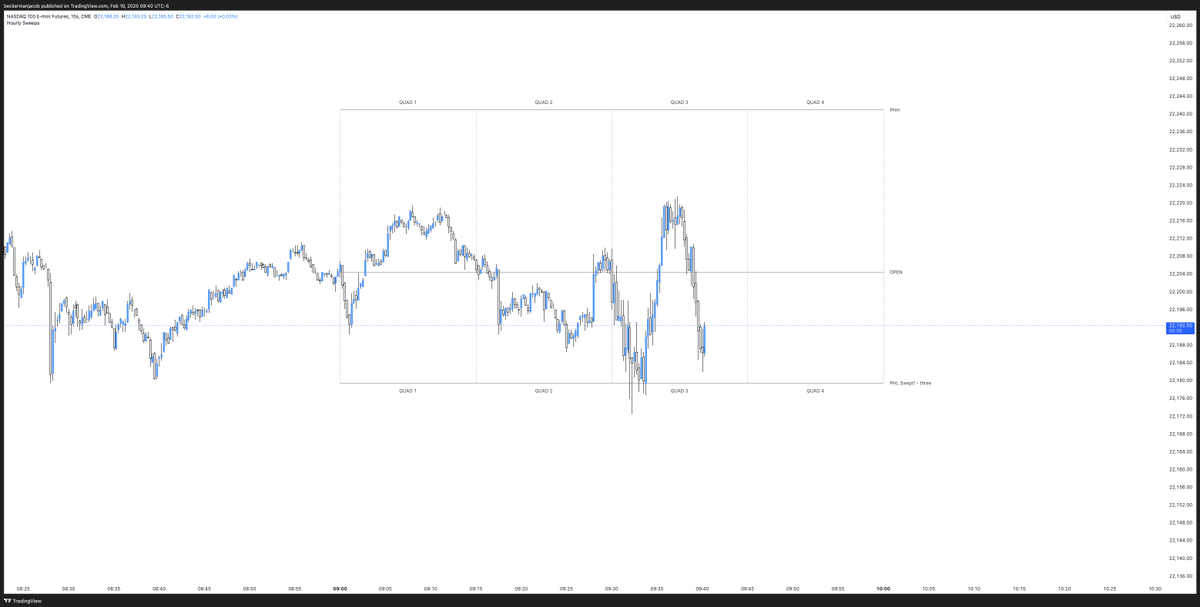
NQ Stats@NQStats
“Hour Stats” looks at each individual hour during the NY session and provides reversion statistics relative to sweeping the prior hour's high/low, in addition to where the highs and lows form for that specific hour. nqstats.com/hour-stats
English
@air360 @KatherinaNote Still need to update with real stats, but I think that this type of presentation is useful.
English
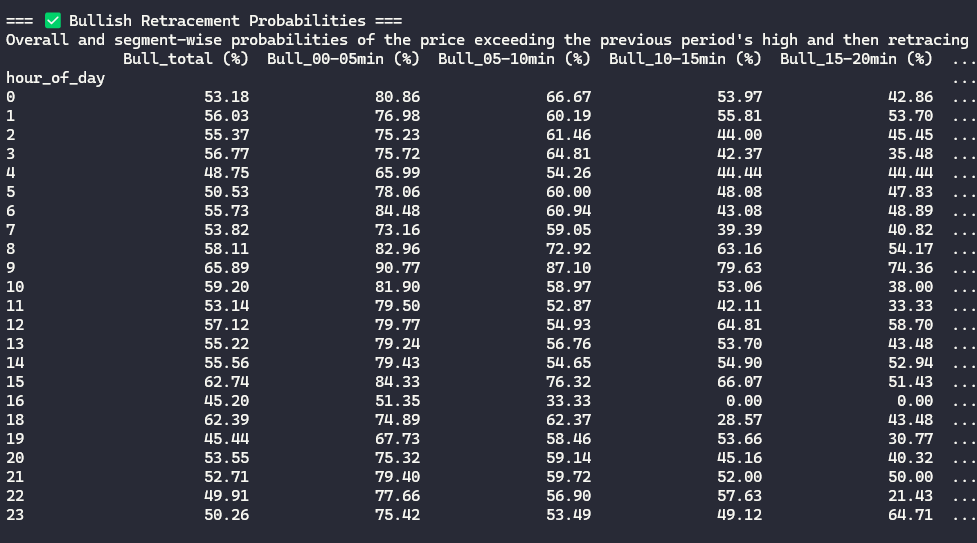
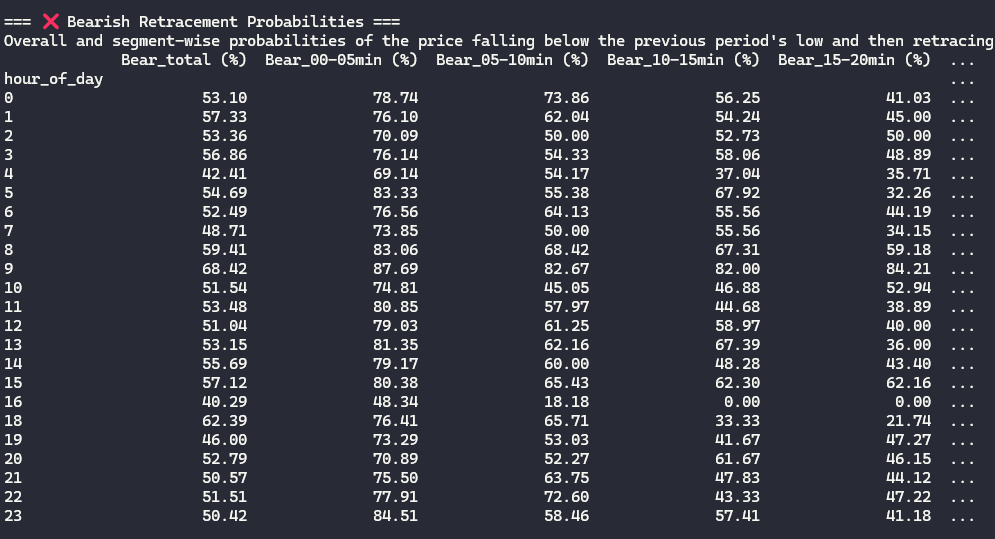
I've been running the data cause i was skeptical
Reviewed my logic and ran it again
5 min breakdown of the first 20 min of every hour
NY Time - NQ / US100
summary if prev hourly high / low is taken in the first 5 min candle it is .....
English
Ran @CheddahGetta stats for London as well. We had a 76.56% chance of hitting this hourly open and we dumped straight.

English