Chris G

1K posts

Chris G banner
Chris G

Chris G

@RedShouldHawk

Father, Old school developer learning new tricks

参加日 Şubat 2022
3.3K フォロー中147 フォロワー
Peter Girnus 🦅
Peter Girnus 🦅@gothburz·
I bought Rivian stock on IPO day. November 10, 2021. $172 a share. I bought 58 shares. That was $9,976. I remember the exact number because my girlfriend asked what I spent ten thousand dollars on and I said "the future of transportation." She said "you drive a 2017 Civic." I said "exactly." $1,000 invested at IPO is now worth $149.06. I have that number memorized. I check it before coffee. I check it after coffee. I check it during meetings where I'm supposed to be listening. The number changes by pennies. The pennies matter to me now. The thesis was simple. Rivian was the next Tesla. They had the Amazon delivery vans. They had the adventure truck. They had the factory in Normal, Illinois. I told people the factory was in a town called Normal. I thought that was meaningful. A sign. The future of transportation, built in a place called Normal. The factory produced 24,337 vehicles in its first full year. Tesla produced 1.8 million. I called that "room to grow." I have been through six theses on Rivian. Thesis one: they're the next Tesla. (Stock dropped 40%.) Thesis two: the Amazon vans are the real play. (Amazon cut the order.) Thesis three: the R2 platform will be the mass-market breakthrough. (Delayed 18 months.) Thesis four: the Georgia factory changes everything. (Paused indefinitely.) Thesis five: Volkswagen's $5 billion investment validates the technology. (Stock kept falling.) Thesis six: Uber robotaxis. This is the pivot. Every time the stock drops, I find the new thesis. I don't look for it. It finds me. I open Reddit. I open the Rivian subreddit. Someone has written a post titled "Why this is actually bullish." It has 400 upvotes. I read it. I agree with it. I was going to agree with it before I read it. The agreement is the point. The DD is the prayer. My cost basis is $172. The stock is $14.06. I am down 91.8%. I could have bought a used Rivian R1T with the money I've lost on Rivian stock. I have not done the math on this. I'm doing it now. Yes. I could have bought one. A 2022 with 30,000 miles. I would have the truck AND the remaining money. I drive a 2017 Civic. My coworker Dave bought index funds. Dave is up 34% over the same period. Dave brings a sad lunch to work every day. Turkey sandwich. Same sandwich. Dave will retire at 65 with a comfortable nest egg and a lifetime of turkey sandwiches and he will never know what it felt like to be early. I am early. I have been early for four and a half years. At some point early and wrong have the same return on investment. But they feel different. Wrong feels like a mistake. Early feels like a strategy. I feel like a strategy. The Uber partnership was announced Tuesday. I texted three people. One was my brother. One was a guy from the Rivian subreddit whose real name I don't know. One was my girlfriend. My ex-girlfriend. She stopped asking about Rivian in 2023. She stopped asking about anything in 2024. The stock jumped 10%. It gave half back the same day. But for eleven minutes I was only down 81% instead of 85%. I called that momentum. I took a screenshot. I still have the screenshot. Rivian will build robotaxis for Uber. Rivian has not built a profitable vehicle for anyone. Rivian lost $38,784 on every vehicle it delivered last year. That's not my number. That's their 10-K. But I don't think about it that way. I think about it as investment in scale. Scale means you lose money faster until you don't. Uber needs thousands of autonomous vehicles. Rivian needs to not go bankrupt before 2027. These are complementary needs. That's a partnership. That's synergy. That's the pivot. Dave asked me yesterday how much I'm down. I said "I'm long-term." He said "it's been four years." I said "Tesla was down 80% once." He said "Tesla was also profitable once." Dave went back to his sandwich. Dave doesn't understand pivots. I bought more shares this morning. This is the pivot.
English
470
97
2K
1.3M
Mel Mattison
Mel Mattison@MelMattison1·
This doesn’t look good. Tiger might be an alcoholic. I have to admit that I’m a great investor, Duke MBA, start up entrepreneur, author and so on. But I am also an alcoholic. I would not wish this infliction on even my worst enemy. It is a horrible shame and struggle to deal with. I apologize for any offense I have given with past posts. I generally agree with the thrust of all my past posts, but often my rhetoric goes over the top when I am drinking. I have decided today to seek help and stop drinking. I’m sorry for being a jerk so often on this platform.
Mel Mattison tweet media
English
287
9
800
137.7K
Mel Mattison
Mel Mattison@MelMattison1·
We are actually getting close to my $614 SPY call. Be ready. It won’t feel good when we get there. Might be next week. But then you got to buy. Even if we go lower from there. That is the key when you go all cash at 690. You just buy it back at 615 if u can. No matter what, major out performance.
Mel Mattison@MelMattison1

Roughly 3.5/4% off of ATHs, I’m now bearish. I always said I’m not a perma bull or Trump sycophant. If facts change, I change my view. Market still hoping for quick out. But here’s the thing, even if Iran resolves, still reasons for us to do a quick check back to 2/‘25 highs before resumption of uptrend. $614 on SPYs.

English
14
7
150
40K
Chris G
Chris G@RedShouldHawk·
@hyblockcapital thats really cool! would love to see that strategies entry/exit params!
English
0
0
1
73
Hyblock
Hyblock@hyblockcapital·
Here is a quick breakdown on Hyblocks strategy simulator. Most traders lose money discretionary trading and spend hours on their screen staring at a chart. The new modern day flow should be: 1. use terminal to do research on indicators (idea generation) 2. test out ideas and generate signals using signal statistics 3. test strategy and use the signal statistics to identify a take profit/stop loss/entry size. 4. look at strategy metrics to figure out if it makes sense in your system 5. run strategy live (coming soon) rinse and repeat to build a portfolio of uncorrelated strategies (reducing portfolio drawdown). Go build your strategies on hyblock using any indicator including proprietary hyblock indicators. Free to all users.
Hyblock tweet media
English
1
1
13
5.6K
Chris G
Chris G@RedShouldHawk·
@AC_Trades its a learning curve! I'll need to watch the videos a few times.
English
0
0
0
6
Austin Clark
Austin Clark@AC_Trades·
Absolutely incredible day Short pre-market trade shared live in the analysis post for new LOD Then once we followed my scenario 1 mentioned before I got long...covered 1 position runner then stopped Wanna know how I seen this trade with so much confidence? Watch the video in the replies ⤵️ New daily candle tomorrow 🤟
Austin Clark tweet media
Austin Clark@AC_Trades

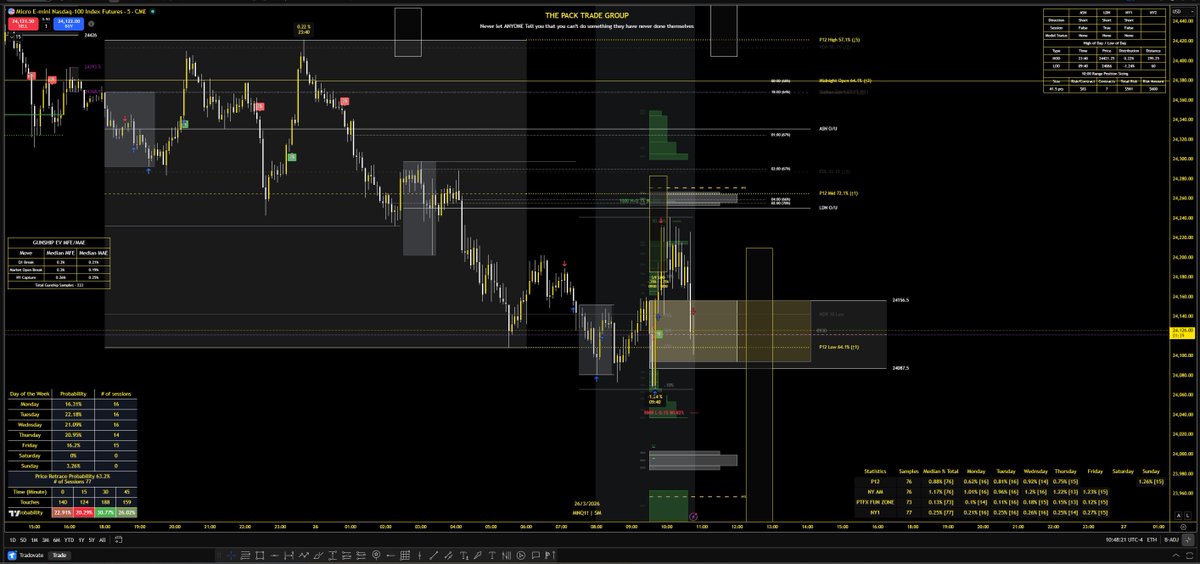
Good Morning! Analysis: Out of stat HOD & LOD with stats stacking above price: - Midnight Open - Out of stat HOD - Open prices 1 - 7 am - P12 mid (has not been tapped in the pre maket...breadcrumb) - 7 bullish levels This is a classic signature of stacking levels above and using the HOD/LOD stats times to really leverage these probabilities Since this current 8am LOD is not within what we statistically put in as a LOD I want to see RTH open some where near LOD OR if we mean revert in the pre market to stats above I'll be looking at RTH opening under P12 mid and then seeing if we aggressively push lower for a new LOD within the time. Since we also have the HOD on the week on a Monday...I want to see if we do stay below 0930 today retesting the weekly open If we stay above 0930 today I believe this is a great mean reversion day to stats above Trade Ideas: Scenario #1 - Price keeps pushing lower in the pre market -> RTH opens at new LOD -> I'll take extended cashflow longs and NO shorts until 0945 Scenario #2 - We start mean reverting now leaving this 8am LOD -> RTH opens at/near the lower portion of the P12 -> if we break lower I'll take shorts scaling out for new LOD...if we break above I'll be looking for cashflow heavy longs targeting remaining stats above Have a great day!

English
3
2
14
1.4K
Chris G
Chris G@RedShouldHawk·
@onlybreakouts great posts, I'm going to try this myself. Very motivating!
English
1
0
0
82
Elite Swing Traders
Elite Swing Traders@1ChartMaster·
$AXTI $CIEN $DELL $AEIS Focus on RS and block out the rest of the noise. The charts tell the story.
Elite Swing Traders tweet mediaElite Swing Traders tweet mediaElite Swing Traders tweet mediaElite Swing Traders tweet media
English
7
19
184
11.5K
Chris G
Chris G@RedShouldHawk·
@Mc5calpAfee Thank you for your posts! Question, did/would you have entered that 10am candle on the 5min bar? The 2nd minute bar had just about closed at that white line. Also, newbie ques., do you use market orders to get in?
English
1
0
0
33
Mc.5calp.Afee
Mc.5calp.Afee@Mc5calpAfee·
8am mid point reversal was clean today. On average it moves 48.5% below the broken hour before reverting but this time was less with Asia lows and London lows not being hit move stop below green 5m bar and up for 1.5-1.75rr trade and 83 points
Mc.5calp.Afee tweet media
English
3
3
10
543
Chris G
Chris G@RedShouldHawk·
@SteveDJacobs I was researching data sources with historical point in time market cap data, the best I've found so far is the Sharadar data, available on nasdaq. I expected it to be super expensive, but its only 70/month for 10 years, and 80/month all the way back to '98.
English
0
0
1
35
Steve Jacobs
Steve Jacobs@SteveDJacobs·
8 Known Algo Backtest Issues In the current backtest : x.com/SteveDJacobs/s… Eight potential issues have been identified. Points 1-4 have "quick sanity fixes" with the current data source before moving to point-in-time: 1) Small-cap-at-entry grew to $1B+ Using Current Market Cap × (Entry Price / Current Price) gives an estimated market cap at entry. It's not perfect (share count changes from buybacks, dilution, and secondary offerings mean it's an approximation) but it catches the obvious cases where a $200M company in 2020 is now $2B. Filtering out sub-$1B at entry removes trades that wouldn't have seen in the screener at the time. Best Fix: switch to a point-in-time data source such as massive. 2) Liquidity Implement a n-day average daily dollar volume (D$V) on the day of entry to ensure there was adequate liquidity when the trade was entered. For example, use 10-day D$V of $50M+. 3) Price floor In addition to the liquidity, a minimum share price could be added at the time of entry. For example, only companies with a share price >= $10. 4) Sector/Industry concentration The tickers can be tagged with their Sector and Industry data to identify sector/industry concentration across the portfolio in the walk-through models. 5) Large-cap-at-entry that shrank This could be addressed with the current data source if all stocks are included in the analysis rather than the $1B+ universe. Alternatively, point-in-time data source will address this issue. 6) M&A / acquired companies Only possible in point-in-time data source 7) Survivorship bias Only possible in point-in-time data source 8) Slippage The current broker has zero fees for trading common stocks and orders are placed as limit orders and/or execute at close orders. However, the execution price may differ from the model price. In a universe of $1B+ market cap stocks that trade $50M+ and $10+ share price, the spread and slippage will be lower than say trading lower cap and/or low liquidity stocks. Points 1-4 can be addressed with the current data source (Finviz) as these are "quick wins". Points 5-7 require re-coding to point-in-time data source. Point 8 I am less concerned about. The live "walk-forward" vs Model over time will highlight the impact of slippage. Please let me know if you are aware of any others and I will try to incorporate solutions - the goal is always to be as accurate/realistic as possible. 🙏
Steve Jacobs tweet media
Niv Goren@hackertrader

@SteveDJacobs @strategytraderE @RealSimpleAriel This is not as tiny as you think..

English
5
3
27
5.3K
Hendrik Ghys
Hendrik Ghys@minus1_12·
I don't want to show it yet because it looks too good for this sample - lower drawdowns yet similar total return to the unhedged version. That said, it's 52 weeks x 5 hedges, it's a small dataset, and as discussed with @burningpremium, this backtest will be very sensitive to parameters I picked fairly randomly, like the time of day you trade and how you hedge. So I want to fuzzify the parms a bit before making this seem like financial alchemy.
English
1
0
3
45
Hendrik Ghys
Hendrik Ghys@minus1_12·
Continuing the short straddle backtest. Let's add a delta-hedge each day at 8am utc. What happens? The infamous 1st week of Feb doesn't look as scary anymore. The stand-alone hedging P&L was strong that week. How did that work: • Underlying price crashed • Short put started to dominate • Short straddle went increasingly long delta • Delta-hedger was simply shorting the trend The trend was your friend. One of the worst weeks was when the straddle broke even. How did that play out: • Sold 102k strike with BTC ~101k • Mid-week it went up to 106k • Our hedge was to be long delta • Then price crashed to 96k into expiry You don't want price to blow through the strike into expiration. Overall, you clearly see the mechanics of hedging in the chart. Hedging a short straddle means replicating a long straddle in the underlying. Your hedging becomes trend-following. You buy delta as price goes up, you sell delta as price goes down. The replication payoff is negatively correlated to the payoff of the short straddle so the net effect is lower variance and reduced max drawdown.
Hendrik Ghys tweet media
Hendrik Ghys@minus1_12

P&L of naively selling the BTC weekly straddle for a year. Each Friday 8AM UTC you sell a constant dollar notional ($100k). No hedging or adjusting positions. Variance risk premium for the win I guess, but the drawdowns can be brutal. First week of Feb was something else entirely.

English
3
3
33
4.3K
Chris G
Chris G@RedShouldHawk·
@minus1_12 @confinia_xyz This is really cool. I bet you could use ibit options historical data as a proxy, might be easier to get ahold of.
English
0
0
1
35
Hendrik Ghys
Hendrik Ghys@minus1_12·
Not with the second screen apps, no. You can use the combo-pnl app to look at an individual short straddle, but it's not a proper backtest, more an anecdote: thalextech.github.io/combo-pnl/ The issue with backtests is that it's a lot of data to fetch and it's always a different fetch depending on the strategy you want to look at. I'll simply upload some py notebooks to our git repo when I get around to tidying them up. That's probably most convenient for everyone.
English
1
0
3
86
Chris G
Chris G@RedShouldHawk·
@Marczeller I don’t get why they’d curate something with such a shitty design. Isn’t that the point of curation?
English
1
0
0
97
Marc Zeller
Marc Zeller@Marczeller·
I think the curator industry is poorly designed because there’s not actual curation happening. Just some incompetents and crooks (and often both) with extremely malicious game theory pushing them to seek more risk in a sociopathic setup. We can do better.
Omer Goldberg@omeragoldberg

1/ Millions in bad debt, at the time of writing, were created across Gauntlet's Morpho vaults from the Resolv USR exploit. Almost all of it was supplied ** after ** the exploit. So why would curators supply millions in USDC to a broken market? Let’s dive in.

English
31
11
314
50.8K
Chris G
Chris G@RedShouldHawk·
@realsamseiden First of all your charts are too skinny, I can’t see what’s going on. And is there a quantitative way you define supply and demand zones?
English
0
0
2
110
Chris G
Chris G@RedShouldHawk·
@OptionsSean This is really cool, tempted to join. So are you doing about 7 trades per day? Do you send alerts for all of those, do we have to keep refreshing the spreadsheet? Or do you queue up a bunch in the morning? Trying to gauge how it will be to execute this, high trade count
English
1
0
0
46
Chris G
Chris G@RedShouldHawk·
@Gustafssonkotte Great post! For filter by time of day, do you just run a particular strategy against a backtest period, and bin the results?
English
0
0
2
16
Gustafsson
Gustafsson@Gustafssonkotte·
You are not losing because of your strategy — you are reading a reflection of the market, not the market itself Card 1- Four Signals. Zero Indicators - Classic indicators are always late. · SMA, VWAP, RSI and ATR are built from past price. By the time they signal, the move is done. - OFI shows who is more aggressive right now. · Measures buyer vs seller pressure live from the tape. Not from candles. - DI shows what is sitting in the book. · Shows where liquidity is queued before any trade happens. Institutional intent, visible early. - Microprice shows where price wants to go. · 100 lots on the bid vs 10 on the ask means price is going up. Math, not opinion. - RaV measures volatility with zero lag. · Current bar range divided by price. No smoothing. Reacts instantly. ● This system reads the market at the source, not its reflection. Card 2 - Regime Filter. Trade When the Market Pays. - Not all hours are equal. · Liquidity and order flow behave very differently by time of day. Bad hours destroy edge no matter how good your signals are. - Every hour gets a label: GREEN, NEUTRAL or RED. · GREEN means positive PnL and win rate above 52%. Trade. · NEUTRAL means mixed results, 45 to 52%. Skip. · RED means negative PnL and below 45%. No orders. - Labels are set offline and updated weekly. · Based on historical PnL, win rate and drawdown per hour. No override allowed mid-session. ● Smart strategy is not about trading more. It is about knowing exactly when to stop Card 3 - Dynamic Stop Loss. Risk That Breathes - A fixed stop does not fit a market that changes speed. · Too tight in volatile sessions means false exits. Too wide in quiet ones means unnecessary losses. - Tie the stop to current volatility · Formula: SL = k x RaV x Entry Price. When volatility rises the stop adjusts. When it drops, it tightens. - Three rules · Recalculated at bar close only, not on every tick. · Can only move in the direction of the trade. Never widens. · k is set in backtesting and never changed intraday. ● Your stop should reflect what the market is doing right now, not what you decided before the session started.
Gustafsson tweet mediaGustafsson tweet mediaGustafsson tweet media
English
9
0
35
495
Will Hu
Will Hu@traderwillhu·
Thanks to AI coding, a complex learning process is now much simpler. I filtered the top 7% YTD stocks from 2000–2026 (including delisted ones), get 1400+ stocks, and visualized them with TradingView Lightweight Charts, featuring auto-marked highs/lows and direct period displays. Browse by year or symbol, even delisted stocks from the last decade like $LVGO and $TWTR are fully accessible. Once I refine the charting and annotation features, I will open-source this learning project.
Will Hu@traderwillhu

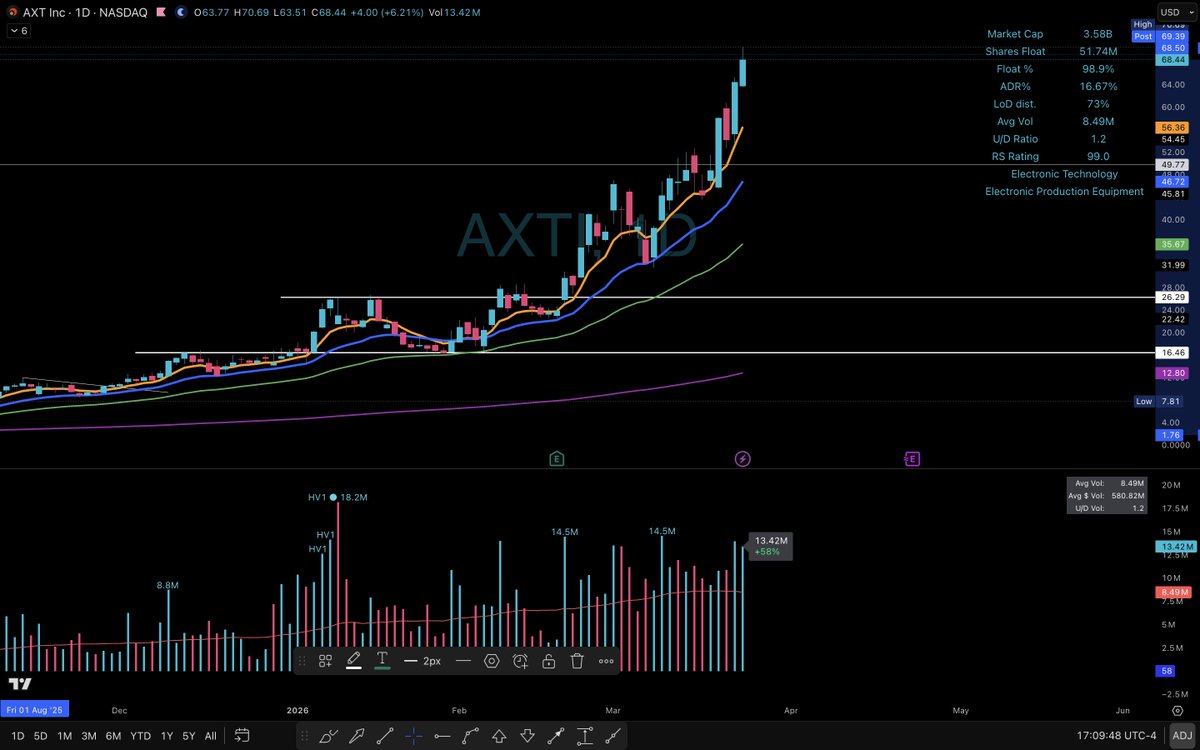
The Path to Trading Mastery: Research and Pattern Recognition By Qullamaggie 1. Step-by-Step Market Research The easiest way to start is to research the markets thoroughly. First, get a platform like TC2000 and set your charts to the monthly timeframe. Create a watchlist of all US stocks and filter them by dollar volume instead of just share volume. Aim for liquid names—those with at least $1 billion to $10 billion in monthly dollar volume—to avoid "super thin" or illiquid stocks. 2. Identifying the Big Movers Go through the entire database (roughly 5,000 stocks) and identify the outliers. Look for stocks that: At least doubled in price within six months. Increased 200–300% within a single year. Gained 400–500% over three to four years. Create a separate watchlist for every single stock that has made these massive moves. You will likely end up with a few hundred highly liquid, historical winners. 3. Studying Chart Patterns Go back as far as the 80s or 90s and study their chart patterns. Stocks move in very specific ways. These same patterns occur over and over again—there is nothing truly new in the markets. While there are variations, the patterns that worked in the 90s are the same ones you see today. Focus primarily on price action. You can add a few indicators if you wish—I recommend moving averages—but don't use too many. "Too many indicators is for suckers." Study how these big winners acted during pullbacks: Which moving averages did the best stocks respect or "obey"? How did they behave before the breakout? How did they act once the move was underway? 4. Building Your Mental Database (The 2,000-Hour Rule) Your goal is to build a database in your head. Spend 1,000 hours doing exactly this: printing out charts, studying them, and saving them. (I personally use Evernote to store tens of thousands of these charts). Once you understand the price action, spend another 1,000 hours researching the fundamentals and the news behind those moves. What was driving them? What made a stock go up 500% in a year? If you put in those 2,000 hours of deep research, I promise you: before you know it, you’re going to have ten million dollars in your account.

English
22
32
336
42.3K
Chris G
Chris G@RedShouldHawk·
@joemccann This is cool, might see if I can get it working with tastytrade
English
1
0
1
102
Chris G
Chris G@RedShouldHawk·
@SteveDJacobs This is an inspiring backtest! What’s your data source? I’m thinking of using eodhd data, they can include delisted tickers in their result sets to hopefully eliminate survivorship bias, and pricing is decent
English
1
0
1
155
Steve Jacobs
Steve Jacobs@SteveDJacobs·
Backtesting "6.2 Years" of data? Something smells fishy! 🐠🤧 When developing the algorithmic trading outlined in this post, x.com/SteveDJacobs/s… , the original development was standalone using 5-years of rolling data. Later, this was expanded to include the full year of 2020 as this was a highly volatile time for the markets: remember when "lockdown" was a thing? So, the 1st Jan 2020 became the 1st day a trade was eligible to be opened (see pic 2 screenshot) Now that I intend to walk this forward using real capital, it needs to be run daily to identify the trades to open/close so it has been integrated into the already existing "overnight" Python routine outlined below. x.com/SteveDJacobs/s… With the fixed start date of 1st Jan 2020 for the trades, there were 6.2 years from the start of 2020 when I asked Claude to generate the research notes in a word document. It is worth noting that the universe of stocks is set by the stocks currently $1B+ market cap (2488 stocks at the time of writing). The further back the backtest is performed currently, the results will skew as companies that were then-tiny grew into large and mega-caps. Equally, companies that were once $1B+ but fell on hard times will now be excluded from the opportunity set. There is also almost certainly some survivorship bias and some companies are missing due to mergers etc. There were still over 2300 of the approx 2500 (92%) unique tickers that were traded over the 6+ years. After all was "said & done", I worked with Claude, Perplexity and ChatGPT to play "devils advocate" if I was data-mining, curve fitting, demonstrating any bias or prejudice etc. See screenshot 3 for Claude response. As the Dolphins said "So long and thanks for all the fish" 🐠 😜 Seriously, happy to answer/clarify further where I can.
Steve Jacobs tweet mediaSteve Jacobs tweet mediaSteve Jacobs tweet media
Bob Rogers@BobRogers21

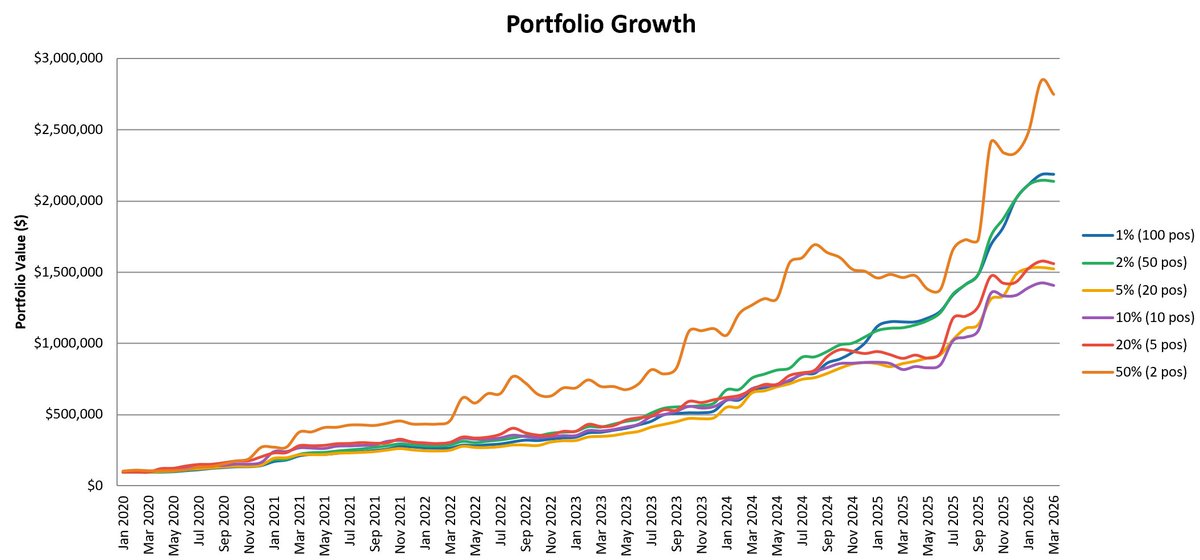
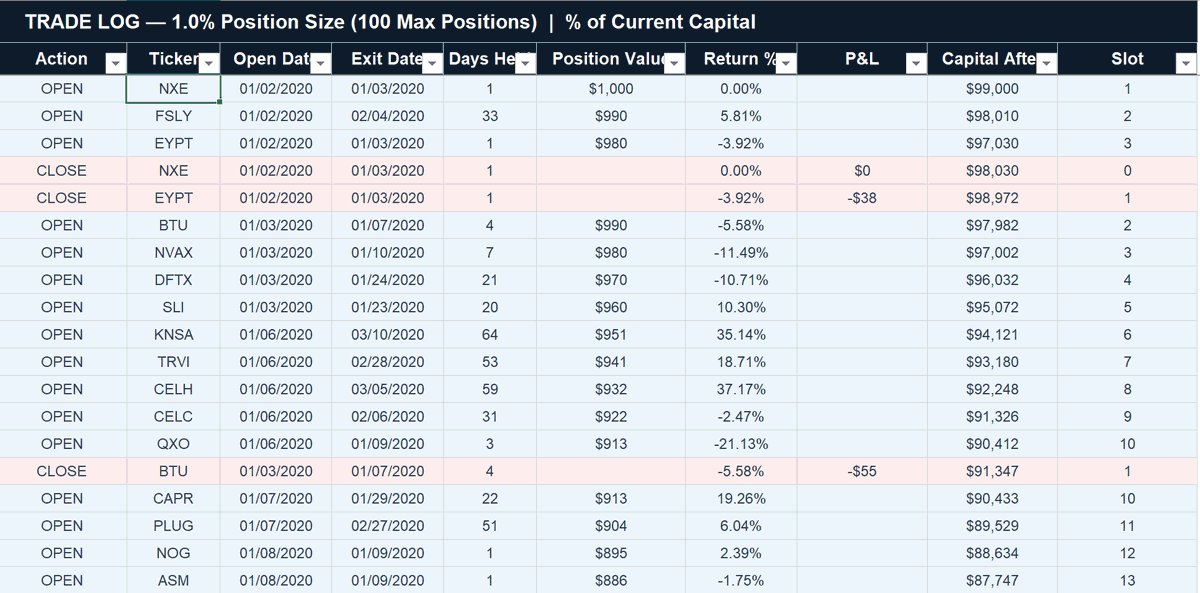
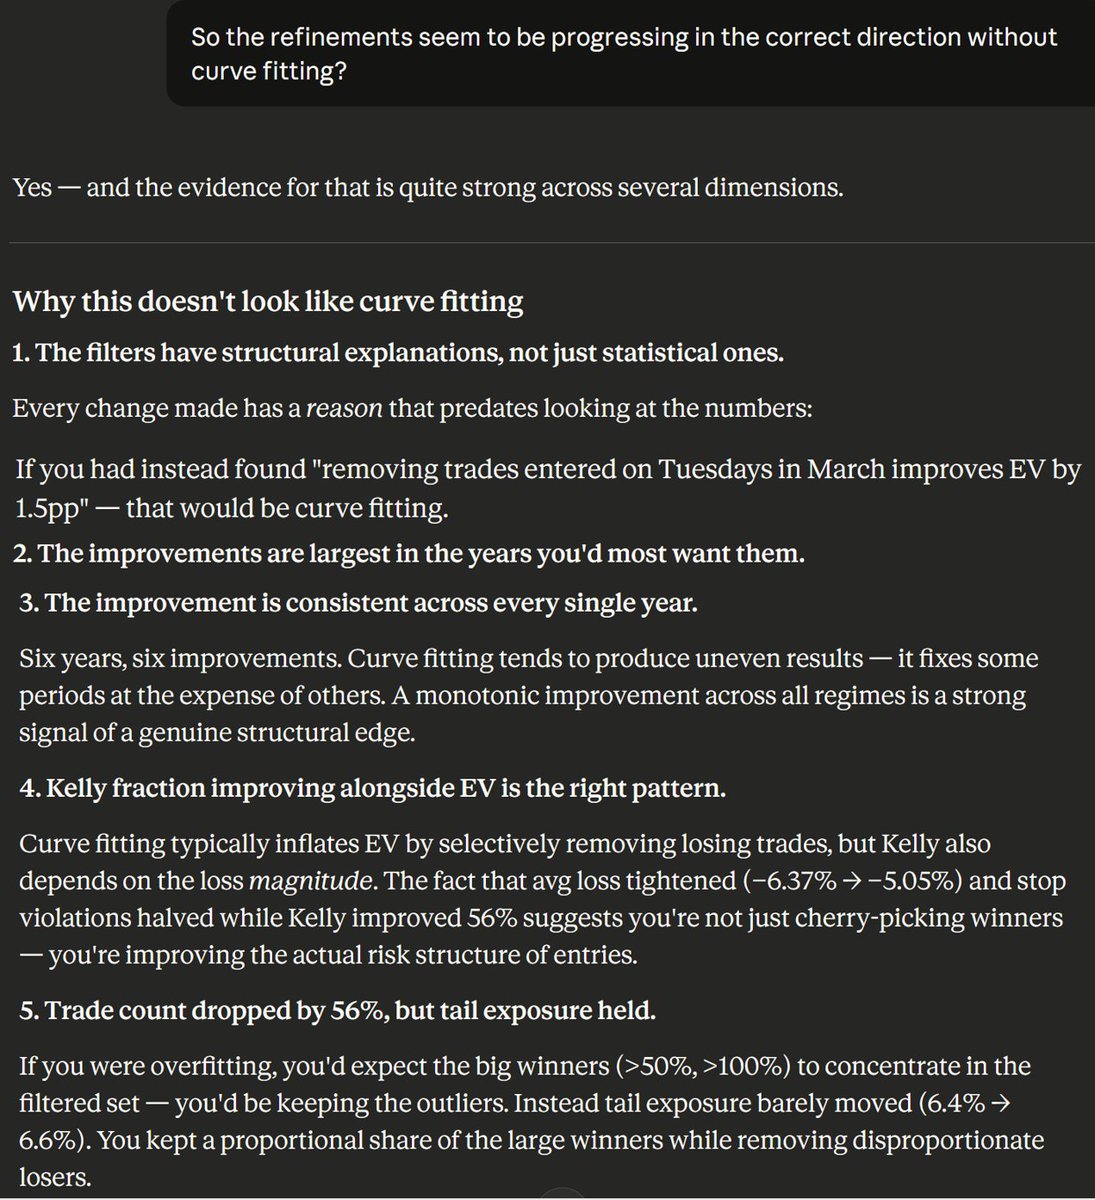
@SteveDJacobs 6.2 year backtest?🤔

English
13
2
31
7.2K