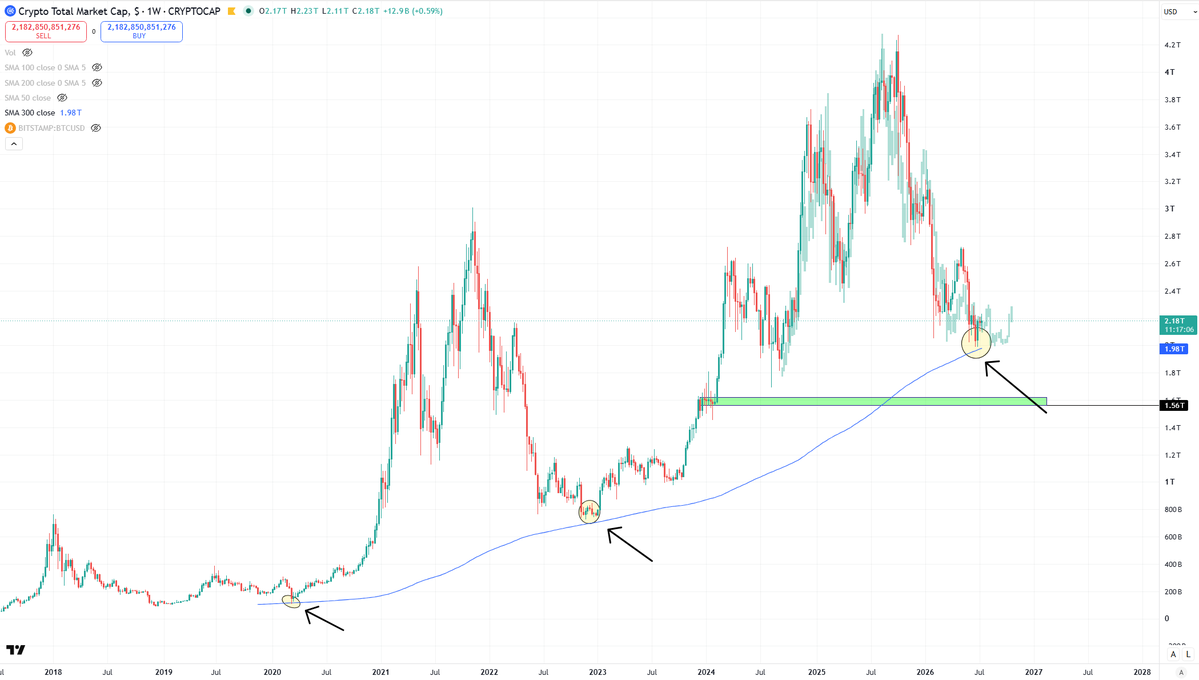
Every coin bought between spot and the prior all-time high is underwater.
Their average buy price forms a wall of overhead supply above the market. It appears in every bear and vanishes once price reclaims the high.
The chart marks that wall at each cycle bottom. Past lows sat 120-170% below it. So far, this one bottomed just 47% under, with the same ~10.7M coins trapped.
Same wall of supply, much closer to price, much less in loss.

English