@CryptosBatman Well, i guess im Buffet now
Been holding my meme coin, down -99% since 2024
Diamond hands.
English
Crypto Anbu
6.3K posts

@CryptoAnbu_
Trading From The Shadows 🥷 | Crypto Analyst With a Macro Lens 🔎 | My Posts Are Not Financial Advice, So DYOR! 📝


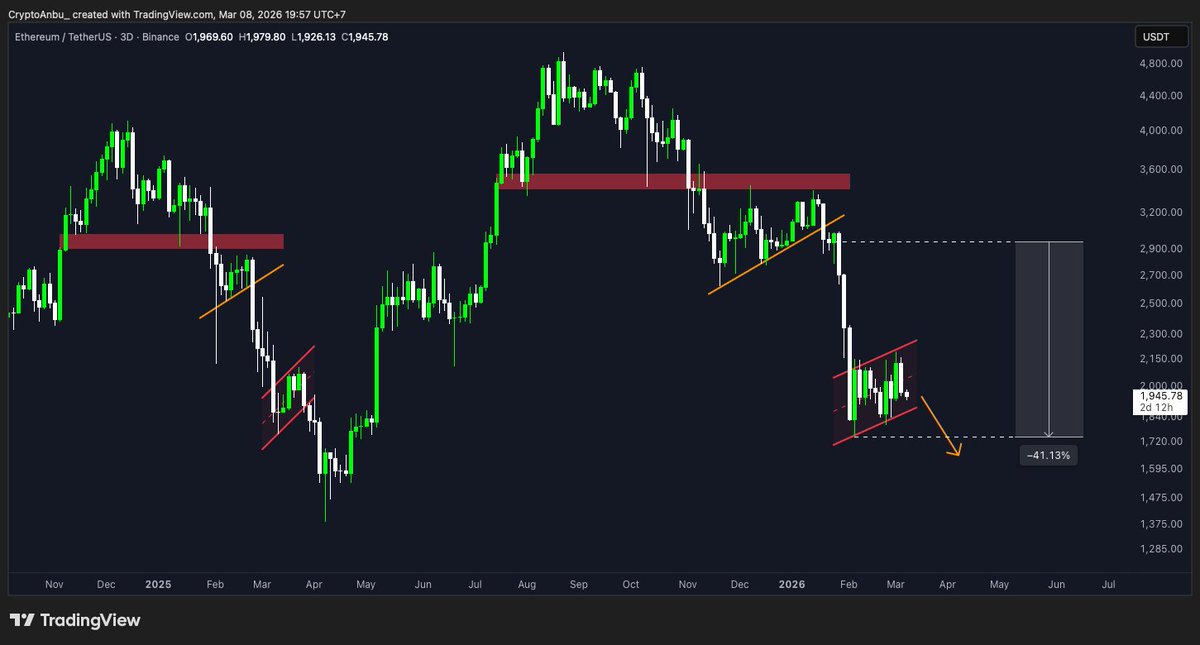
Yes, we should worried about Ethereum. It’s showing the exact same structure that played out before a -50% crash. Don’t stay in denial, this setup on $ETH looks no different.


JUST IN: 🇺🇸 President Trump imposes 10% global tariff on all countries and says all tariffs will remain in place, despite Supreme Court ruling.
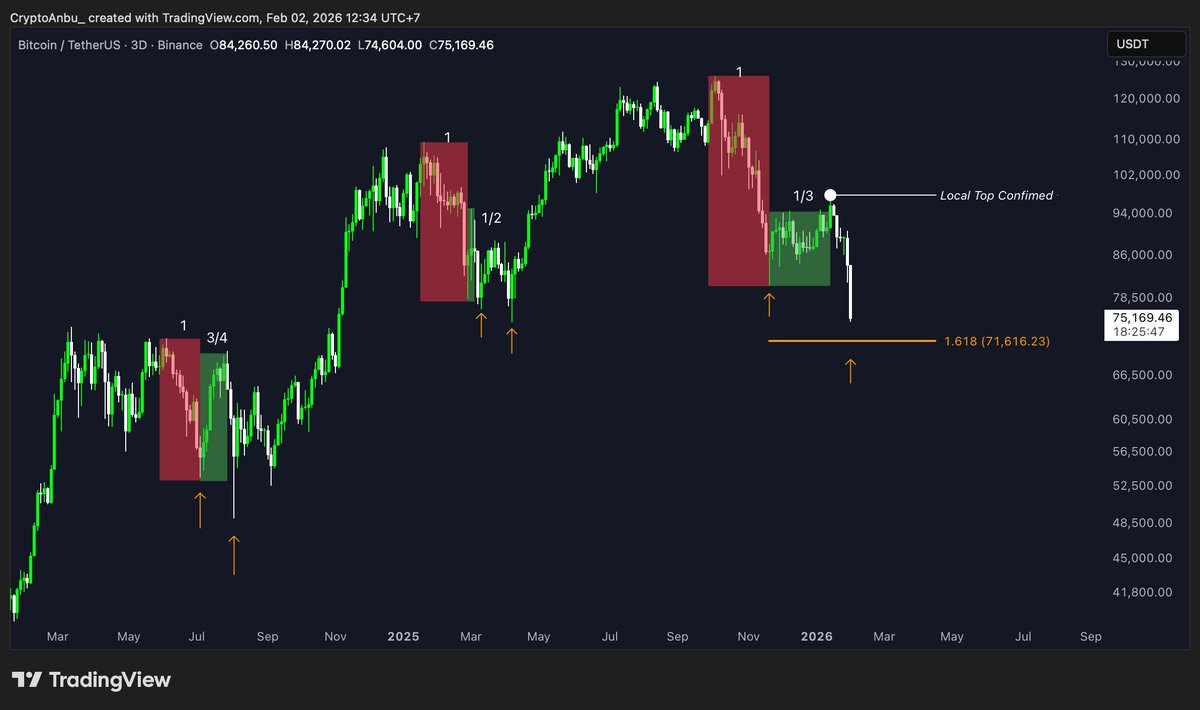
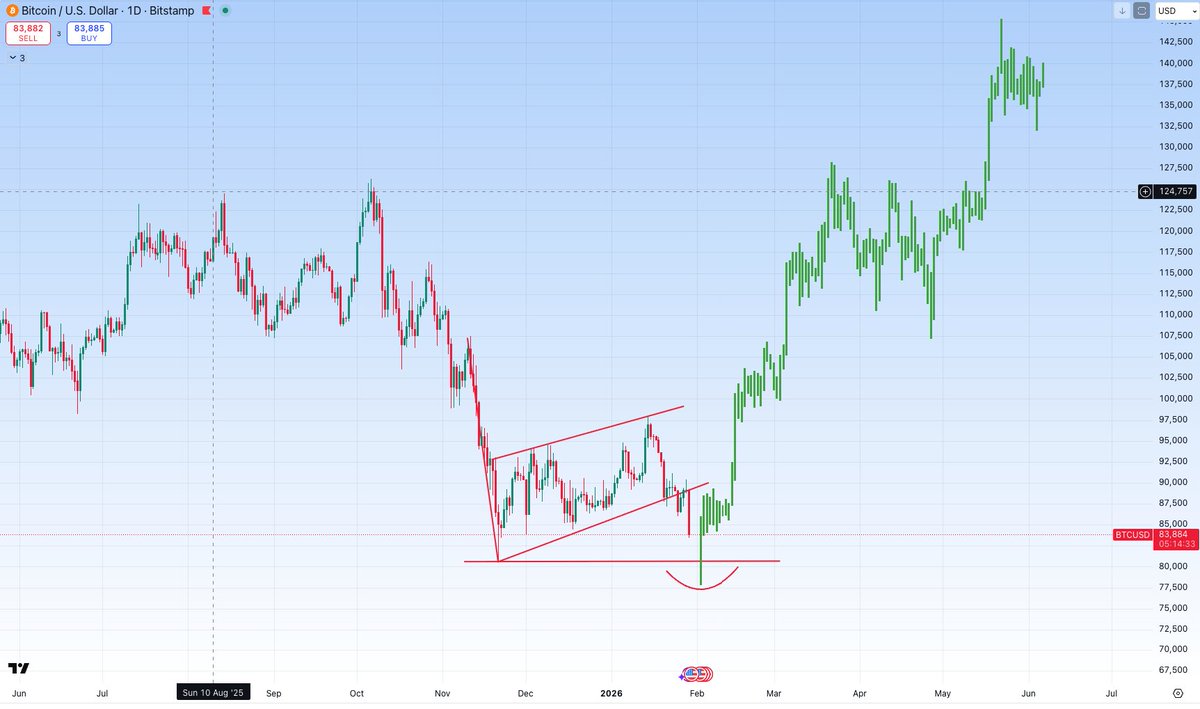
A deep dive on Bitcoin's price structure. If you’ve been following my recent $BTC updates, you can tell that my bias has been leaning bearish. More accurately, it’s not “bearish forever,” but I do believe that sooner or later Bitcoin will still print a new low before it can properly kick off the next leg higher. Can it go straight up from here? Sure, it’s possible, but in my view, it’s unlikely. Here are the key points I’m watching: - The Drop vs The Rebound You always have to measure the size of the rebound against the size of the dump. If the selloff is big, but the bounce is small, it tells you that the downside wasn’t met with equal buying interest. That usually means either there’s no one eager to absorb the sell pressure, or people are simply too pessimistic to buy the dip. We could see that in past bottoms, the rebound is much more equal relative to the drop. That shows how the market is optimistic in buying the dip, hence pushing the prices to a newer high much quicker. - Lower low structure It’s very rare for a sharp dump to get fully absorbed and then price just teleports back to the previous high. Historically, Bitcoin’s major bottoms tend to form with a fresh lower low, at a point where most people have already given up on the idea. Right now, $BTC has already dropped a lot, but the rebound so far doesn’t match the magnitude of the move down, in fact, it is the weakest rebound we've seen since the bull run started. That’s why I’m still skeptical in the short term, but I still believe we’ll see a new ATH sometime in 2026.

A deep dive on Bitcoin's price structure. If you’ve been following my recent $BTC updates, you can tell that my bias has been leaning bearish. More accurately, it’s not “bearish forever,” but I do believe that sooner or later Bitcoin will still print a new low before it can properly kick off the next leg higher. Can it go straight up from here? Sure, it’s possible, but in my view, it’s unlikely. Here are the key points I’m watching: - The Drop vs The Rebound You always have to measure the size of the rebound against the size of the dump. If the selloff is big, but the bounce is small, it tells you that the downside wasn’t met with equal buying interest. That usually means either there’s no one eager to absorb the sell pressure, or people are simply too pessimistic to buy the dip. We could see that in past bottoms, the rebound is much more equal relative to the drop. That shows how the market is optimistic in buying the dip, hence pushing the prices to a newer high much quicker. - Lower low structure It’s very rare for a sharp dump to get fully absorbed and then price just teleports back to the previous high. Historically, Bitcoin’s major bottoms tend to form with a fresh lower low, at a point where most people have already given up on the idea. Right now, $BTC has already dropped a lot, but the rebound so far doesn’t match the magnitude of the move down, in fact, it is the weakest rebound we've seen since the bull run started. That’s why I’m still skeptical in the short term, but I still believe we’ll see a new ATH sometime in 2026.

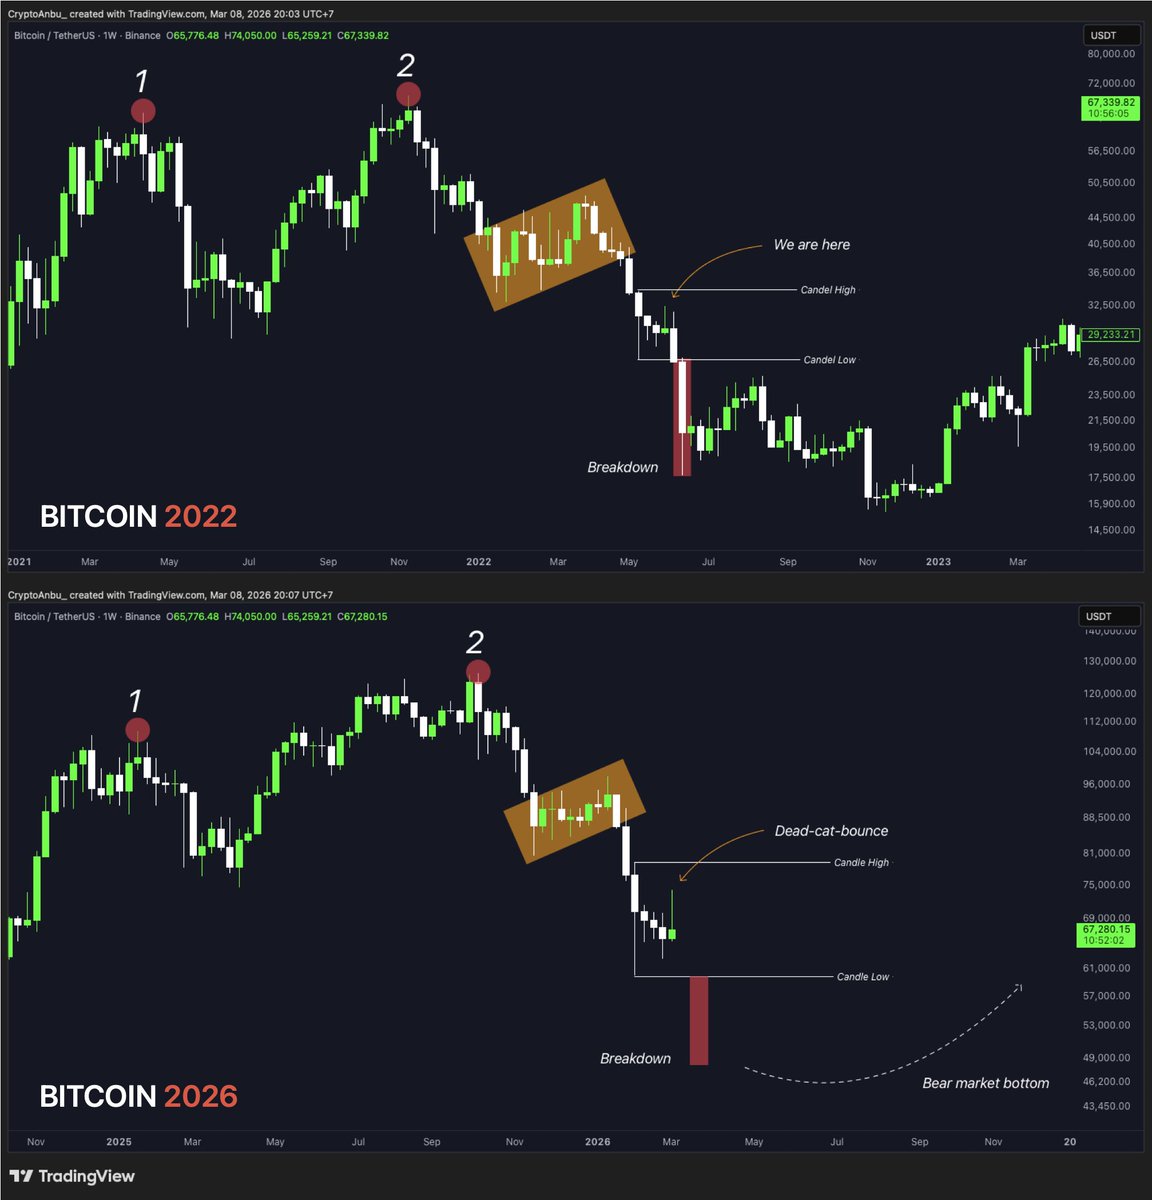
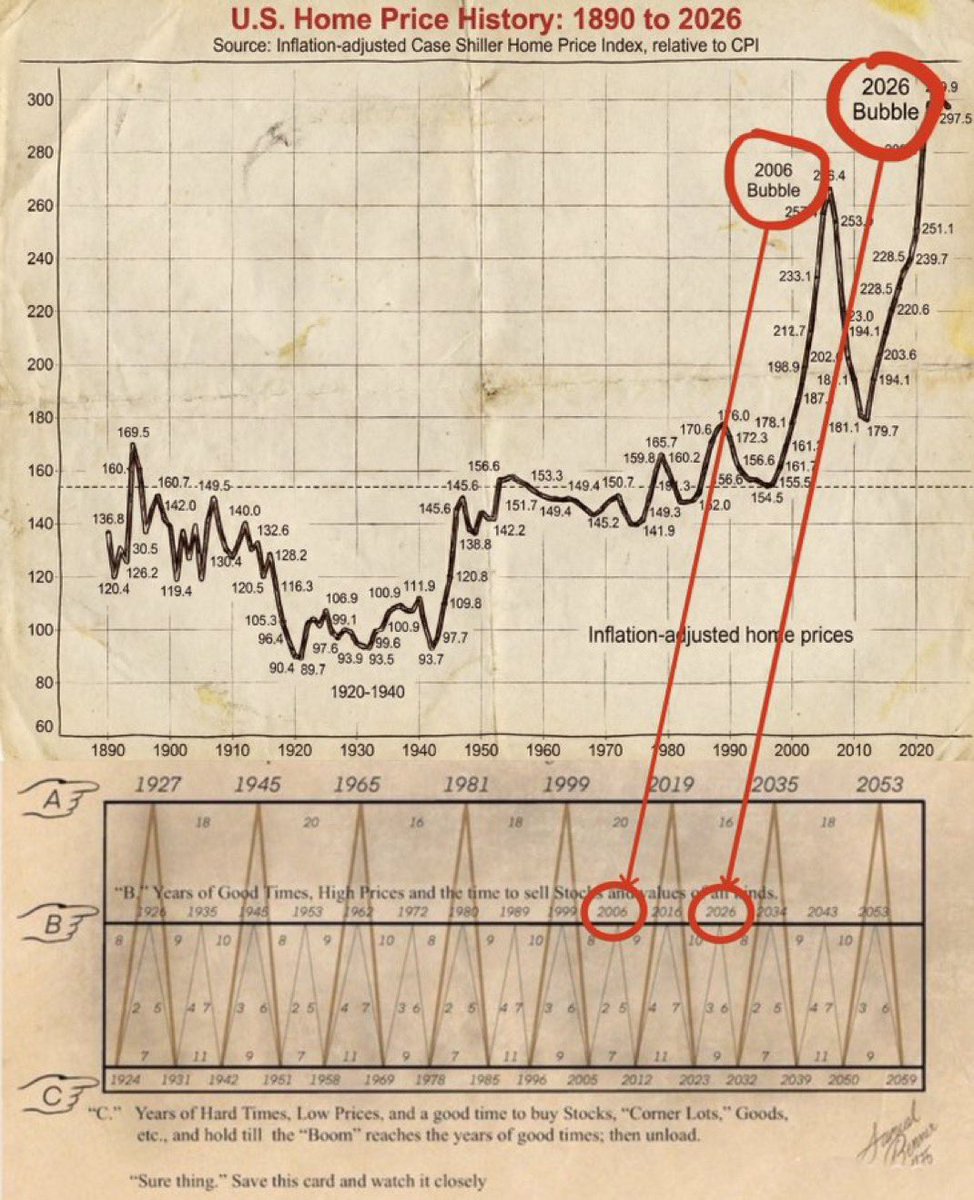
There is nothing new under the sun. Every human experience, event, and innovation is cyclical and repetitive. The same goes for financial markets and price structures. Here’s a closer look at $BTC and how its last cycle top was formed: In the last cycle, extreme price volatility, both up and down, created a massive sideways range. That’s what formed the two massive tops. Funny enough, that’s exactly what we’re seeing now with Bitcoin, with the $125K high in October acting as the second top. The final trigger that started the bear market was price nearing the 50% level of that range, backed by a clean bear flag. And once again, that’s exactly what we’re seeing now. Now, all my recent posts have been leaning bearish. Not because I’m a hater, but because what’s happened before often becomes the roadmap ahead.

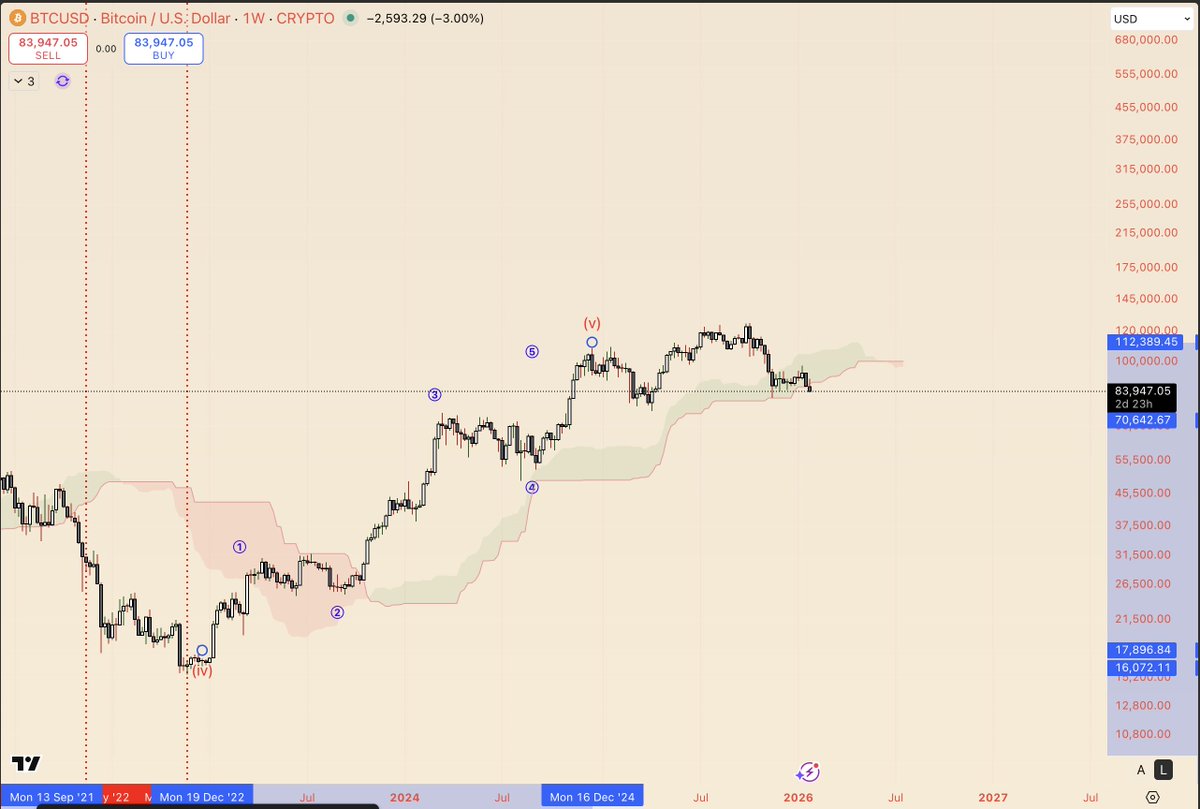
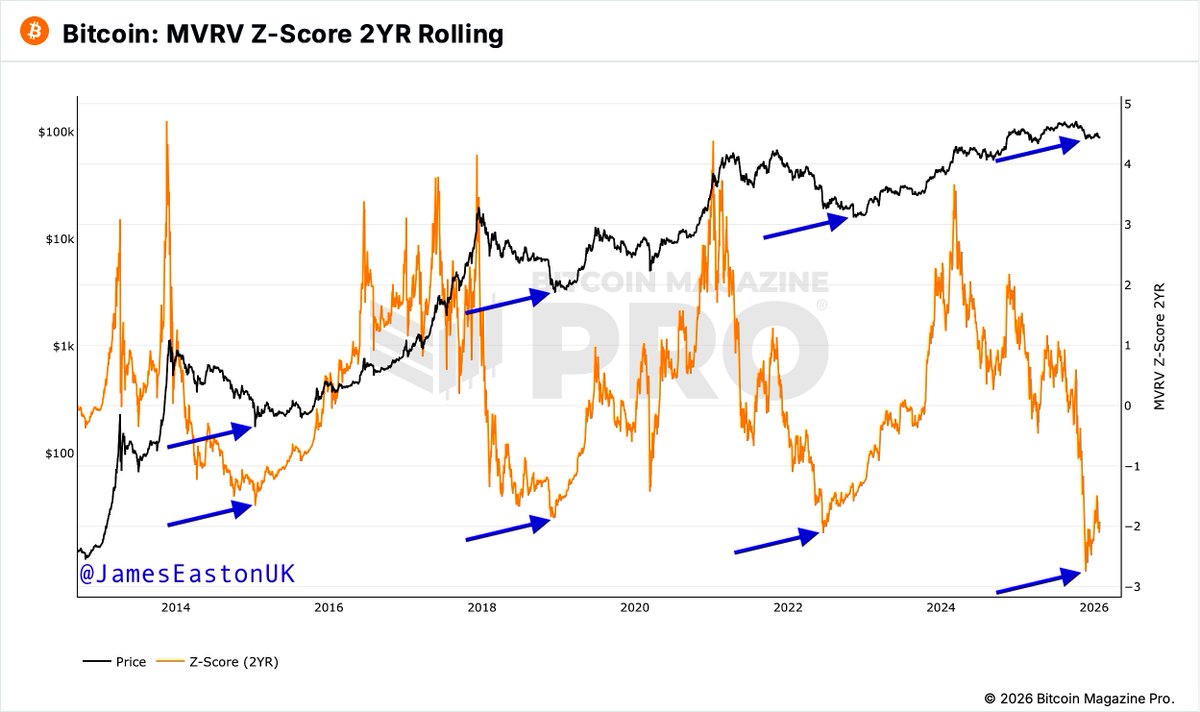
#BTC, I was waiting to update on this for past 7 months. Weekly Kumo twist(blue arrows) occured on clouds and price has started moving outside of bearish(red) clouds. Last time this occured in 2014,2017,2020 bull runs. BTC must have your full attention now.

There is nothing new under the sun. Every human experience, event, and innovation is cyclical and repetitive. The same goes for financial markets and price structures. Here’s a closer look at $BTC and how its last cycle top was formed: In the last cycle, extreme price volatility, both up and down, created a massive sideways range. That’s what formed the two massive tops. Funny enough, that’s exactly what we’re seeing now with Bitcoin, with the $125K high in October acting as the second top. The final trigger that started the bear market was price nearing the 50% level of that range, backed by a clean bear flag. And once again, that’s exactly what we’re seeing now. Now, all my recent posts have been leaning bearish. Not because I’m a hater, but because what’s happened before often becomes the roadmap ahead.

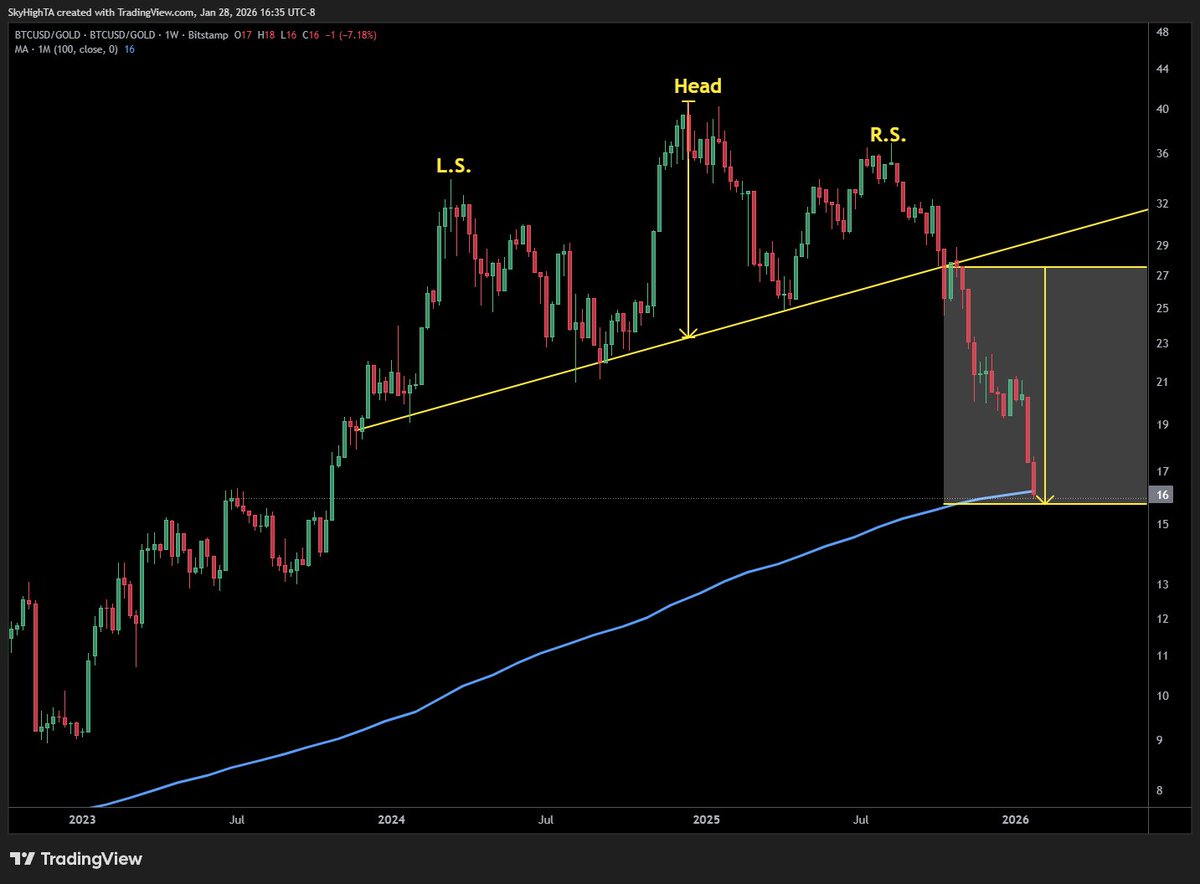
The average bitcoin bear market is 14 months on a monthly closing basis vs gold.
There is nothing new under the sun. Every human experience, event, and innovation is cyclical and repetitive. The same goes for financial markets and price structures. Here’s a closer look at $BTC and how its last cycle top was formed: In the last cycle, extreme price volatility, both up and down, created a massive sideways range. That’s what formed the two massive tops. Funny enough, that’s exactly what we’re seeing now with Bitcoin, with the $125K high in October acting as the second top. The final trigger that started the bear market was price nearing the 50% level of that range, backed by a clean bear flag. And once again, that’s exactly what we’re seeing now. Now, all my recent posts have been leaning bearish. Not because I’m a hater, but because what’s happened before often becomes the roadmap ahead.


#ALT Dominance vs #BTC Dominance is attempting to break the wave as monthly Bullish momentum is returning after being absent 44 of the last 45 months A multi-year bull market for Altcoins against Bitcoin is favorable to begin if this confirms on the next monthly close: