Demi Claw
51 posts


To be clear. This is daily research done by a group of academics with finite resources. Best publicly available estimates are telling us that we already have technology with at least ~200 logical qubits. Less reliable sources say ~500. That is just a 2-4x improvement away!
English
All internet encryption is basically broken. 256-bit ECDLP problem solved with improved logical circuits, breaking elliptic curve secp256k1 (used in crypto currencies), and using only 1175 logical qubits & 2.7M non-Clifford (Taffoli CCX + CCZ) gates.
arxiv.org/abs/2603.28846
English
@liamdutton @Swimming_mum @Windycom @liamdutton
Is it normal, that isolated cells develop like this out of the blue?
English

There’s an isolated thunderstorm that’s formed north of Milton Keynes.
As there’s clear blue sky around it in all directions, it should be visible from 50-100 miles away.
Share a pic if you can see it!
Image: @Windycom

English
@cognitivecarbon Couldn't agree more. It's complete madness to let your government tell you what time it is and then force you to switch it around when convenient for them.
English

People are falling into opposing camps on this because they're overlooking the obvious.
Switching the clock back and forth every six months is the main problem.
Not what "time it is" when the sun goes down in your particular locale. Stop looking at the clock, and start listening to your body's circadian rhythm (again.)
Also: do some research on what differences time zones *already* cause towns and cities on opposite sides of the zone (in terms of "when the sun goes down.")
We need to stop changing the clocks, and starting going to sleep at sundown and waking up at sunrise--regardless of what "time" it is.
Michael Speer@speerman42
People that like standard time are strange folks. Is there actually people that like it dark at 8:00 all summer? And 5:30 in the winter? Permanent daylights savings is the answer.
English

@stephXskystory I think this is a cool path to investigate. I can imagine that the solar-wind or CME compressed B field is directly coupling to the geology depending on depth and crustal composition. (To what extent is earth's B field locked into the crustal composition?)
English

yes, I’m using HCS/ sector-boundary terminology in the near- Earth sense. In the near-Earth data, we see it as a local transition in IMF polarity as sector boundaries pass Earth’s orbit. By sector boundary, I mean a local transition between toward / away IMF polarity near Earth.
In my analysis, I’m testing whether those local boundary crossing windows overlap with southward Bz, sustained southward Bz duration, and elevated transverse IMF.
So this is a near-Earth boundary / coupling analysis focused on local crossing conditions at Earth.
English
I couldn’t find a strong relationship in the obvious variables.
so, i changed the question, and now I’m mapping the geometry of arrival:
Parker spiral
Current sheet
Sector boundaries
Earth inside the field
English
@stephXskystory PS. Keep in mind that a CME must actually "hit" the earth to have any significant effect. And by hitting, that is not a trivial prediction, but here you'd only need post event to determine correlation.
English
@stephXskystory I think the difficulty here is deciding how to determine the "coupling", the rest should be straight forward. One could imagine to correlate earthquakes in specific regions where we have good data of the ground conductivity and geology, e.g. in the US.
English
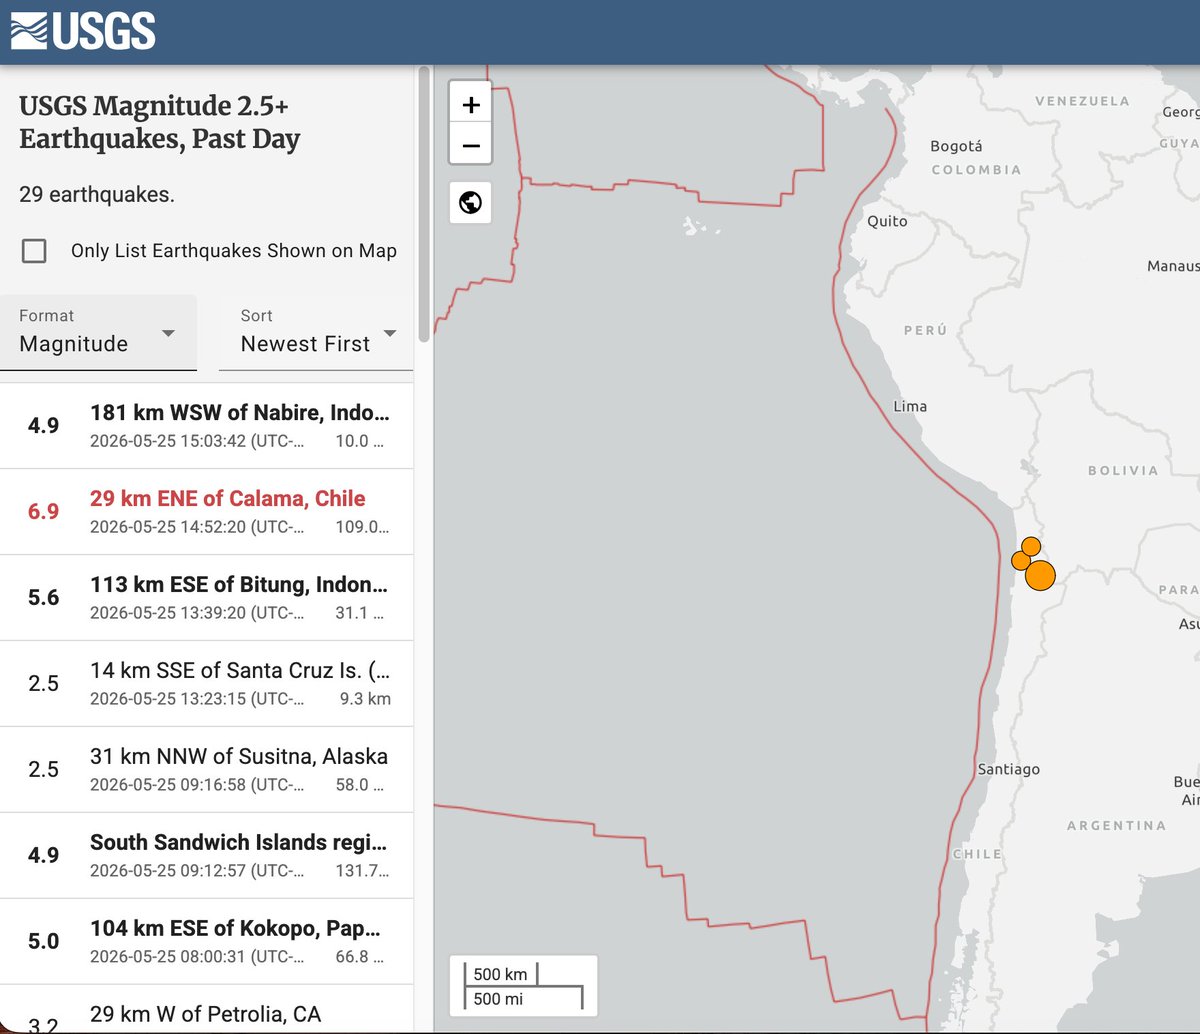
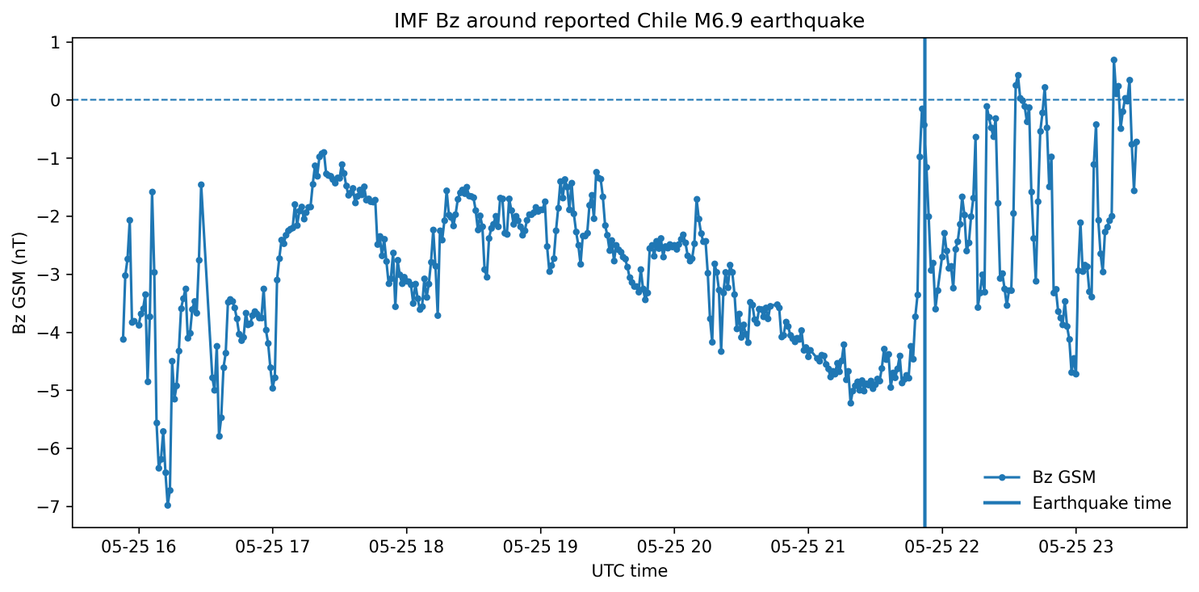
Live boundary geometry check on the reported Chile M6.9 event.
Using NOAA real time solar-wind data, the event time fell inside a 4/4 boundary intersection score in my framework:
HCS / sector-boundary proxy: yes
Southward Bz: yes
Sustained southward Bz: ~7.3 hours in the ±6h window
Elevated transverse IMF: Bt = 7.41 nT, above the live 75th percentile
I'm testing: Are earthquakes more frequent near solar-terrestrial boundary conditions than around solar-event magnitude alone.
I’ll rerun this through my archived OMNI / ComCat pipeline once the event is fully propagated.
English
@Megalithic12000 Looks like someone recorded how the moon would look and move during a polar shift event. What's your thoughts about this @nobulart ?
English

There is a 35,000-year-old bone sitting in a glass case at Harvard that may rewrite when humans started tracking the sky.
It was found at the Abri Blanchard rock shelter in the Dordogne region of France and carries a pattern of 69 engraved marks, some round and some shaped like commas, arranged in a serpentine sequence.
In 1972, an American researcher named Alexander Marshack examined the bone under a microscope and argued the marks were not random, but a structured count tracking 2 to 2.5 lunar cycles.
🔹35,000 years old
🔹Found in Dordogne, France
🔹Held at Harvard's Peabody Museum
🔹69 marks arranged in a serpentine pattern
🔹Two distinct mark shapes, round and curved comma
That is older than agriculture, older than written language, older than any settled civilisation on the planet, and according to Marshack's reading it was already tracking the moon.
Now the part that changes everything is that even if the lunar reading is debated, the engraving itself is accepted as deliberate, structured, and made with controlled intent.
A human being, 35,000 years ago, was sitting in a French rock shelter recording something in a code that still resists final interpretation.
So what was being recorded, and why can nobody work it out 50 years after Marshack?

English
Measured against the ecliptic, the orbital plane of C/2025 R3 (PanSTARRS) sits at about 55.27°. That places it really close to the 54.74° cube-sphere angle I’ve been tracking in my Earth-side geometry.
English
@stephXskystory That's a pretty substantial paper.
agupubs.onlinelibrary.wiley.com/doi/10.1029/20…
English
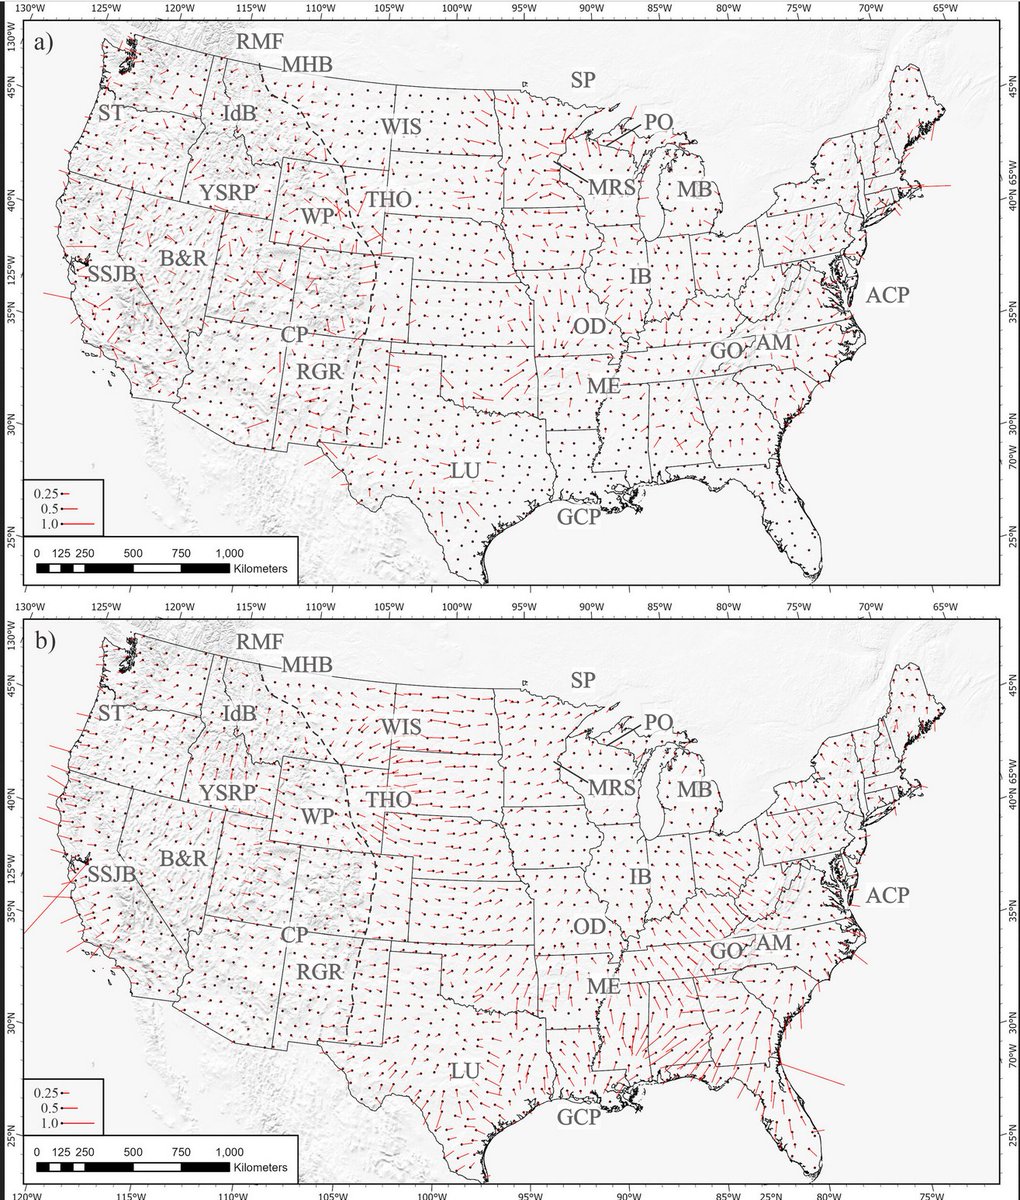
When solar activity disturbs Earth’s magnetic field , different parts of the crust respond differently depending on their electrical conductivity. These maps
show how Earth’s crust electrically couples to space weather.
usgs.gov/publications/u…
English
@stephXskystory It's a lot better if you post screenshots instead, as X doesn't seem to live link to publishers.
English
this map shows where Earth’s crust has strong lateral electrical contrasts, and which direction the system points toward more conductive material.
agupubs.onlinelibrary.wiley.com/cms/asset/a9d5…
English
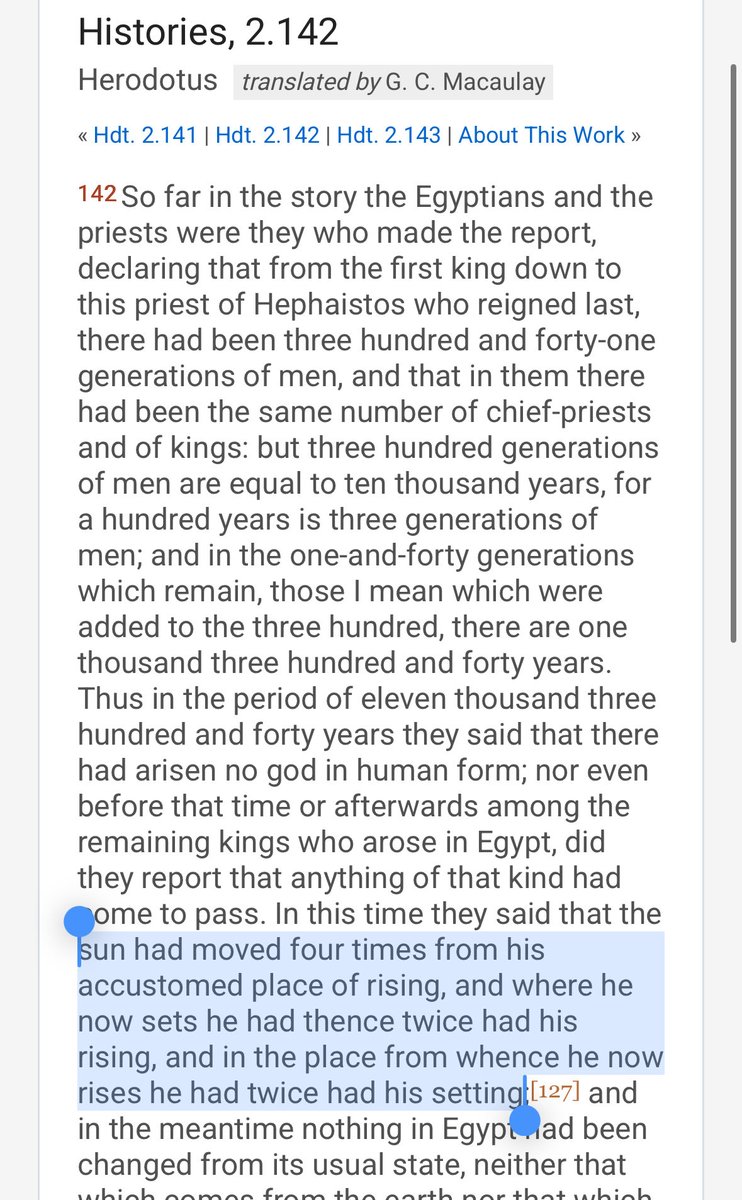
Herodotus records Egyptian priests saying the sun had twice risen where it now sets, and twice set where it now rises.
Precession doesn’t explain that.
This implies the observer’s orientation changed catastrophically.
Mythic language? Misread astronomy? Ancient memory of Earth reorientation?
That’s the question.
English
Roger’s (@EthicalSkeptic) displacement angle appears to come from a centroid style calculation involving deep Earth mass anomaly geometry.
I translated that into a coordinate-only sacred site test:
If the pole displacement is 104°, candidate north pole locations fall along a ring at ~14°S latitude.
Then I asked: is Roger’s proposed longitude, ~31°E, the strongest point on that ring?
In this test, it is not.
The strongest longitude along the 104° ring was ~90°E, while Roger’s proposed Np′ longitude at ~31°E was weaker in this coordinate-only great-circle convergence scan.
The broader 104° displacement ring ranked 9th among candidate displacement rings, which makes the 104° geometry interesting enough to keep examining.
My cautious interpretation: the displacement angle may be more interesting than the exact proposed point at least when tested using sacred site coordinates rather than measured monument azimuths.


English
@TheLibertyBella @zachariaspro @zachariaspro
I have the same question. If atmospheric movement and surface crust have been frictionally decoupled, then how can it flow without (or massively reduced) friction?
English
@zachariaspro Zach you say that “when the winds shift the rotation responds”. I thought rotation drove the winds, not the other way around?
English

On the 9,000 mile kelvin wave of warm water crossing the Pacific:
For decades, when scientists wanted to predict how fast Earth was spinning on any given day, they looked at the atmosphere. Atmospheric winds carry angular momentum. When the winds shift, Earth's rotation responds. The relationship is so reliable that atmospheric data typically explains 80 to 90 percent of how the length of a day varies. This is textbook.
In 2026, that relationship broke.
I pulled the official IERS rotation data and the standard atmospheric, oceanic, and hydrological models for this year. Through January and February, the correlation between what the atmosphere predicts and what the planet actually does was already weaker than expected, around 0.5 instead of the usual 0.8. By March and April it dropped to near zero. By mid-May it had gone negative.
When the atmosphere said Earth should slow, Earth sped up.
In the seven days bracketing April 29, observed length of day dropped by 0.72 milliseconds. The atmosphere predicted essentially no change. The pole shifted direction by about 40 degrees in the smoothed signal, and considerably more in the unsmoothed daily values.
The atmospheric forcing that should have caused this didn't move. Whatever is driving Earth's rotation right now is not primarily the atmosphere.
The polar vortex destabilized this winter with near-record stratospheric warming events (SSWs) in January and February. In April, a structurally unusual pair of equatorial cyclones reversed the Pacific trade winds and launched the Kelvin wave that's now in the news. Antarctic sudden stratospheric warmings have occurred for the first time on record.
The Chandler wobble, Earth's natural rotational oscillation, has been near zero since 2015. Four of five recent significant earthquakes occurred on margins of the deep mantle structures called LLSVPs.
Each of these has its own conventional explanation. Each one in isolation can be filed under "unusual but not unprecedented." What's harder to file is the fact that they are all happening simultaneously, and the system that normally ties Earth's spin to its weather has stopped working the way it's supposed to.
The conventional picture has clear directional arrows. The atmosphere drives length of day variations. The ocean responds to atmospheric forcing. The pole responds to mass redistribution at the surface. In the data right now, the atmosphere is the smallest term. The ocean is moving on its own timescale. The pole is doing something that surface fluids cannot account for.
The arrows in the diagram are not pointing where they're supposed to point.
My GEOSYNC framework's forecasts during Monte Carlo modeling have been specific. Spring 2026 as the bifurcation window. Wobble extinction as a leading signal. Directional locking of the pole toward roughly 75 degrees west. And all interelated systems (i.e. the atmosphere, the ocean, the ice) destabilize together rather than separately.
So here is the read on the Kelvin wave and what it sits inside:
The wave itself has a clean atmospheric trigger. The cyclone pair, the wind reversal, the standard ocean feedback loops. That part is not mysterious. What is mysterious is why the atmosphere is producing structurally rare configurations like equatorial cyclone pairs in the first place, why the polar vortex keeps tearing apart, and why Earth's rotation has stopped tracking with its supposedly primary driver.
The simplest explanation that ties all of this together is that we are not watching a sequence of independent extreme weather events. We are watching a coupled system transition through a regime change, and the surface anomalies (the heat blob, the storms, the wobble in the jet stream) are downstream symptoms of something happening deeper.
This is preliminary work.
More to come.

IonszTheMion@Miosz13922749
@forallcurious @zachariaspro @EthicalSkeptic @sunfellow @OMApproach @OMGTheWhyFiles x.com/i/grok/share/0… Here you go, the proof you've been looking for, right in front of your eyes... But I do not think this is a good information for all of us
English

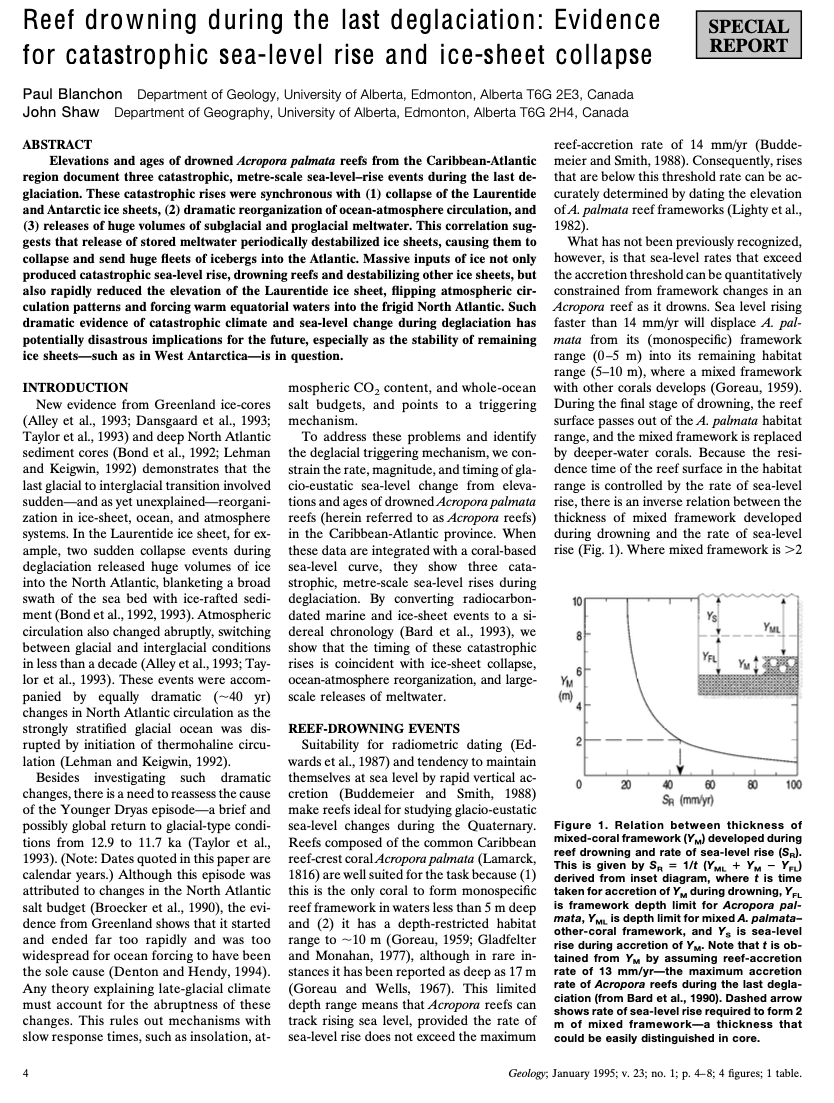
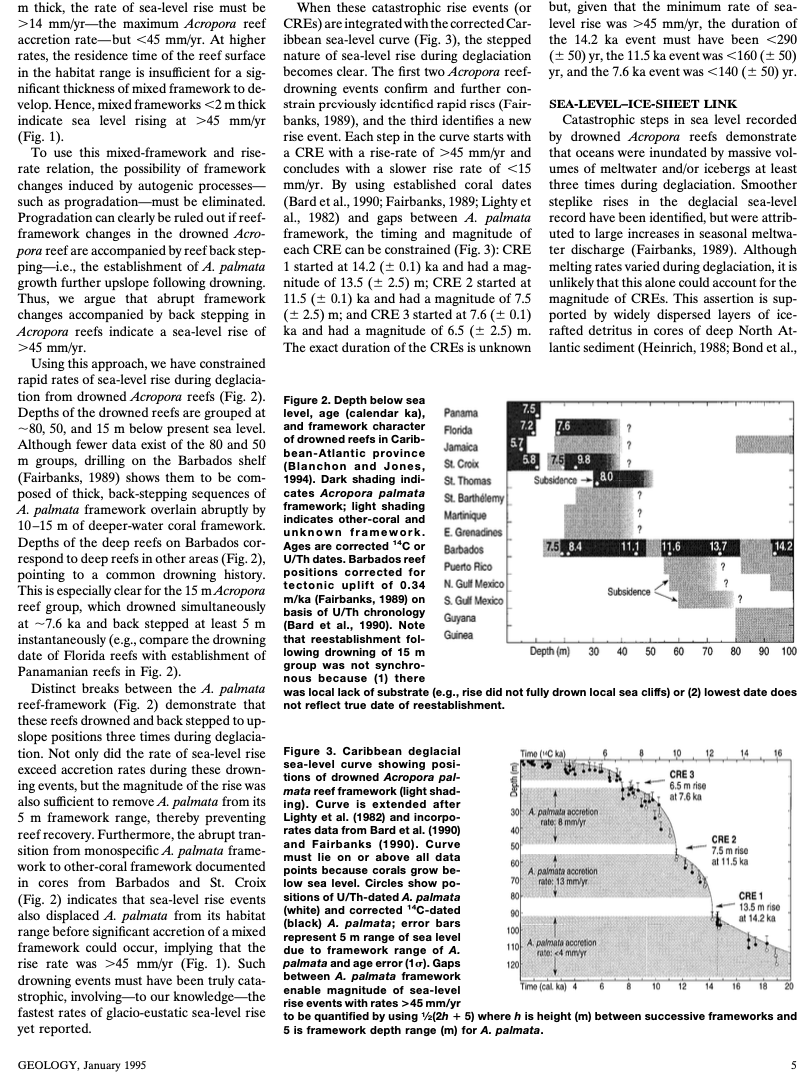
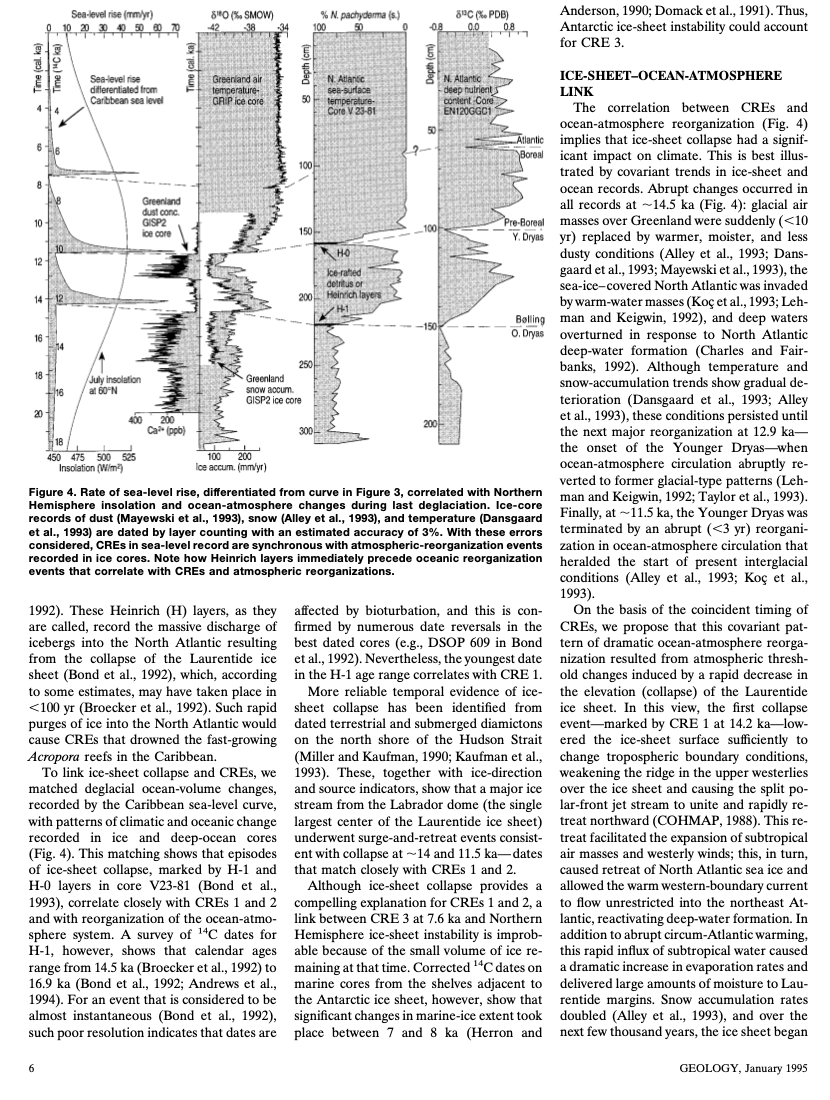
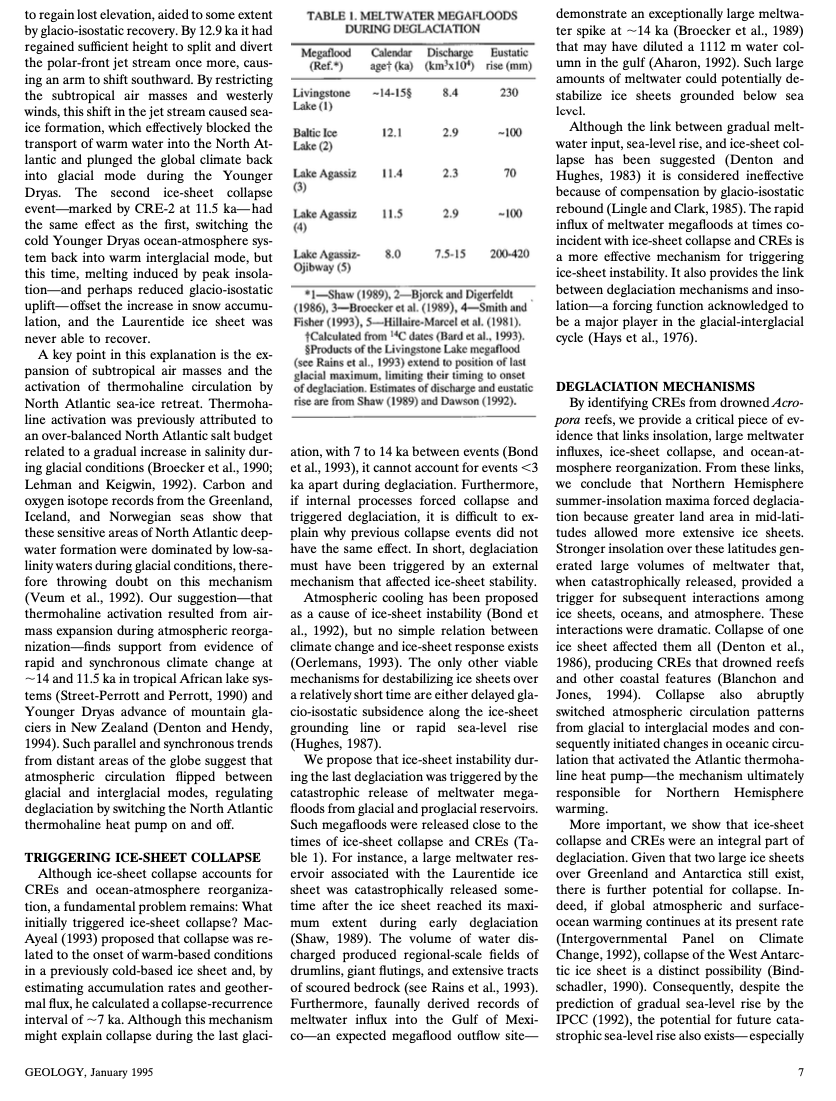
The colour represents a range of possible pole positions that would satisfy a coastline at the target location and depth. So not a timeline, but rather a constraint for possible previous poles (coastlines require time to form). The dates are drawn from the drowned reefs paper, a useful chronology of sea level change. This is the calibration reference against which the converged position paths are dated.
English
In 1931, ocean explorer William Beebe dredged the seafloor south of Bermuda, expecting to find mud and deep-sea debris. He discovered something extraordinary in the unmistakable remains of an ancient beach - rounded pebbles, broken coral, and shells from extant shallow-water species. The kicker: this “beach” was situated over 2.5 kilometers below present day sea level.
Beebe observed that the seabed in this area was flat and stable, which made it unlikely that coastal material could simply slide down from above. The rocks themselves appeared wave-worn, siimilar to shoreline material, and the shell assemblage matched modern littoral ecosystems. This discovery did not resemble transported debris; a beach that had no logical place.
[1] A Submerged Beach off Bermuda, Beebe (1931), science.org/doi/10.1126/sc…


English
@FreddieCouples @nobulart Thank you! Putting published research papers behind paywalls should really be made illegal with serious punishments.
English