@TheLongInvest $MAG 4 of the 7 will almost certainly be dead money for a decade. Go back and study history of previous market leaders. They rarely lead the next bull market!
English
Josh Mullins
650 posts

@ETFbreakouts
I buy ETF breakouts and the strongest stocks inside them. Theme-first momentum trading | CANSLIM/VCP/EP style | Full-time trader.

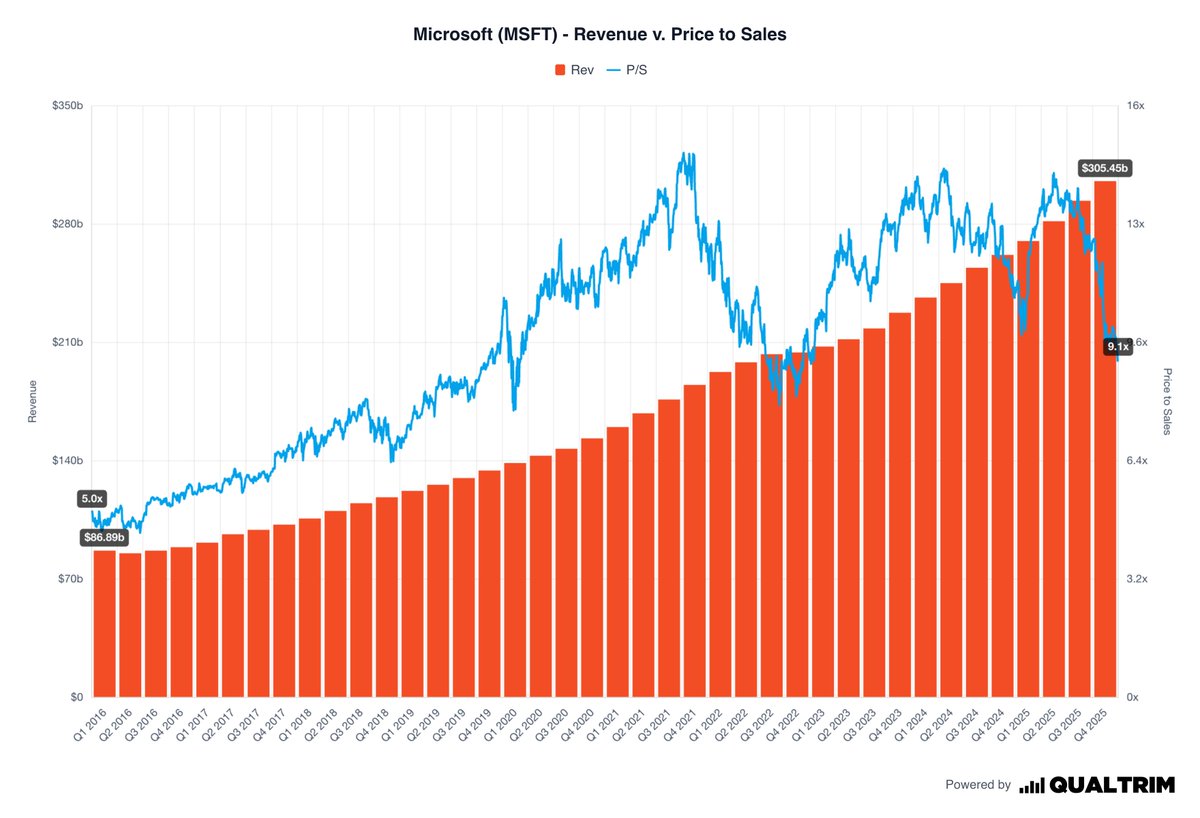
$MSFT Value Trap: Everyone's talking about $MSFT trading at its lowest forward P/E in years. They think it's cheap. It's not. It's a value trap. $MSFT has spent tens of billions on AI integration and the market is telling you it hasn't worked. Copilot adoption is underwhelming. Capex is exploding. Gross margins just hit a 3-year low. And Q3 operating margin guidance came in below consensus. The P/E compression is hiding the real story. Translation: that falling P/E ratio everyone is celebrating? It's not telling you the whole story. Price-to-free-cash-flow: 37x against a 10-year median of ~33x. FCF yield is 2.7% — worse than 75% of its industry. Free cash flow actually declined in FY2025 while capex grew 58%. They're tracking toward $120B+ in capex for FY2026. Cash is going out the door faster than it's coming back. Here's what the "low P/E" crowd isn't thinking about: $MSFT is spending $120B+ this year building AI data centers. That capex doesn't hit earnings all at once — it gets expensed over the next 5+ years as depreciation. In plain English: the costs from today's spending spree will be dragging down earnings well into 2028, 2029, 2030. That "cheap" P/E? It's about to get worse, not better — even if revenue grows. A falling P/E with deteriorating free cash flow and a future depreciation headwind isn't cheap. It's a trap. The stock is down because institutional holders are repricing the AI monetization timeline — not because the market is mispricing the business. Cheap gets cheaper when the tide is going out. 🐻

Once this war is over it’s gonna be a RIPPER $MSFT is dirt cheap
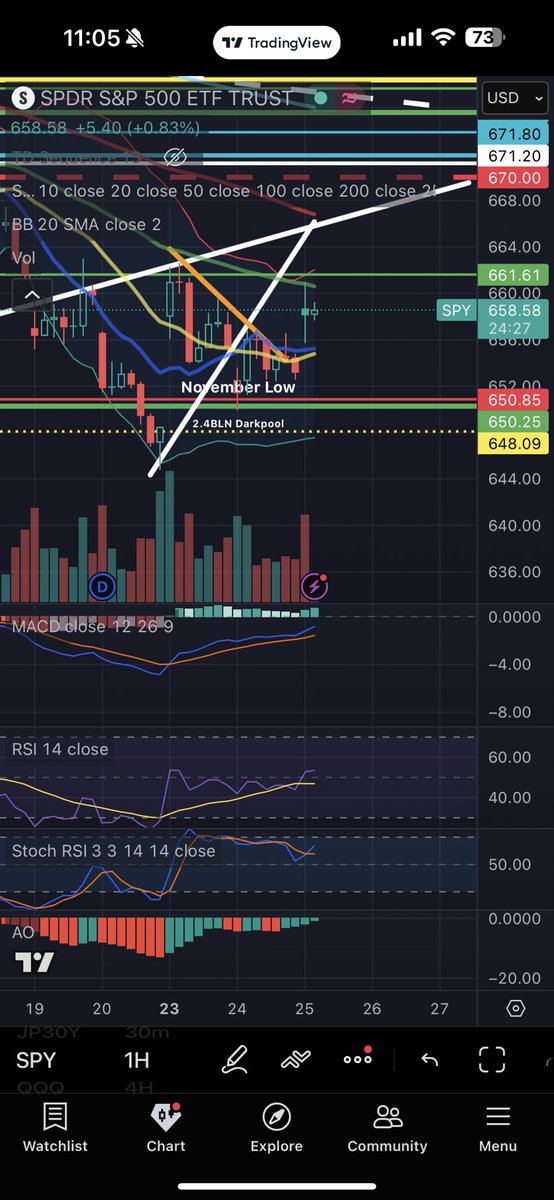
Are we due for a bounce? The breadth data says yes. % of stocks above their 20 DMA on $SPX, $NYA, and $COMPQ: all deeply oversold. Short-term bounce conditions are here. 50 DMA breadth is also approaching bounce territory. This one matters more — bounces here last more than a few days. The kind that makes people think the bottom is in. It's not. More on that tomorrow. I flagged the $NYA top using breadth divergences on 3/1 x.com/ETFbreakouts/s…. Same framework, new signal. Don't confuse a bounce for a bottom. 🐻


$MSFT Value Trap: Everyone's talking about $MSFT trading at its lowest forward P/E in years. They think it's cheap. It's not. It's a value trap. $MSFT has spent tens of billions on AI integration and the market is telling you it hasn't worked. Copilot adoption is underwhelming. Capex is exploding. Gross margins just hit a 3-year low. And Q3 operating margin guidance came in below consensus. The P/E compression is hiding the real story. Translation: that falling P/E ratio everyone is celebrating? It's not telling you the whole story. Price-to-free-cash-flow: 37x against a 10-year median of ~33x. FCF yield is 2.7% — worse than 75% of its industry. Free cash flow actually declined in FY2025 while capex grew 58%. They're tracking toward $120B+ in capex for FY2026. Cash is going out the door faster than it's coming back. Here's what the "low P/E" crowd isn't thinking about: $MSFT is spending $120B+ this year building AI data centers. That capex doesn't hit earnings all at once — it gets expensed over the next 5+ years as depreciation. In plain English: the costs from today's spending spree will be dragging down earnings well into 2028, 2029, 2030. That "cheap" P/E? It's about to get worse, not better — even if revenue grows. A falling P/E with deteriorating free cash flow and a future depreciation headwind isn't cheap. It's a trap. The stock is down because institutional holders are repricing the AI monetization timeline — not because the market is mispricing the business. Cheap gets cheaper when the tide is going out. 🐻

$MSFT Value Trap: Everyone's talking about $MSFT trading at its lowest forward P/E in years. They think it's cheap. It's not. It's a value trap. $MSFT has spent tens of billions on AI integration and the market is telling you it hasn't worked. Copilot adoption is underwhelming. Capex is exploding. Gross margins just hit a 3-year low. And Q3 operating margin guidance came in below consensus. The P/E compression is hiding the real story. Translation: that falling P/E ratio everyone is celebrating? It's not telling you the whole story. Price-to-free-cash-flow: 37x against a 10-year median of ~33x. FCF yield is 2.7% — worse than 75% of its industry. Free cash flow actually declined in FY2025 while capex grew 58%. They're tracking toward $120B+ in capex for FY2026. Cash is going out the door faster than it's coming back. Here's what the "low P/E" crowd isn't thinking about: $MSFT is spending $120B+ this year building AI data centers. That capex doesn't hit earnings all at once — it gets expensed over the next 5+ years as depreciation. In plain English: the costs from today's spending spree will be dragging down earnings well into 2028, 2029, 2030. That "cheap" P/E? It's about to get worse, not better — even if revenue grows. A falling P/E with deteriorating free cash flow and a future depreciation headwind isn't cheap. It's a trap. The stock is down because institutional holders are repricing the AI monetization timeline — not because the market is mispricing the business. Cheap gets cheaper when the tide is going out. 🐻


$SPX: When the percentage of stocks above their 20 and 50 daily moving averages is this low (below 20%), a bottom is typically in or nearby. How sustainable will be this bounce?
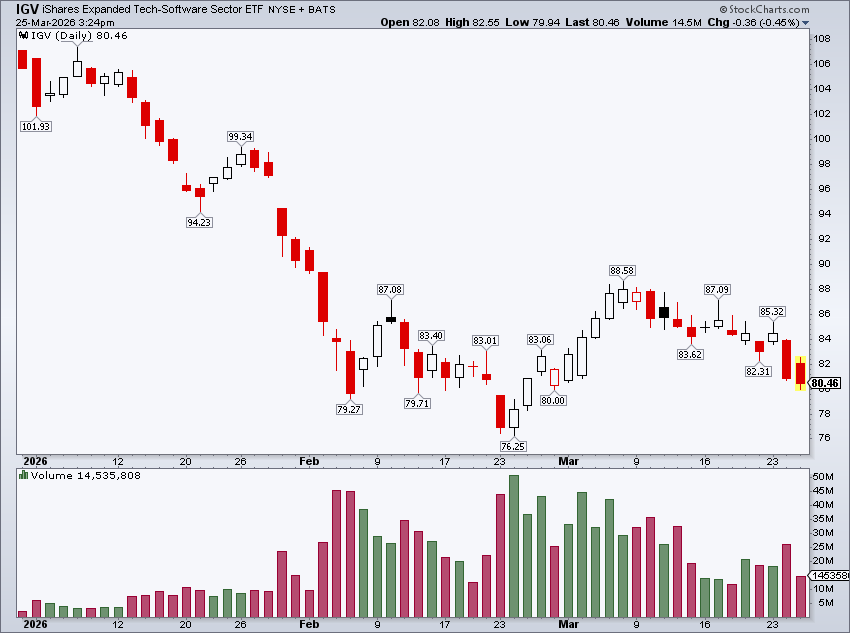
The Nasdaq is the most unbuyable chart in the market. Yet everyone’s still rushing to buy the dip. This is what late-cycle price structure looks like.

That was a terrible 5-year auction. Second day in a row I'm giving a D- to a treasury auction. That bid to cover is abysmal.
$GOOGL tested prior support and got rejected cleanly. This is one of the things I keep seeing across the board right now — textbook technical action on the downside. Support becomes resistance. Bounces fail at predictable levels. No messy chop, no fake reclaims. In my experience, bear markets produce the cleanest technical patterns on the way down. The same precision that makes breakouts work in bull markets shows up in breakdowns during corrections. When the sellers are in control, the chart tells you exactly where it's going. This is more evidence we're likely in the early stages of a bigger correction — not the end of one. x.com/ETFbreakouts/s…

Are we due for a bounce? The breadth data says yes. % of stocks above their 20 DMA on $SPX, $NYA, and $COMPQ: all deeply oversold. Short-term bounce conditions are here. 50 DMA breadth is also approaching bounce territory. This one matters more — bounces here last more than a few days. The kind that makes people think the bottom is in. It's not. More on that tomorrow. I flagged the $NYA top using breadth divergences on 3/1 x.com/ETFbreakouts/s…. Same framework, new signal. Don't confuse a bounce for a bottom. 🐻

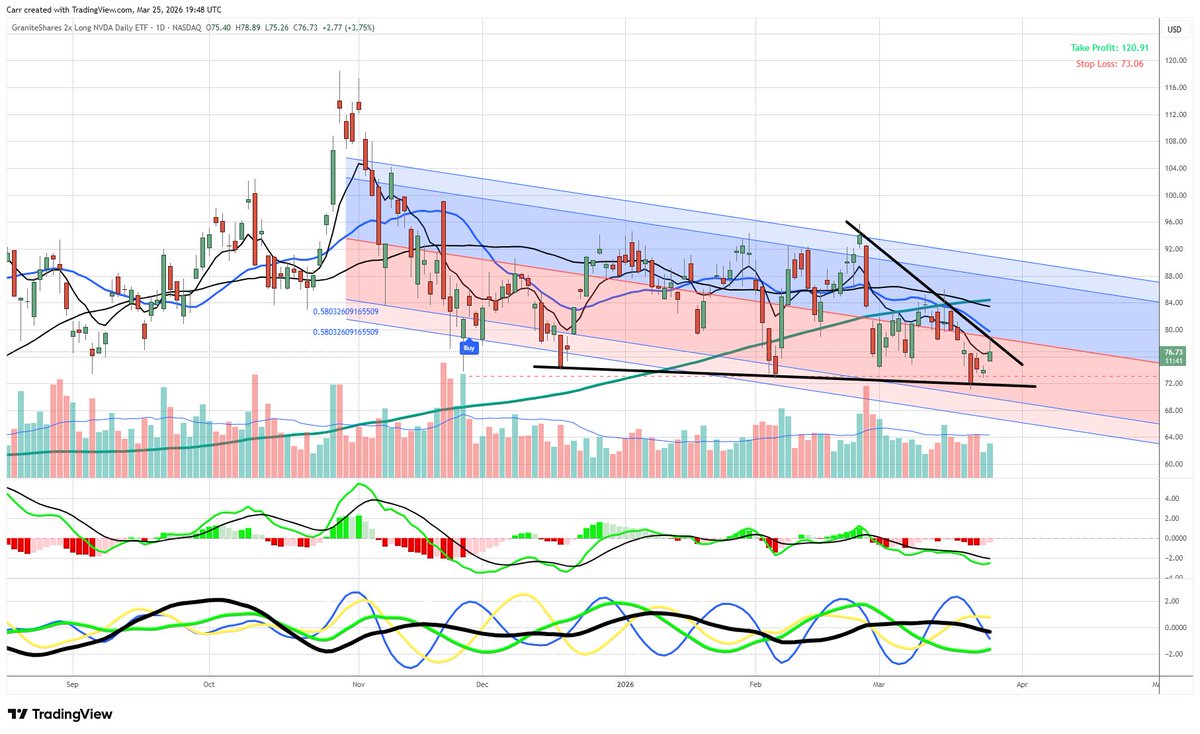
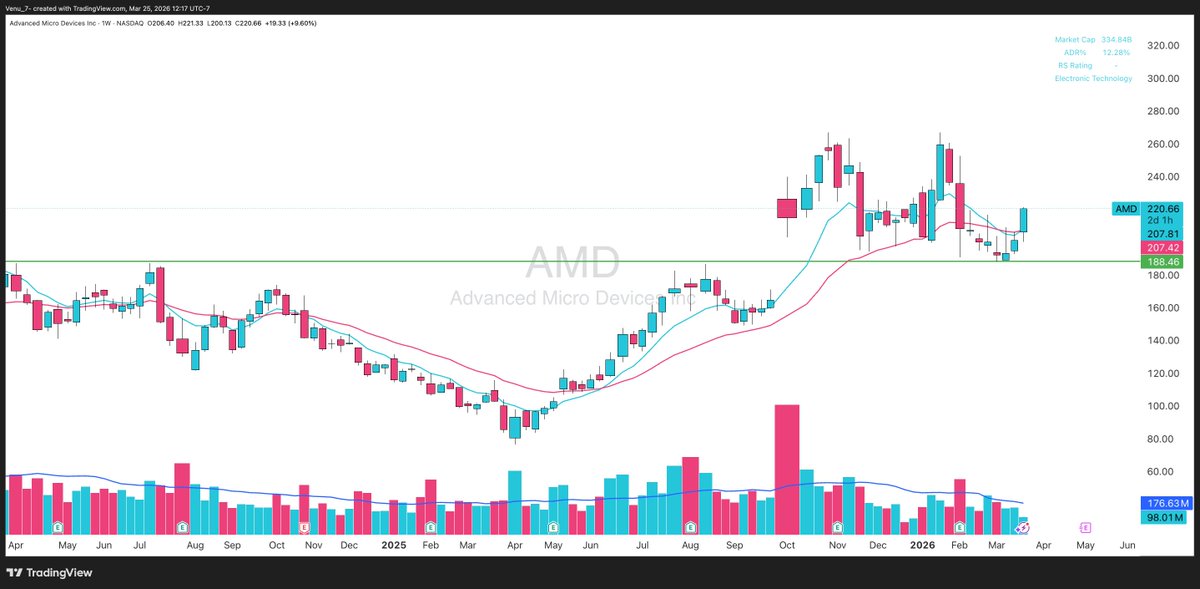
POST — $NVDA: The $SMH Problem $SMH chart looks constructive. A number of underlying semis are showing strength. $ARM is rallying hard. $AMD up 7.5% today after putting in higher lows on a rising 200 DMA. One problem: $NVDA. It's stuck below a cluster of flattening and downward-sloping moving averages — the 10, 21, 50, and 200 DMA are all converging and pressing down on price. That's not consolidation. That's overhead supply. Distribution is rampant. Look at the red volume spikes on down days and down weeks. Institutional selling has been persistent since November. RVOL is pacing below average on today's bounce — not exactly a conviction reversal. Here's why this matters beyond just $NVDA: $NVDA is ~18% of $SMH. It's ~8.5% of $QQQ. It's ~7% of the $SPX. No single stock has this much gravitational pull across the three indices everyone watches. $SMH can rally without $NVDA for a few days — but it can't sustain a real move while its largest component is pinned under declining moving averages with active distribution. The question isn't whether semis are bouncing. They are. The question is whether $NVDA can reclaim and hold above this moving average cluster. If it can't, $SMH has a ceiling — and so does any "broad market recovery" narrative. Until $NVDA can get above the 3/16 high of ~$189; this is a headwind for the entire market.
POST — $NVDA: The $SMH Problem $SMH chart looks constructive. A number of underlying semis are showing strength. $ARM is rallying hard. $AMD up 7.5% today after putting in higher lows on a rising 200 DMA. One problem: $NVDA. It's stuck below a cluster of flattening and downward-sloping moving averages — the 10, 21, 50, and 200 DMA are all converging and pressing down on price. That's not consolidation. That's overhead supply. Distribution is rampant. Look at the red volume spikes on down days and down weeks. Institutional selling has been persistent since November. RVOL is pacing below average on today's bounce — not exactly a conviction reversal. Here's why this matters beyond just $NVDA: $NVDA is ~18% of $SMH. It's ~8.5% of $QQQ. It's ~7% of the $SPX. No single stock has this much gravitational pull across the three indices everyone watches. $SMH can rally without $NVDA for a few days — but it can't sustain a real move while its largest component is pinned under declining moving averages with active distribution. The question isn't whether semis are bouncing. They are. The question is whether $NVDA can reclaim and hold above this moving average cluster. If it can't, $SMH has a ceiling — and so does any "broad market recovery" narrative. Until $NVDA can get above the 3/16 high of ~$189; this is a headwind for the entire market.

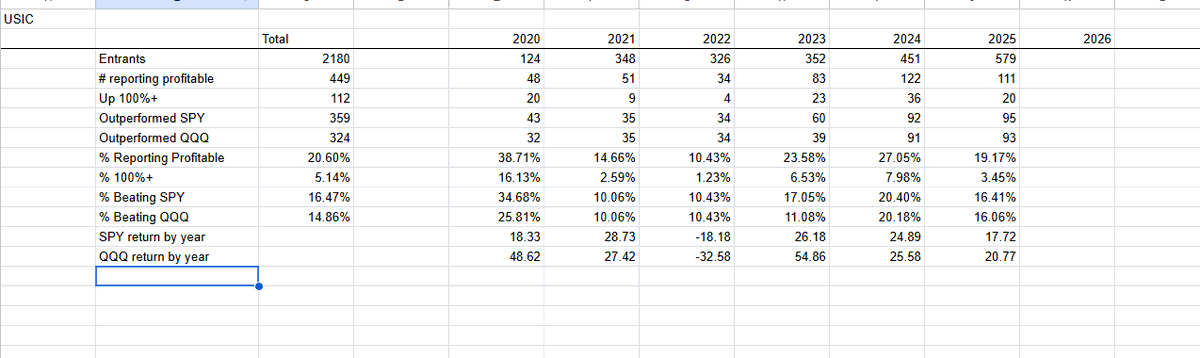
I wasn't joking gang! Only 20% of participants are currently reporting profits in the US Investing Championship so far this year There's still plenty of time to turn things around. LFG 😤

Introducing TurboQuant: Our new compression algorithm that reduces LLM key-value cache memory by at least 6x and delivers up to 8x speedup, all with zero accuracy loss, redefining AI efficiency. Read the blog to learn how it achieves these results: goo.gle/4bsq2qI