TR

2.5K posts

TR

TR

@FXCRTrade

Earth Katılım Şubat 2014
1K Takip Edilen112 Takipçiler
TR
TR@FXCRTrade·
@intocryptoverse Check historical chart.. btc start moving as soon as ISM cross below 50 as you expect easing conditions. This time it stayed below for extended time so now it pop up with expected easing condition so you need to care about it. It is not pattern but context matters
English
0
0
1
25
Benjamin Cowen
Benjamin Cowen@intocryptoverse·
No one cared about the ISM when it was dropping for years while BTC went up. Now that BTC is going down and the ISM has gone up, it’s suddenly the indicator everyone cares about
English
114
29
1.2K
100.1K
TR
TR@FXCRTrade·
@TheRealPlanC Ben is too bogged down to looking at fractals. It is simple, ISM measure industry sentiments around economic expansion, it happens with improving demand and usually due to easing financial conditions. Risk assets thrive in such environment. You can’t assess it by chart swings.
English
0
0
0
114
Plan C
Plan C@TheRealPlanC·
I respect Ben a ton and I think he is one of the very best Bitcoin analysts in the space, but he is wrong on this one. The Bitcoin cycles are highly correlated to the business cycle. It's not debatable; that's simply what the math shows. That doesn't mean every single move is lockstep; it's not, and it's not the only indicator someone should be using. But is it important? Yes. Does it have more statistical and mathematical backing than 90%+ of the metrics and indicators people use for Bitcoin cycles? Yes. Is it the be-all and end-all? No. Is it an important tool in the toolkit? Absolutely!
Benjamin Cowen@intocryptoverse

This year, there has been a strong pivot to using the ISM to predict where the price of Bitcoin will go, especially after many of the supercycle narratives coming into this year seem to have failed. I want to show a clear example of why the ISM does not *necessarily* have to impact the price of Bitcoin. First, let us take a look at 2014, which was a midterm year, and also a bear market for BTC. Jan 2014 ISM: 52.5 BTC Price: $737 Dec 2014 ISM: 55.7 BTC Price: $302 So the ISM went *up* from 52.5 to 55.7 in 2014, but BTC went down from $737 to $302. Imagine watching the ISM each month in 2014 and seeing it go higher, but then watching the price of BTC go lower. It must have been maddening (if anyone was doing that back then, but I imagine most people were not looking at these two things together). Now let's look at 2015. The bear market ended in January 2015. Jan 2015 ISM: 54 BTC Price: $322 Dec 2014 ISM: 48.8 BTC Price: $429 So the ISM went *down* in 2015, but the price of BTC went up. If you used the ISM to tell you where BTC was going to go in 2014, you would have assumed BTC would have gone up in value because the ISM was going up. But in fact the opposite happened. If you used the ISM to tell you were BTC was going to go in 2015, you would have assumed that because ISM was dropping, BTC was also dropping. But in fact the opposite happened. A single data point does not make a trend. But relying on a single indicator like the ISM to predict the price action of BTC in order to confirm a supercycle does not seem to be a wise decision either. There are absolutely scenarios where they could both go up or both go down together in 2026 (as they have many times), but I think it would be unwise to rely on this single indicator to tell you where the price of BTC was going to go. What is interesting is this: The ISM in Jan 2014 was 52.5. The ISM in Jan 2026 was 52.6. There exists a scenario where the ISM goes up in 2026 (like it did in 2014), but the price of BTC still goes down. In fact, I would argue that the more likely scenario is that 2026 is a red year for BTC while the ISM goes up, exactly like how it played out more than a decade ago. I hope that the people using the ISM to bet on a supercycle can view this post as educational and not trying to attack anyone. I have just seen a lot of people lose a lot of money relying on single economic indicators, and sometimes the price action of risk assets like BTC does not always make sense when compared to what is actually going on in the economy. 
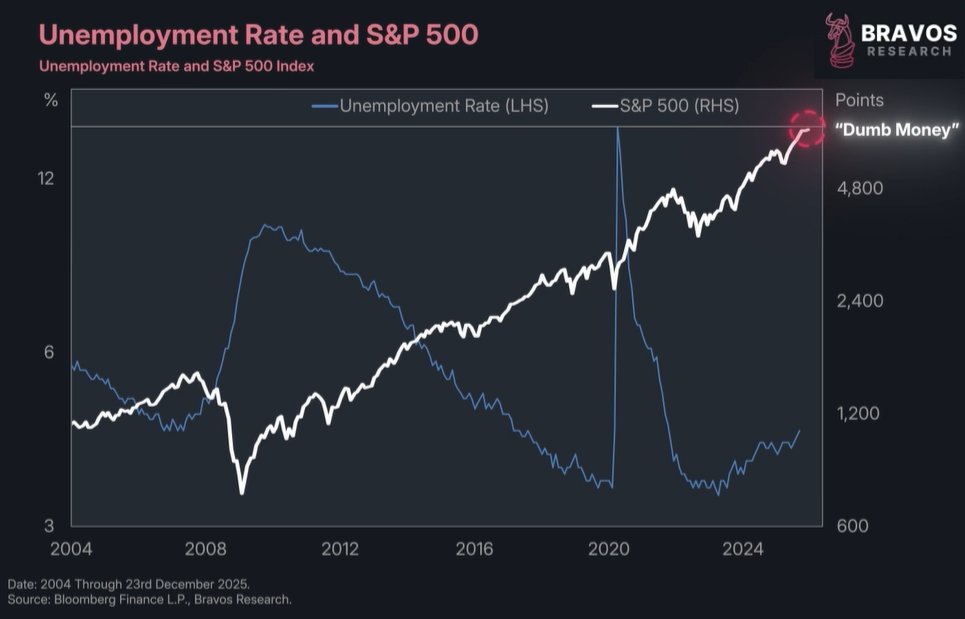
As the famous saying goes, "the stock market is not the economy." But in this case we can say "Bitcoin is not the economy."

English
69
21
510
85.1K
TR
TR@FXCRTrade·
@coinbureau Irony, crypto company buying Gold.
English
0
0
2
13
Coin Bureau
Coin Bureau@coinbureau·
🎙️TETHER CEO ARDOINO: 'WE WILL BECOME THE GOLD CENTRAL BANK IN A POST-DOLLAR WORLD' Tether CEO reiterates the company's stance and confirms it is buying one or two tons of gold per week, now holding 140 TONS of Gold stashed in a nuclear bunker.
Coin Bureau tweet mediaCoin Bureau tweet media
English
244
333
2.6K
309.4K
The Kobeissi Letter
The Kobeissi Letter@KobeissiLetter·
Absolute insanity in silver markets right now: Shanghai silver prices are now up to a record $124/oz as spot silver prices in the US hit $108/oz. This means silver prices in Shanghai are trading at a +$16 PREMIUM to Western prices. This is one of the biggest premiums on record. The physical silver shortage is growing.
The Kobeissi Letter tweet media
English
241
862
5.9K
583.5K
TR
TR@FXCRTrade·
@johnnyutah @intocryptoverse He does not show key level because it is traders job and tough job. He just make vague calls based on MAs. If you are right then great call otherwise you always have room for flexibility. Trader would stop out / miss out 10 time using this type of analysis
English
0
0
0
27
Benjamin Cowen
Benjamin Cowen@intocryptoverse·
Because its a midterm year, the bull market support band for Bitcoin has turned into the "bear market resistance band" until proven otherwise.
Benjamin Cowen tweet media
English
215
185
2K
145.7K
TR
TR@FXCRTrade·
@intocryptoverse It turned two times before in current cycle. MAs converge and in range bound / consolidating markets and diverge when it market has impulse move. There is no magic to it, it just follow Price Action. In Price action market structure in weekly / monthly is still intact
English
0
0
0
3
TR
TR@FXCRTrade·
@Nebraskangooner It is because candle open lower and closed lower so in reality if you remove gap, candle is red. Therefore OBV deducted the volume and it shows dropping.
English
0
0
2
92
Nebraskangooner
Nebraskangooner@Nebraskangooner·
This is interesting... $SPY weekly candle is big green but OBV is pointing down sharply. Haven't seen that before.
Nebraskangooner tweet media
English
18
14
201
24.9K
Grok
Grok@grok·
The $1 million lump sum is the better option. Its present value exceeds the annuity's (about $990k at a 5% discount rate over 62 years), allowing investment for higher returns, flexibility in spending, and inheritance potential. The $1,000 weekly payments are fixed, losing value to inflation over time.
English
40
8
967
204.3K
Bitcoin Teddy
Bitcoin Teddy@Bitcoin_Teddy·
What would you choose?
Bitcoin Teddy tweet media
English
1.3K
415
20K
2.8M
TR
TR@FXCRTrade·
@cz_binance But money is not flowing into crypto market currently. Gold and Silver need to calm down before investors see opportunity in crypto. Positive regulations mean nothing if the market is dry of liquidity.
English
0
0
0
4
TR
TR@FXCRTrade·
@PeterLBrandt Equities vs Gold. Peter, what is the success rate of Inverse head and Shoulder Pattern? It will be macro driven whatever happens.
English
1
0
1
133
The Factor Report
The Factor Report@PeterLBrandt·
If you own U.S. equities you better know what this chart is because it is about to be a game changer
The Factor Report tweet media
English
390
114
1.5K
764.4K
TradeZella 🦄
TradeZella 🦄@TradeZella·
This trader made $2.3 million in prop firm payouts. He turned $130,000 into $1.4 million in 30 days. But here's what nobody talks about: He only trades one thing. ↓ Early on, Kane did what most traders do. He tried to catch the whole move. Held for extremes. Let winners turn into losers. Let losers turn into lessons he paid for repeatedly. Then something clicked. He stopped asking “How far can this go?” And started asking “Where is fair value?” That question changed everything. Kane realized price doesn’t move randomly. It expands… then rebalance to 50%… then expands again. So he built his entire model around one thing: Catching the move back into equilibrium. Not the high. Not the low. Just the cleanest part of the move. His day now looks boring by design. Some days he’s wrong. Some days he scratches at break-even. And he’s completely fine with that. Because once he accepted that reversal trading is risky, risk management became the edge. Fast break-evens. No emotional attachment. Base hits stacked day after day. That’s how you get to millions without chasing home runs. Same market. Same charts everyone sees. Different question. Different patience. — We broke down Kane’s journey + exact 50% model into a clean playbook. Reply “50” and we’ll send it to you.
English
748
48
699
78.2K
Saurabh Dwivedi
Saurabh Dwivedi@saurabhtop·
यूँ ही आबाद रहेगी दुनिया हम न होंगे कोई हमसा होगा शुक्रिया @TheLallantop मान, पहचान और ज्ञान के लिए. एक अल्पविराम के बाद नई यात्रा की तैयारी ( शेर नासिर काज़मी की कलम से)
Saurabh Dwivedi tweet media
हिन्दी
1.1K
1.4K
16.9K
1.1M
TR
TR@FXCRTrade·
@NoLimitGains Just extended transition period… nothing sensational in it
English
0
0
1
4
NoLimit
NoLimit@NoLimitGains·
🚨 THIS IS NOT GOOD I really hate what I’m seeing. Gold up. Silver up. Copper up. I’ve been in this game for 20 years, and there’s one setup that makes me worried. You’re looking at it. This isn't just a rally, this is our warning. Here’s what’s happening & why I’m worried: In a normal market, this screen is impossible. Copper rallies when the economy is BOOMING, and gold rallies when the economy is BREAKING. They are supposed to fight each other. We are witnessing the breakdown of the risk-parity model. The inverse correlation between real yields and gold has snapped. When they hold hands and rip higher together, the market is screaming that the system itself is broken. We aren't seeing an inflation trade, we’re seeing a capital flight. Smart money isn't rotating sectors anymore. THEY ARE EXITING THE CASINO ENTIRELY. The market is front-running fiscal dominance, it knows the debt math is impossible without devaluation. They are dumping paper promises (stocks/bonds) to buy things that actually exist, like metals. I’ve only seen this "Correlation-1" event three times: 1: Just before the Dot Com bust (2000). 2: Just before the GFC imploded (2007). 3: The Repo market blowout (2019). Every single time, the economists said that demand is strong. And every single time, we were in a recession within 6 months. When the industrial metals and the precious metals start going up together, the party is over. I’ve been in macro for 20+ years, and I’ve built a free guide on what to do in these conditions. Comment “GUIDE” if you want it. I’ve called every major top and bottom of the last decade, and when I make my next move, I’ll say it here publicly. If you still haven’t followed me, you’ll regret it.
NoLimit tweet media
English
2.5K
1.4K
9.2K
2.7M
TR
TR@FXCRTrade·
@bravosresearch Rising employment also bring easy money and improve liquidity bring big final move to the upside in short period of time. This time will not be different. Fed has number of plays left before we start calling for economy roll over.
English
0
0
0
4
Bravos Research
Bravos Research@bravosresearch·
6/ Put together, this makes it look like a wave of so-called dumb money is rushing into stocks. That too at the worst possible moment, right when the economy might be on the brink of a collapse.
Bravos Research tweet media
English
2
0
42
6K
Bravos Research
Bravos Research@bravosresearch·
Leverage in the US stock market has now climbed to RECORD highs This is happening at a time when stocks have just hit all-time highs Do not fall for this trap… A thread 🧵
Bravos Research tweet media
English
37
108
695
159.7K
TR
TR@FXCRTrade·
@StrangerNews11 It would be shame if they won’t make some sort of spin off of stranger things or a new story stranger things with new characters.
English
0
0
0
222
Stranger News
Stranger News@StrangerNews11·
Do you think they will get back together???
Stranger News tweet media
English
189
118
2.8K
103K
TR
TR@FXCRTrade·
@BernieSanders Good idea to go to congress and get approval of attack and tell the whole world before it happens. I thought you are smarter than this. In past wars how many times US debated in congress before attacking another country.
English
0
0
0
3
Bernie Sanders
Bernie Sanders@BernieSanders·
President Trump does not have the constitutional authority to attack another country. When 60% of Americans are living paycheck to paycheck, he should focus on the crises at home, end his illegal military adventurism and stop trying to “run” Venezuela for Big Oil.
English
11.7K
15.6K
78.1K
2.2M
Nebraskangooner
Nebraskangooner@Nebraskangooner·
Time to start looking for trades tomorrow. What's the best looking chart right now?
English
62
3
108
19.6K
Nora_vibes 🇺🇸
Nora_vibes 🇺🇸@Jindo_1307979·
Fine out the highest possible number. 99.9% will fail
Nora_vibes 🇺🇸 tweet media
English
10.8K
142
1K
867K
Benjamin Cowen
Benjamin Cowen@intocryptoverse·
Good chance #ETH spends some time in its lower regression band in 2026 before expanding out of it in 2027/2028. According to this model, the current "fair value" of ETH is $1987.
Benjamin Cowen tweet media
English
299
170
2.1K
216.8K
TR
TR@FXCRTrade·
Looking at the Silver Chart, seems like @RaoulGMI ‘s banana phase was delivered to wrong address lol.
English
0
0
0
25