Guglielmo Vetere, MD

200 posts

Guglielmo Vetere, MD

Guglielmo Vetere, MD

@Guv_onc

MD, Advanced Postdoctoral Fellow at MD Anderson Cancer Center - Houston, TX, USA & Medical Oncology Trainee at University of Pisa - Pisa, Italy

Houston, TX Katılım Ekim 2022
217 Takip Edilen131 Takipçiler
Guglielmo Vetere, MD retweetledi
Jordan Gauthier
Jordan Gauthier@drjgauthier·
💣 Important Shift in Cytopenia Grading: CTCAE v6.0 Update If you are a PI running #Hematology or #Oncology trials, note these key changes in the new CTCAE v6.0 vs v5.0: 
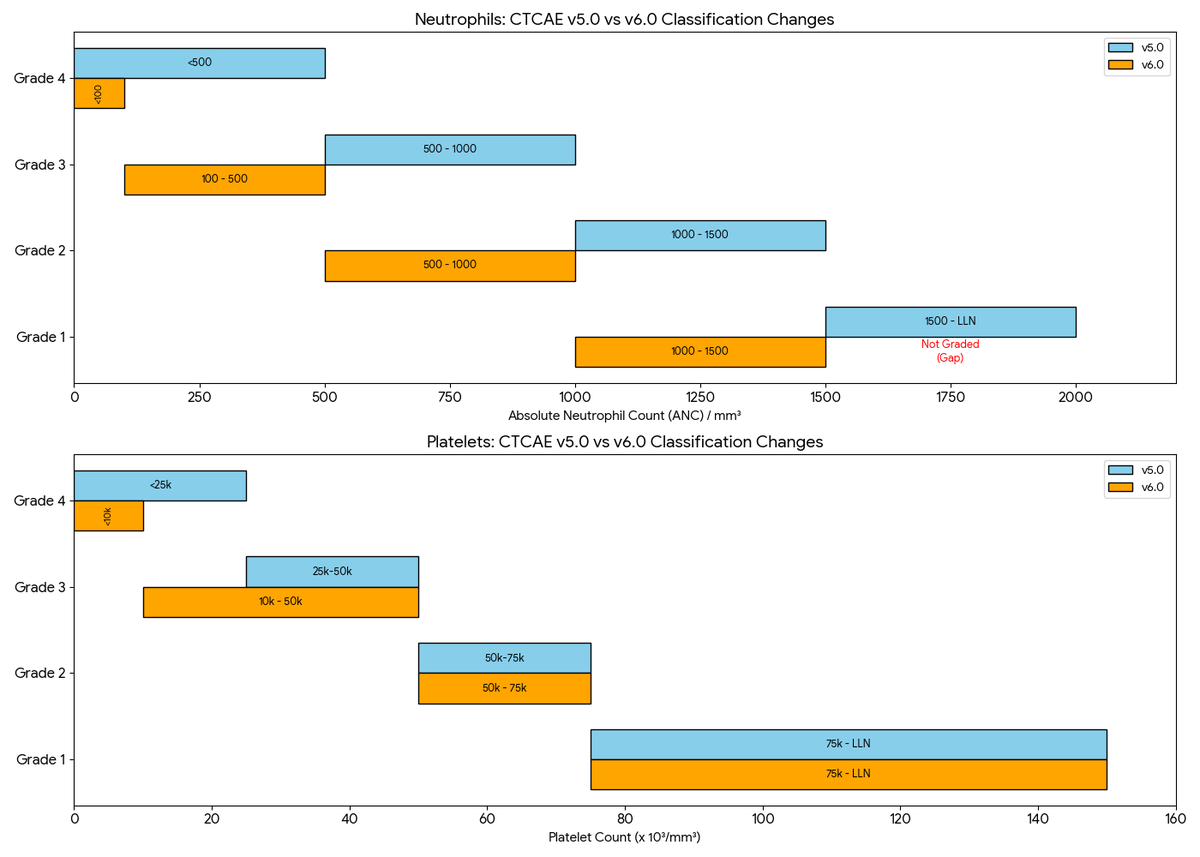
📉 General Trend: "Downgrading" of severity. Many counts that were previously Grade 3/4 are now lower grades. 🧪 Neutrophils: Grade 1 Gone: ANC 1000–1500 is now Grade 1 (was G2). The old Grade 1 (1500–LLN) is no longer graded. Stricter G4: threshold drops from <500 to <100/mm³. 🩸 Platelets (Thrombocytopenia): Wider G3: Now covers 10k–50k (previously 25k–50k). Stricter G4: threshold drops from <25k to <10k/mm³. v6.0 also adds "transfusion indicated" to Grade 3 and "urgent intervention indicated" to Grade 4 criteria. Overall, IMO these new thresholds align better with clinical practice. #ClinicalTrials #MedEd #OncTwitter #DrugSafety
Jordan Gauthier tweet media
English
3
106
199
24.4K
Guglielmo Vetere, MD retweetledi
Annals of Oncology
Annals of Oncology@Annals_Oncology·
🆕 article in press - Next-generation multicenter studies: using artificial intelligence to automatically process unstructured health records of patients with lung cancer across multiple institutions @mihaela_aldea @BenjaminBesseMD 👉#fig1" target="_blank" rel="nofollow noopener">annalsofoncology.org/article/S0923-…
Annals of Oncology tweet media
English
0
14
52
6K
Guglielmo Vetere, MD retweetledi
Anirban Maitra
Anirban Maitra@Aiims1742·
I found this a really useful resource paper in @NatRevImmunol Guidelines for T cell nomenclature nature.com/articles/s4157… The authors propose a new “modular” nomenclature that accounts for the increasing heterogeneity of T cell subtypes unearthed by recent single cell analyses.
Anirban Maitra tweet mediaAnirban Maitra tweet media
English
5
54
177
12.2K
Guglielmo Vetere, MD retweetledi
Scott Kopetz
Scott Kopetz@skopetz·
Delighted to join Jean-Nicolas Vauthey and Pierre-Alain Clavien to chair the Colorectal Liver Metastasis Consensus Conference. Based on the Danish-Zurich model and led by international experts, this will establish guidelines for the treatment of CRC liver metastases. #crcsm
Scott Kopetz tweet media
English
1
5
28
1.2K
Guglielmo Vetere, MD retweetledi
Scott Kopetz
Scott Kopetz@skopetz·
Tumor inflammation predicts better response to nivolumab alone in MSI-H CRC, while high mutational burden predicts benefit from nivolumab + ipilimumab. Our Nat Comm paper dives into CM142 and PD1 ± CTLA4 predictors with lead of @michael_overman. rdcu.be/eJHmS #crcsm
Scott Kopetz tweet media
English
7
28
134
16.2K
Guglielmo Vetere, MD retweetledi
Van Morris, MD
Van Morris, MD@VanMorrisMD·
Congrats @Guv_onc on your incredible work with our @MDAndersonNews team over the past two years to #endcancer for our #crcsm pts! Such a pleasure to mentor you and watch you bring a really exciting neoadjuvant immunotherapy trial to our patients!! Excited to have you a part of our team!!
Van Morris, MD tweet media
English
2
5
70
5.2K
Guglielmo Vetere, MD retweetledi
UT MD Anderson
UT MD Anderson@UTMDAnderson·
Results of a study that examined the effects of sugary drinks on the progression of colorectal cancer found that the glucose–fructose mix can directly fuel metastasis. Read more about how these findings point to possible new treatment targets: spr.ly/6013AVGAf #EndCancer
English
2
16
33
3.9K
Guglielmo Vetere, MD retweetledi
Van Morris, MD
Van Morris, MD@VanMorrisMD·
VERY proud of our @MDAndersonNews team's work now online @Cancer_Cell for BRAF+EGFR+PD1 blockade in MSS, BRAF V600E mCRC. ORR 50%, mPFS >7 mos w/encorafenib + cetuximab + nivolumab 🧵to expand IO benefit+liquid biopsy utility in high-risk MSS CRC pts bit.ly/4g1upd5
Van Morris, MD tweet media
English
14
27
113
6.7K
Guglielmo Vetere, MD retweetledi
ONCO BRUNO
ONCO BRUNO@brunolarvol·
Acknowledging @manjuggm on the #LARVOL Billboard (Times Square NYC) ! Thanks 🙏 Manju for your patient advocacy and education work. Your name also came unprompted when I had lunch with @GIMedOnc earlier this week.
ONCO BRUNO tweet media
English
2
7
22
1.6K
Guglielmo Vetere, MD retweetledi
ONCO BRUNO
ONCO BRUNO@brunolarvol·
Acknowledging @marklewismd for his patient advocacy (as both a patient and a clinician). Also celebrating his 8th Whipple-versary (pancreatic cancer surgery 8 years ago).
ONCO BRUNO tweet media
English
1
9
33
1.6K
Guglielmo Vetere, MD retweetledi
Joachim Schork
Joachim Schork@JoachimSchork·
One of the most common mix-ups in statistics is between standard deviation (SD) and standard error (SE). They sound similar, but they describe two completely different things—and using the wrong one can lead to misleading conclusions. Here's how to tell them apart. 🔹 Standard Deviation (SD): SD measures how spread out individual values are in your sample. It tells you about the variability within the data set. Example: How much do individual incomes vary in a sample of 1,000 people? 🔹 Standard Error (SE): SE measures how much an estimate (like a mean or proportion) would vary across repeated samples. It tells you how precise your estimate is. Example: How much would the sample mean income change if you ran the survey again? As your sample gets larger, SE gets smaller because you're more confident in your estimate. But SD often stays about the same since it reflects the natural spread in the data, not how many observations you have. Use SD to describe the data, and SE to describe the reliability of the estimate. For more on statistics, data science, R, and Python, subscribe to my email newsletter. Learn more: eepurl.com/gH6myT #datastructure #rstudioglobal #statisticsclass #RStats #Python #Data #StatisticalAnalysis
Joachim Schork tweet media
English
0
29
155
5.1K
Guglielmo Vetere, MD retweetledi
Joachim Schork
Joachim Schork@JoachimSchork·
If you're still using raw R outputs for presentations, it's time for an upgrade! Tools like gtsummary bring your statistical results to life, making them much more digestible for non-technical audiences. While base R functions like summary(fit) work well for statisticians, they can be too complex for stakeholders who aren’t familiar with the detailed output. The tbl_regression() function from gtsummary makes it easy to present regression results clearly. In addition, gtsummary is highly versatile - it’s not just limited to linear regression. You can apply it to generalized linear models, survival analyses, and more. The package even allows you to include p-values, confidence intervals, and other important statistics directly within the tables, helping you to better communicate statistical results. Here are a few standout benefits: ✅ Simplified output that’s easier for stakeholders to understand ✅ Works seamlessly with a variety of models ✅ Customizable tables with key statistics like p-values, confidence intervals, and more The visualization included here was originally shared in a post by Dr. Alexander Krannich. Thanks to Alexander for inspiring me to create this post. Interested in more tips on data science, statistics, Python, and R? Be sure to sign up for my free email newsletter! More info: eepurl.com/gH6myT #Data #Python #coding #pythoncode #DataAnalytics #R4DS #Rpackage #RStats
Joachim Schork tweet media
English
0
63
503
16.5K
Guglielmo Vetere, MD retweetledi
Anirban Maitra
Anirban Maitra@Aiims1742·
Absolutely insane amount of data in this resource from @mason_lab The Spatial Atlas of Human Anatomy (SAHA): A Multimodal Subcellular-Resolution Reference Across Human Organs biorxiv.org/content/10.110… Spatial data on 15million cells from 100 donors across multiple ages, mainly GI
Anirban Maitra tweet media
English
6
114
398
34.2K