@Akira_2050 @travismcm81 @MikybullCrypto @TheCryptoLark Exactly what i thought 😅 some people will never get it
English
HODL BRO
141 posts


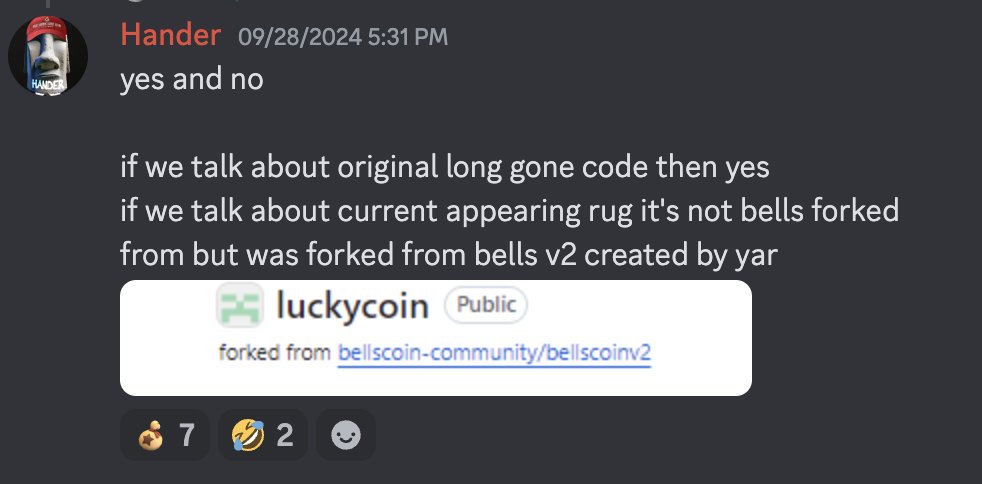
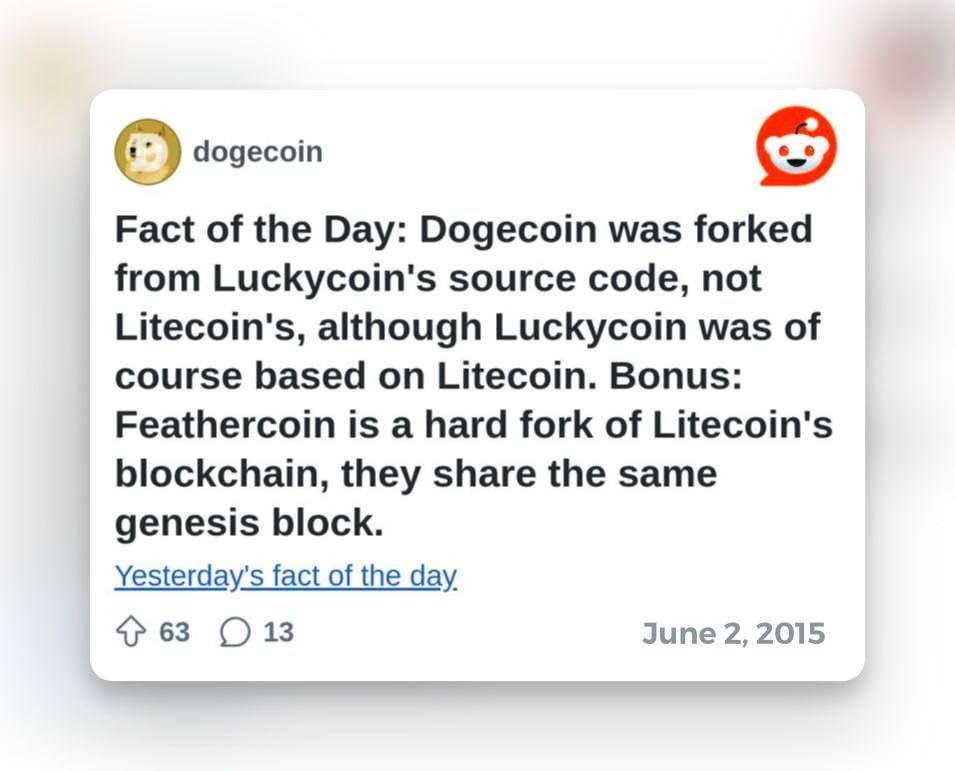
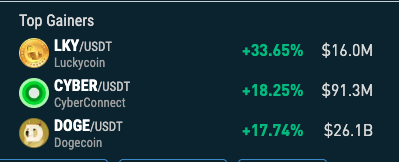
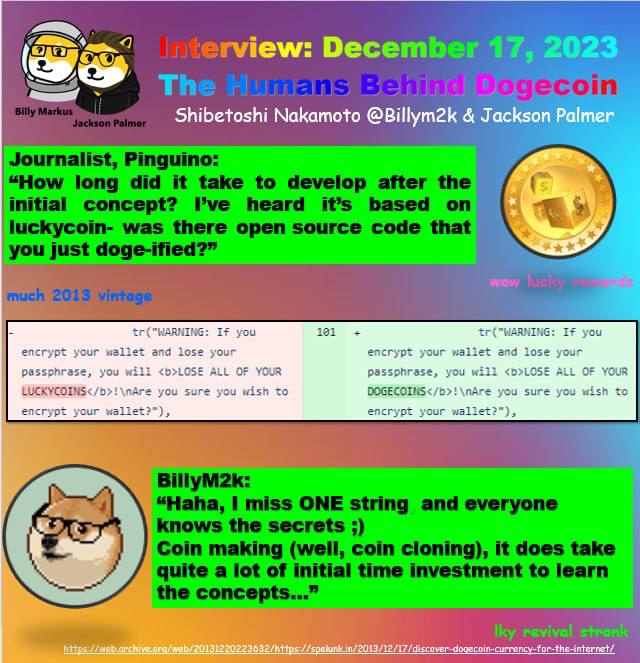
LuckyCoin: The Origin Story 📜 Explore how this historic 2013 cryptocurrency, which birthed both #dogecoin & #bellscoin, came to be Below we unpack its launch and the intriguing events surrounding it👇

CZ is back!! And he’s ripped 💪 @cz_binance how many pushups did you do every day?


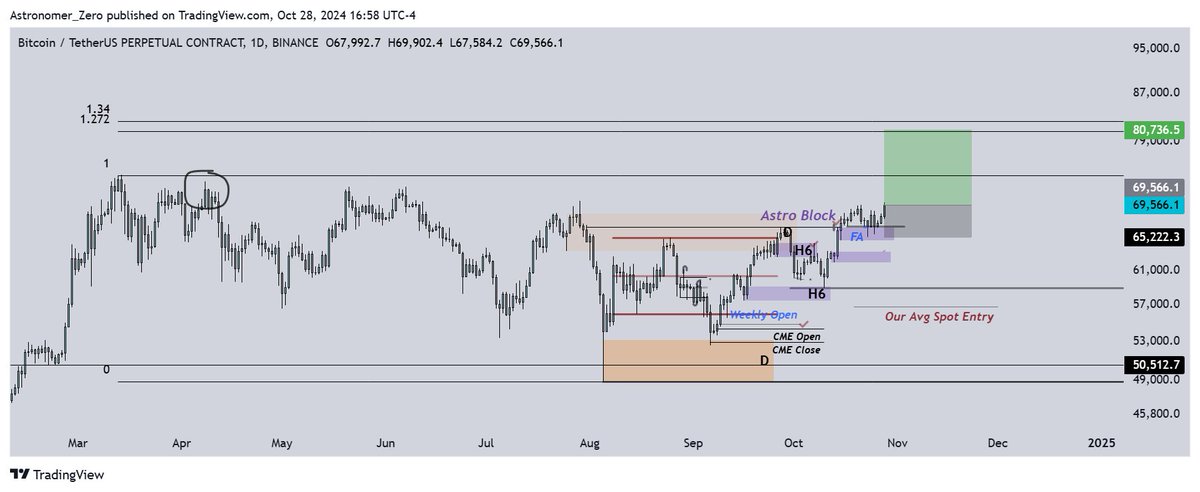
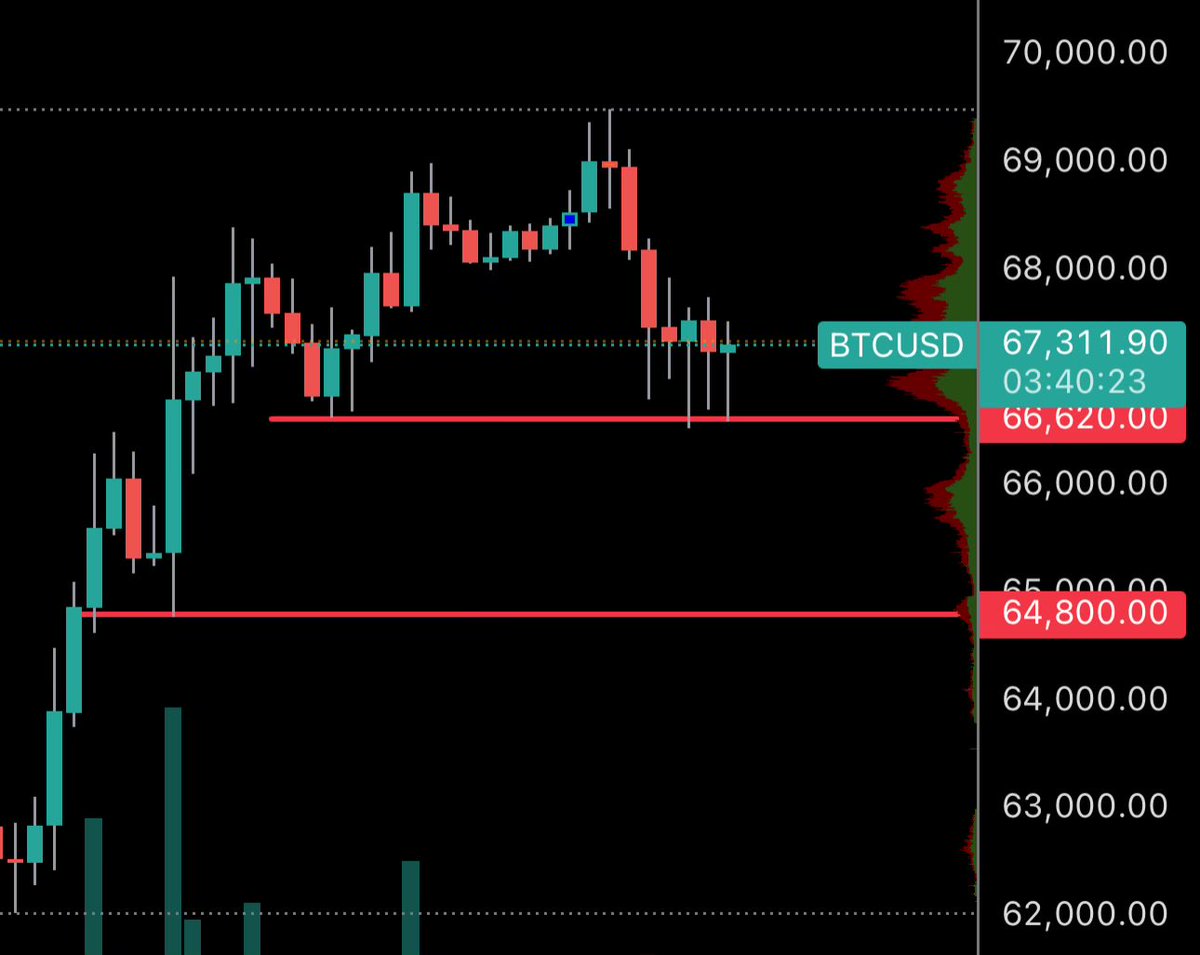
$BTC and #crypto There is a 90.879% chance we moon, very soon In conjunction with the previous post where I dropped a teaser on my thinking that we will break out rather soon, I made another big data analysis deep dive, just now, to not leave you stranded, and show you highly significant data, forming the basis of my stance of why I think it's time to break out to the upside. I have more data in my toolbox to support this, but I'm here to share the most basic and effective one to keep it light-hearted and to the point, easy to understand. My core thesis Indeed the fact that we have been ranging for 6 months is the basis of my thesis. We know and highly believe that markets are subjected to time and time is the strongest actor on price. Those are the fundamentals of Cycle theory and everything is built on it (Gann cycles, Elliot wave theory, Smart Money Concepts, you name it). But of course, 'a range' is not always easy to define, because, which ranges am I talking about, how can we compare this to ranges in the past? Technically, $BTC has been 'ranging' between 20k and 70k for nearly 5 years, with some deviations above and below. But we know there have been bull and bear markets in between which are hard to call 'a range'. So, before continuing, I first need to give a definition of how I defined a range in this analysis, where it begins, and where it ends, because there is a lot of discretion there. Definition of a macro range A range is a period of time of price moving up and down between two price points. Now, I personally limited those two price points to not be more than double from each other. So the move from range high to range low is no larger than a 50% drop. This is an arbitrary choice, but I think you can all agree that the drop from the top in May 2021 to the bottom in June 2021 should not be considered a range anymore, nor the rally from the low in June 2021 to the high in November 2021 either. Respective high-low differences are a -55% and -58% drop. So that is where I draw the line. And I also think we can all agree that the drop from the June 2019 highs to the covid crash lows are also not part of the same range, but instead an entire bear market on its own. All other price boundaries are indeed ranges. Next, I need to define when the range begins and ends. And with the number one theorem to define ranges: the midrange theorem, that is quite easy: 'a range begins and ends when it visits the midrange point for the first and the last time'. That's IMO very intuitive as, when you expect the price no longer to return to the midpoint, it also won't continue to range lows (if a breakout is coming) or range highs (if a breakdown is coming). So that definition also allows you to position at the midrange (the classic midrange consolidation) before breaking out or breaking down. In other words, this definition not only defines the range cleanly, it also is great for execution. And the cherry on the cake, this definition also automatically causes at least a 50% drop or 100% pump after a breakout by the nature of my definition. (otherwise, I would still count it under the same range). So now we have a proper definition and I can analyze what history has done and how long #bitcoin likes to range. Core data analysis & results So I chose to analyze from the moment CME group started trading, which is around the peak of 2017. I could go earlier but the CME cutoff suits a nice chart, price beforehand was rather naturally driven, and it's the first time 'boomers' stepped foot in the $BTC market. I could include even more data, but it doesn't change much to the thesis and as you will see, this is already very significant. Using our definition pointed out, I detected 18 ranges (excluding the one forming currently). A nice amount of data points that falls within the acceptability of our type of deep dive data analyses. All 18 ranges are marked in the purple box, with the lengths and widths defined as per definition. By the cleanliness of the chart, it clearly shows IMO how clean the definition is. And now we can do our statistical analysis: ➡️The average duration of a range is 14.7 weeks ➡️The standard deviation is 10.4 weeks Our current range has been lasting for 29 weeks, but tomorrow that will be 30. So, based on our definition and assuming a normal distribution (which is pretty normal as many things in nature follow a normal distribution, financial markets are no exception), The chance that price no longer revisits the current midrange after tomorrow (60.2k) = 90.879% This chance increases every week (time is on our side) For example, the chance that price no longer revisits the current midrange in 3 weeks = 93.790% Those percentages make sense, because out of 18 times, only once has the range exceeded the current standing duration, which was during the bottom range from June 2022 to Feb 2023. And (1-1/18) = 94.4%, which is in a similar ballpark. Conclusion Now, you know my stance of why I think this range will break up and not break down already as I've posted 3 highly reliable data analyses on that. On top, we have Q4 coming up and although it is meme-d a lot, it would be very unusual to have both October, November ánd December to be bearish, which is what you expect if you think this breaks down because if it turns down it will also be to break away from this range for the same reasons I just posted, truly a double edged sword. One that I indeed believe will be in our favor. So now you you know both the direction I expect this range to break and a time, and the latter may be running out very soon. We've been patient on waiting to position for a breakout and we have indeed been using the mindset to trade the range, but I have been promising you that, after buying the cycle bottom, I would start buying again heading into Q4 of 2024 for the second time this cycle for a breakout and hold for a significantly longer amount of time. Will you?


Meet Tubby Rainbow! 🌈 A vibrant character created by Matt Furie, blending elements of fantasy and absurdity with a playful, cartoon-like style. Furie’s art is known for its themes of friendship, humor, and boundless imagination, and Tubby Rainbow perfectly embodies this unique expression. #TUBBY #ETH Ca: 0x1b85021e755b054e19d8b52aa6788f376122046e