
Robin Kohrs
105 posts

Want to know how I made the Arctic sea ice animation? You can now the read the ‘How we made it’ section of our Climate Graphic: Explained newsletter on FT.com
ft.com/content/6d2685…
#dataviz
English
@Julian_H0ffmann they are so cool!:) Is there any preferred way to get vector-geodata into blender?
English


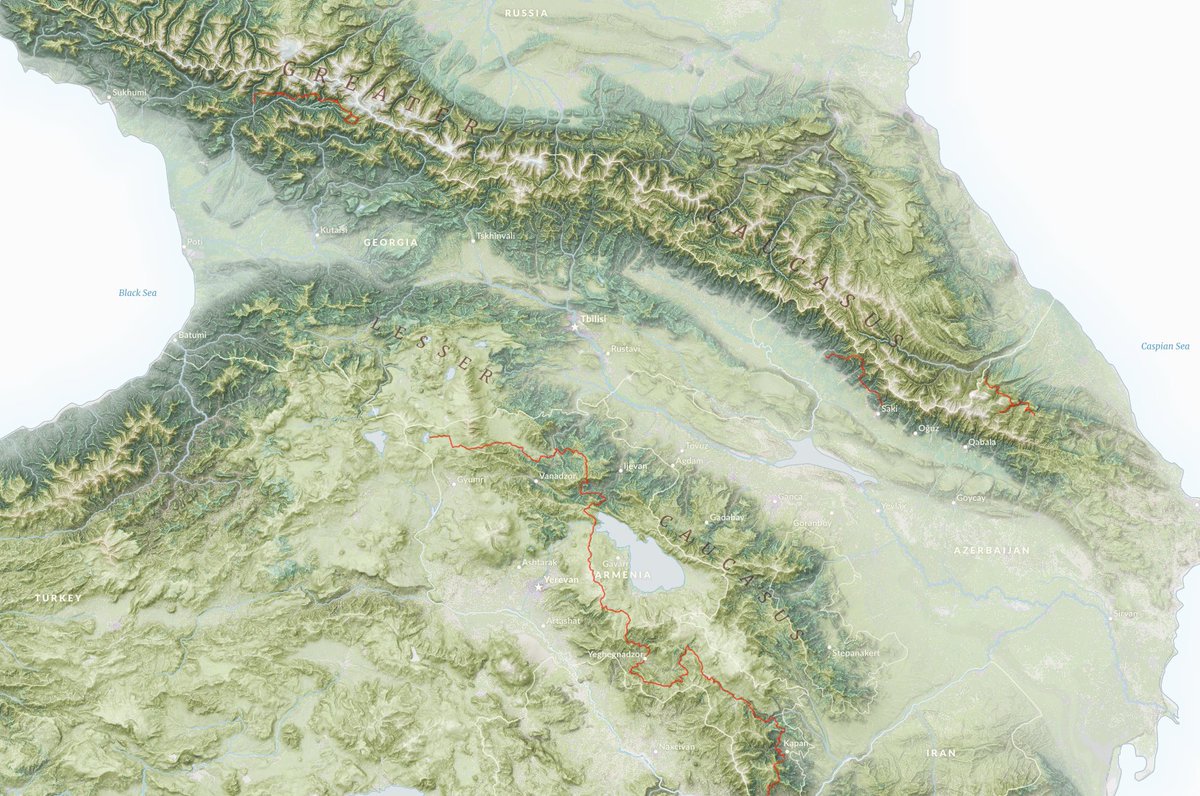
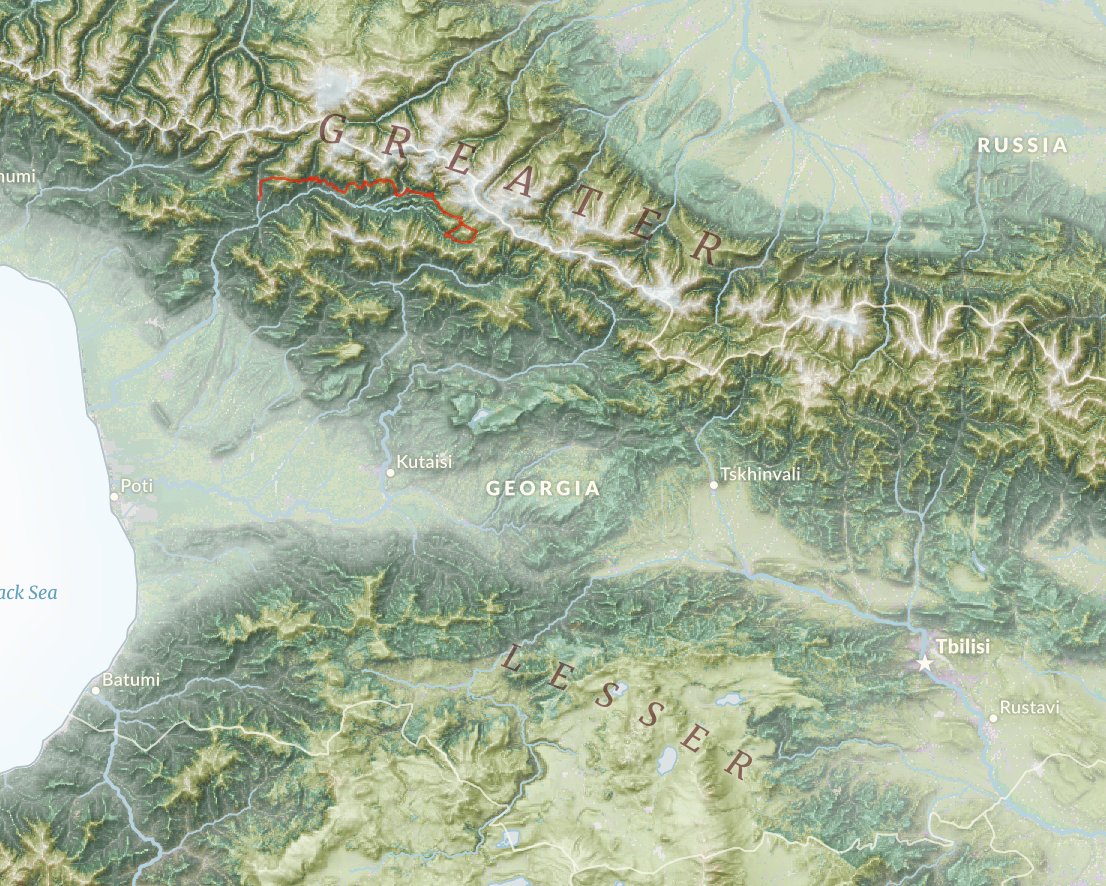
@verygoodmaps so fantastic!:) How do you get this nice contrast between the glaciers and the mountains?😮
English


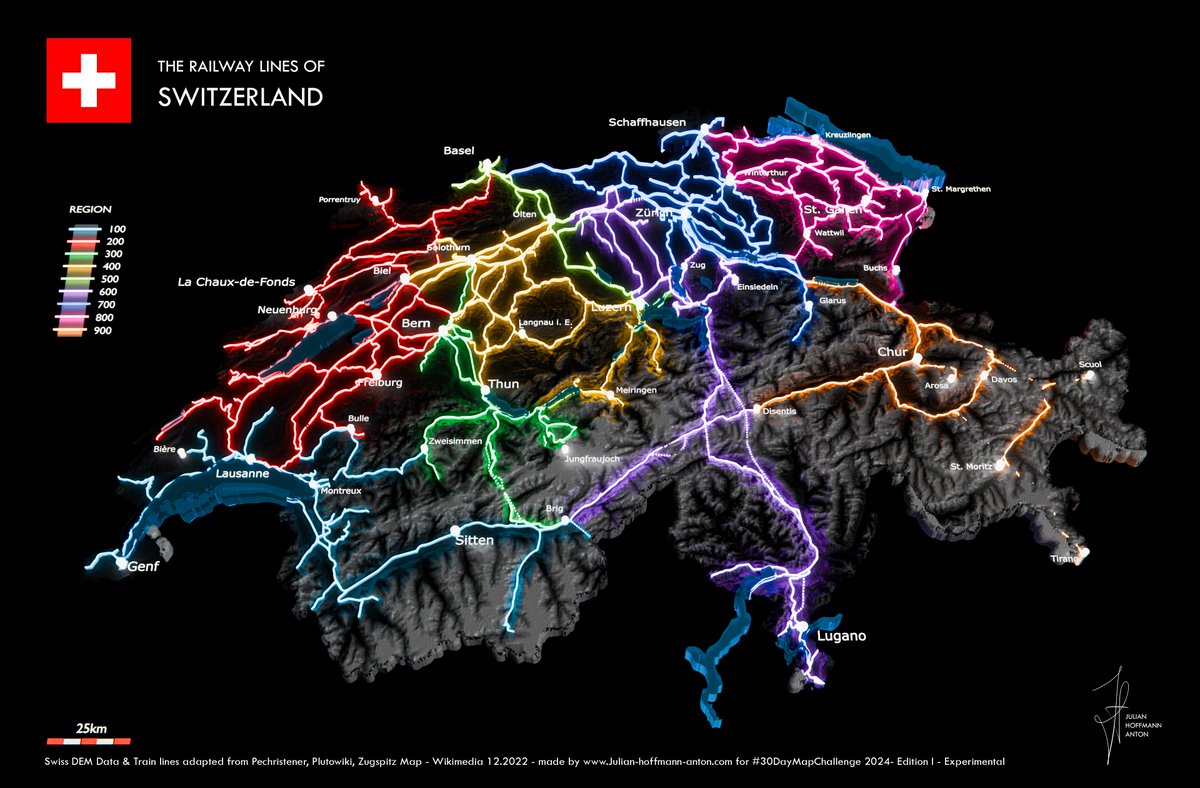
Day 6 of the #30DayMapChallenge - Raster.
I made this animation showing the excessive rainfall from Storm Boris last month in Europe, using precipitation data from Nasa
English
@_franz_xaver_ @RainerSchueller @derStandardat da das alles recht schnell gehen musste hat es sich bei 01:00 um einen Formatierungsfehler gehalten. Es war eigentlich 13 Uhr. Sorry
Deutsch

@RainerSchueller @derStandardat Leider ist bei großteils der Pegelstände der Aktualisierungsintervall viel zu groß. Z.b Korneubung: letzte Pegelaktualisierung
Samstag 01:00, stand Samstag 14:40...
Deutsch

Interaktive @derStandardat-Karte zeigt die aktuellen Pegel der Flüsse in Österreich #Hochwasser derstandard.at/story/30000002…
Deutsch
@shademap I'm yet not quite sure. But more an array of the times these points are exposed to sun
English

@KohrsRobin What data would you like to output for each point? Total number of minutes per year of sun or an array of minute by minute, etc
English
Demo showing how to use ShadeMap Sunchart to quickly find the sunniest baseball field in Central Park:
1. Load tree data for greatest accuracy (optional)
2. Pan to location
3. See direct sunlight amounts for every minute, day, or month of the year
#agriculture #agritech #solar
English
@shademap I bet there is a market!:) I don't have the data yet... But it could be (geo)json, csv, fgb... I actually started building something similar (much worse though....) and stopped haha🙈
English
@shademap Great thanks!:) I had something more "analytic" in mind than just visual inspection, but still awesome:)
English
@newgeographer2 That is so nice!:)😍 Any hint on how that shading works?😬
English
@PheniciaHH Hey:) Indeed they are:) You can send me a message here on twitter can't you?:)
English

@NickBearmanUK @KohrsRobin You should have it now. We will start in 5 minutes
English
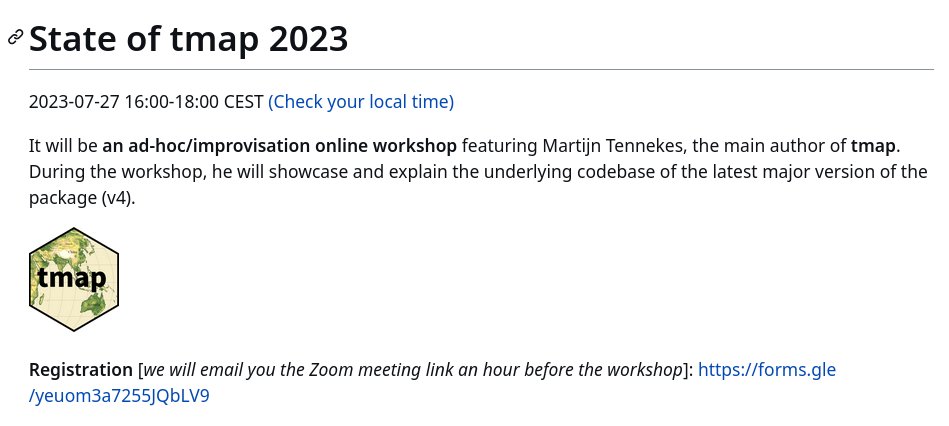
Join the "State of tmap 2023" workshop with Martijn Tennekes! 🗺️
Discover the latest major version (v4) and explore the codebase.
July 27, 16:00-18:00 CEST (check your local time at buff.ly/3K6OoIB)
Register now: buff.ly/46QwOSR
#rstats #rspatial #maps
English
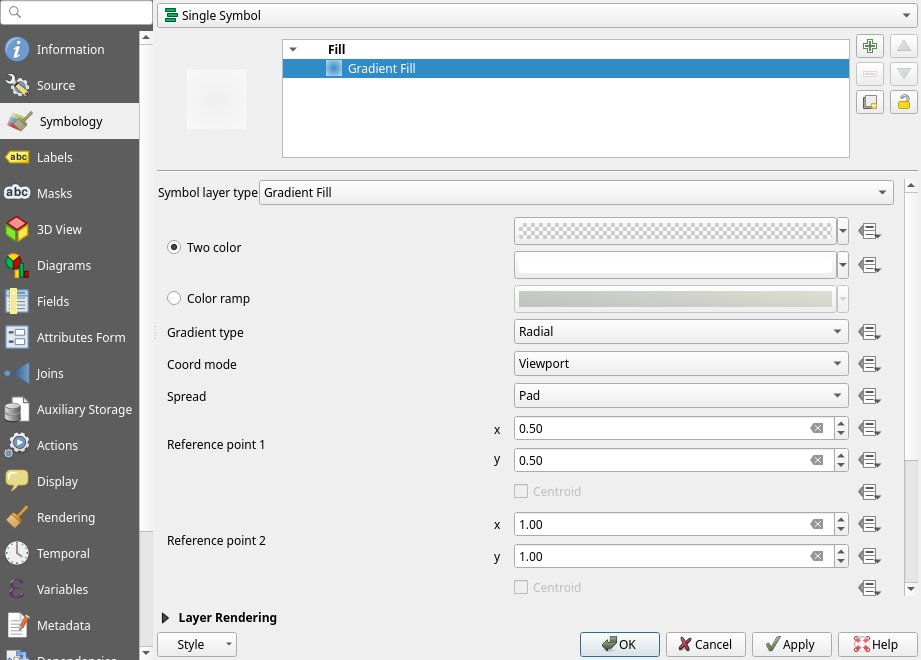
@MapTiler That's super awesome! Is it possible to use that somehow with the qgis plugin?:)
English

Keep your users up-to-date with the #heatwave using #maps. We have free weather layers that can be added to any MapTiler SDK map with a few lines of code:
maptiler.link/3K4gKTx
Always follow local advice on how best to stay safe in the heat.
English
@nyalldawson That is fantastic!:) also, any chance to know which keyboard that is which sounds so nice ? Haha
English
@newgeographer2 @GeoWithJustin How is that dynamic updating of the extent of the vector data possible?🙃
English


@sidapo_cartisan That's so awesome!!:) How do you get this foggy/misty look in the valles?:)
English

Come work with us☺️🖥️🧮🗺️📊🥧 Neben Zahlen und Daten gibt es oft ausgezeichneten Kuchen;)
derstandard.at/story/20001443…
Deutsch