@Everyday_Powers @CosmicSkeptic @rickygervais Jack, atheism is the human default. No child is born believer. Humans make other humans believe made up stories. This is the point.
English
MrSamprass
548 posts


$AMD Roadmap to top 10 Largest Market Cap 🧵 Chiplet-based Differentiator ✍️ Part 1: AMD's Chiplet-based platform may take 30% of entire custom silicon from hyperscalers and AI natives. AMD is winning in the hybrid customization space taking share from hyperscalers’ in-house $ARM CPUs (Microsoft’s Cobalt/Maia, where the company has signaled intent to shift more workloads to homegrown accelerators over time). @AMD secures high-value CPU + GPU bundles and specialized HPC/custom variants where x86 compatibility, performance, or rapid deployment matter. ~Modular design allows mixing AMD’s proven dies with customer-specific accelerators, memory ( HBM integration for Microsoft), I/O, or security features. ~Benefits: Higher manufacturing yields, lower costs, faster time-to-market, and workload-specific tuning without a full custom ASIC burden. ~Advanced packaging (2.5D/3D) and Infinity Fabric deliver high-bandwidth, low-latency communication. ~This creates a “middle ground” for customers who want optimization + software compatibility (ROCm + x86 ecosystem) rather than going 100% in-house like some Arm-based designs (Maia, Cobalt, Graviton). AMD continues to expand its semi-custom and custom CPU/GPU design wins with large customers, leveraging its mature chiplet architecture (Infinity Fabric + UCIe) and advanced packaging to offer a flexible “continuum of customization.” This allows hyperscalers and other big players to optimize for specific workloads (AI inference, HPC, training) while reusing AMD’s proven Zen CPU dies, CDNA GPU/accelerator dies, and ecosystem (ROCm software, Helios rack-scale systems). The strategy builds on AMD’s long success in gaming consoles and is now accelerating into AI/data center and embedded markets. At its 2025 Financial Analyst Day and subsequent updates, AMD highlighted over $45 billion (some reports cite $50B+ cumulative) in lifetime custom/semi-custom design-win content, with meaningful revenue ramps starting in 2026 and beyond Part 2: All current AMD large customers on customization and ongoing new customers Not Financial Advice!


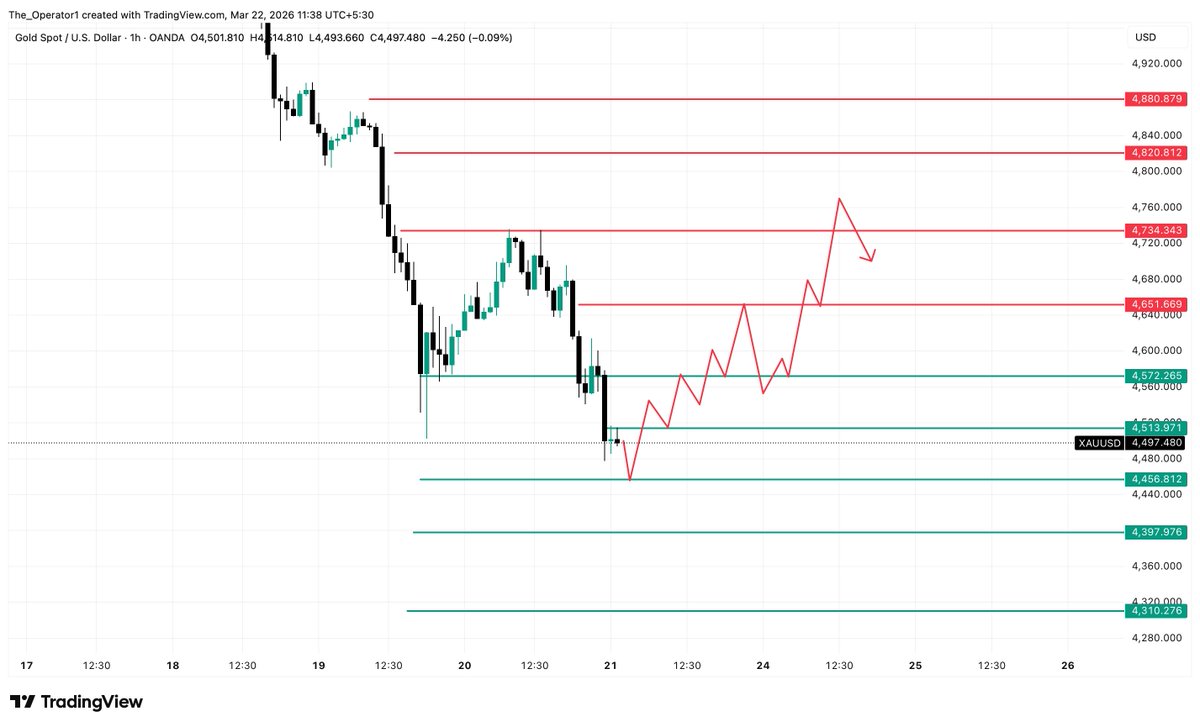
#XAUUSD 🚨 A MASSIVE LIQUIDITY TRAP IS FORMING RIGHT NOW… IF YOU MISS THIS ANALYSIS, YOU MAY MISS THE BIGGEST MOVE OF THE WEEK... The market just swept a major liquidity level,But the real move might not have started yet, Let’s break down the structure most traders are missing. 🧠 THE OPERATOR OF $XAUUSD 🥇 t.me/+hsj7tVDChXI0N… Hello everyone, I hope you all are doing well. ❤️ As per our last weekly analysis, the market delivered exactly the same structure we were expecting. Every key level we discussed played out perfectly. First, we saw the breakout above $5200, which turned out to be a classic buyers trap. I had also mentioned some important institutional selling zones, and the market respected them with absolute precision. From $5238, we saw a strong downside move, and by the end of the week the market also broke down below $5000, which was something we were already anticipating. If you want to understand the detailed reasoning behind this entire move, I have reposted my previous analysis below. Those who might have missed it can go through it and gain valuable learning about market psychology and structure. I truly hope my last weekly analysis helped many of you understand how the market actually thinks and moves. Now let’s discuss the fresh week structure, market psychology, and price action in detail. ⚡ MONDAY OPENING – THE $5000 LIQUIDITY SWEEP The first thing we saw today was a liquidity sweep below $5000 right after the market opened, and honestly this was expected. The reason is simple. Last week the market fell heavily and closed near $5020, which was very close to the previous Monday’s low. Because of this, many retail traders assumed that area as a strong support and opened fresh buy positions during the weekend close, placing their stop losses around $5000 while expecting an upside move. However, the overall structure was already bearish, and since the market closed near such an important low, it was very unlikely for price to immediately move upward. That is exactly why the market first swept the liquidity below $5000. Right now, after breaking below $5000, the market is trying to sustain again above $5000, which is making many traders believe that this might be just a liquidity sweep followed by a reversal. But the real question is: Will the market actually move up from here? Let’s analyze that. 📉 OVERALL MARKET STRUCTURE REMAINS BEARISH If we look at the overall structure, bearish pressure is still clearly present in the market. At the moment, the market is favoring the sellers, and that is something traders must keep in mind. The $5033 – $5056 zone will be extremely important not just today but also for the upcoming days. In my previous weekly analysis, I clearly explained that as long as the market stays above this zone, bullish pressure could remain. But once we get a breakdown below this area, strong selling pressure could enter the market. And that is exactly what we are seeing now. For the past few weeks, the market has been doing the same thing repeatedly: • First hunt old liquidity • Then create fresh liquidity • And later hunt that liquidity again So the plan is simple. As long as price stays below this zone, every top becomes a selling opportunity, and our main focus will be trapping buyers who enter late into the move. 🧠 WHY $5000 IS CREATING CONFUSION About two weeks ago, the market formed a low near $5000 and then sustained above that level for almost two weeks. Today we saw a liquidity sweep below that level, and now the market is again attempting to hold above $5000. Because of this, many traders are expecting a strong reversal. But from a market psychology perspective, things don’t work that way. Since the market already spent two weeks trading above $5000, it is unlikely to quickly accept that level again as support. On top of that, if you look at higher timeframes, you can clearly see bearish pressure coming from the top, and price action is also supporting that view. THE OPERATOR OF $XAUUSD 🥇 t.me/+hsj7tVDChXI0N… 🎯 INTRADAY STRUCTURE & RETAIL TRAP Currently, after the Asian session open, the market is clearly trying to attract buyers. The reason is obvious: $5000 is a psychological level. Whenever price trades near such levels, many random traders find it easier to take decisions because they can place tight stop losses around it. If you observe the 5-minute timeframe, you will notice a higher-low structure forming after the Asian session open. Because of this, many intraday traders are buying every dip, expecting the market to turn bullish. But from a psychological perspective, the market is simply inviting retail traders into the game again and keeping everyone confused. When $5000 broke, many random sellers jumped in. When the market reclaimed $5000, random buyers also jumped in. So right now, we are seeing a classic retail battle between buyers and sellers around $5000. ⚡ SCALPING STRATEGY FOR THIS RANGE For scalpers, the plan is very simple. Right now the market has created a range between $5000 and $5030. Inside this range: • When price invites sellers and shows a reversal on the 1–2 minute timeframe, look for quick buying opportunities. • When price invites buyers and shows rejection, look for short selling setups. Don’t try to capture big moves inside this range. Focus only on quick scalps. My personal advice would be that as long as price stays above $5000, focus more on buying setups, because the market is intentionally trying to show a bullish picture for now. We can use that illusion to trap sellers temporarily. 🚨 THE POTENTIAL SELLERS TRAP ABOVE $5030 If you notice today’s high, price has rejected that level multiple times. Because of the previous week’s bearish pressure, many traders are holding short positions with stop losses above today’s high. But the market is smarter than that. In my opinion, the market might continue playing with both buyers and sellers for some time, and later we could see a breakout above $5030. That move would trigger the stop losses of many sellers, increasing bullish confidence and attracting more buyers. And that is where the real trap might begin. THE OPERATOR OF $XAUUSD 🥇 t.me/+hsj7tVDChXI0N… 🔥 THE KEY REVERSAL ZONE The $5033 – $5043 zone could become the most important reversal area. From somewhere inside this zone, we could see a strong rejection, which might mark the top of this week. In my view, whatever high the market forms today could be defended for the next 2–3 days or even the entire week. Personally, I am patiently waiting to catch that top. 📊 WEEKLY TARGET IF BREAKDOWN HAPPENS If the market continues to hold above $5000 for some time, it will attract even more liquidity. And when we eventually see the third breakdown below $5000, it could trigger a very aggressive fall. That move could potentially push the market towards: $4940 – $4918 during this week. So overall, the market may first create a temporary bullish sentiment, trap traders, and then shift back to bearish momentum. 💬 FINAL THOUGHTS For now, this is the psychological and price action structure I am observing in the market. I hope this detailed explanation helps you understand Monday’s price action and the possible structure for the entire week. Wishing all of you a profitable trading week ahead. 🚀 THE OPERATOR OF $XAUUSD 🥇 t.me/+hsj7tVDChXI0N…


NOW - Trump: "We're gonna cut off all trade with Spain, we don't want anything to do with Spain."