MarketBulldog

1.9K posts

MarketBulldog

MarketBulldog

@Market_Tracker

Tracking the dynamics of equity and fixed income markets.

Katılım Haziran 2011
134 Takip Edilen96 Takipçiler
MarketBulldog
MarketBulldog@Market_Tracker·
@801010athlete Nice thing is $QCOM at this point was 58% above 50sma. But 5 weeks later stock was at same level (after nasty 3 week 28% drawdown from $14.34 back to $12.35) and briefly came within a hair intraday of touching 50 sma on 5/26/99. So let’s hope $ARM also consolidates for 4-5 weeks
English
0
0
0
605
PBA
PBA@801010athlete·
Is $ARM where $QCOM was here in 99(arrow)? Long base, big breakout, quick HTF. Both are like 5 wks out after first big ignite bar after long bases.
PBA tweet mediaPBA tweet media
English
13
10
186
21.3K
Don Vandenbord
Don Vandenbord@dvandenbord·
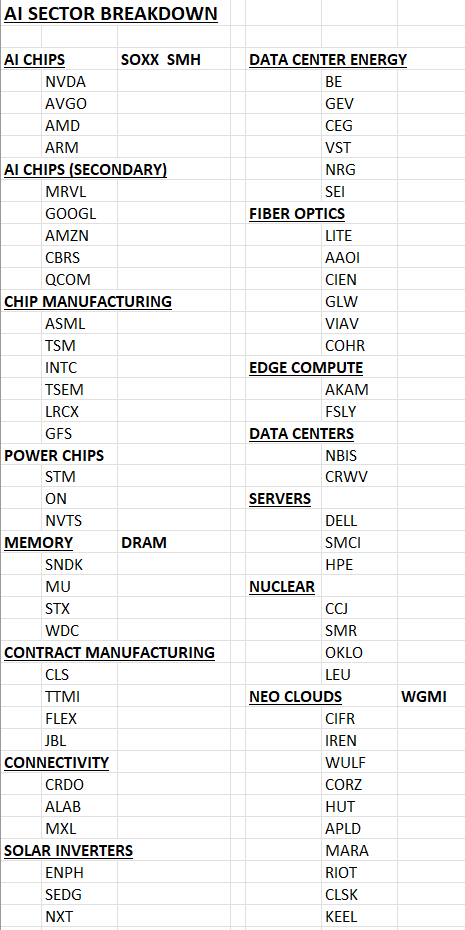
AI SECTOR BREAKDOWN - 65 STOCKS, 4 ETFs MANY HAVE A PRESENCE ACROSS MULTIPLE SECTORS WHAT'S MISSING?
Don Vandenbord tweet media
English
36
106
462
45.7K
Gene Munster
Gene Munster@munster_gene·
I have a bad habit of trying to guess what a stock will do the day after earnings. It's a bad habit because post-earnings trading has so much noise, it tells us almost nothing about the actual fundamentals. Now that the disclaimers are out of the way: I expect $NVDA to be up 1-2% today. It’s currently down 0.4% in the premarket (8:15a ET).
English
23
6
213
18.5K
Ariel Hernandez
Ariel Hernandez@RealSimpleAriel·
If I were to put my full macro hat on, there are certainly things I don't like about this market: - Bonds are trading at levels not seen since 07' - Crude is stuck near highs with really no resolution in sight. (Hormuz closed) - Breadth has been deteriorating under the surface - USD $DXY is not actually breaking down "as promised" by pundits. (bad for EM) - Rates are going to be stuck higher. - Inflation is a sticky mess. - Global tensions have not been resolved. - Stocks JUST had a historic vertical run! - Going into the summer when many hedge fund managers can just head off to the Hamptons. - I wouldn’t be entirely surprised if $750 on $SPY was the high for the next several months. I say all of that and I am long $ARM $DELL $DOCN $IGV $MU $NBIS $SNDK. Short via $SQQQ $AXTI. Ultimately my open positions and traction will dictate every move I make. But it's important for me to try and see both sides of the coin. P.S. NEVER go full macro!
English
35
18
334
34.4K
Shay Boloor
Shay Boloor@StockSavvyShay·
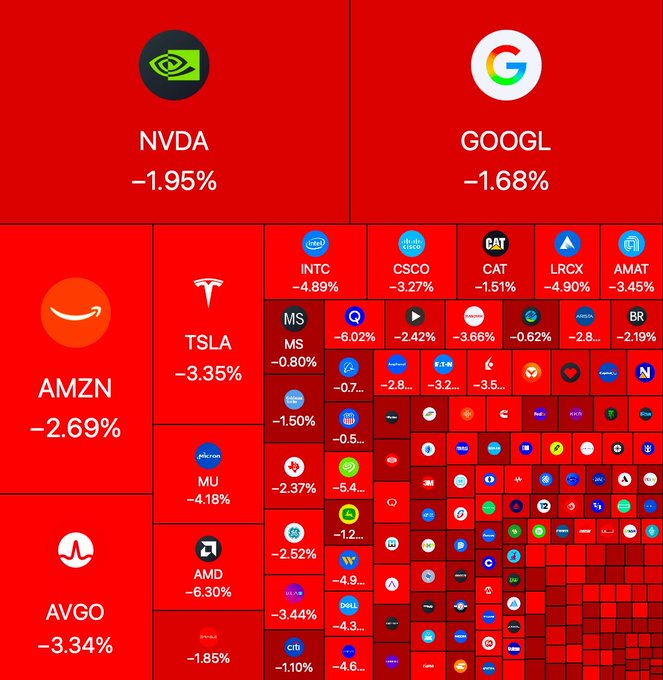
My favorite days as a long-term investor are the red ones. The same businesses get more interesting when prices go down and everyone else gets scared.
Shay Boloor tweet media
English
103
124
1.1K
67K
Steve Jacobs
Steve Jacobs@SteveDJacobs·
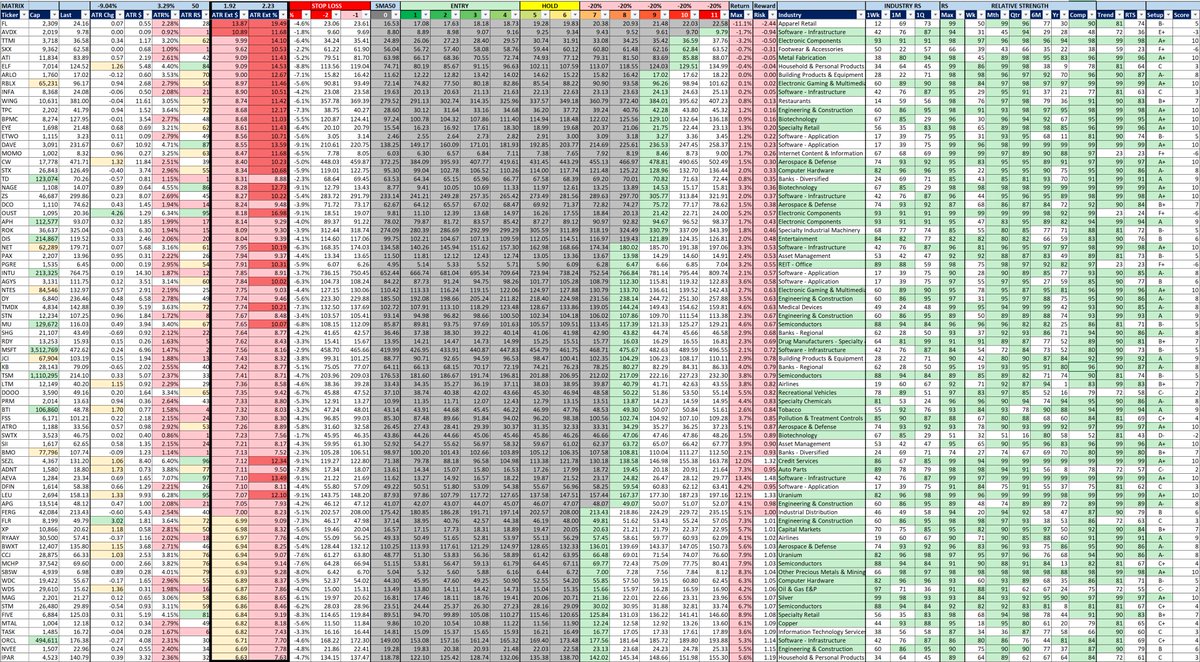
The ATR Matrix - Why Calculate Bands Using 'ATR $' & not 'ATR%'? Short(ish) Answer: When stocks with high ATR that are close to the SMA50, using ATR % to calculate the ATR bands/levels results in compounding which can lead to unrealistic expectations in short-term price movements. Using ATR $ (rather than ATR %) to express the ATR bands/levels provides a more conservative and realistic calculation of short-term price movements. Longer answer: When the "ATR Matrix" was initially created in Excel, the 'ATR Ext %' was used to align the ever excellent @jfsrevg and @DumbleDax awesome TV indicator 'ATR% multiple from 50-MA' (linked below) tradingview.com/script/oimVgV7… This indicator works really well when looking at the "where are we now?" in terms of current price to over extension - exactly what it was designed to do! It is an amazing concept/approach that Jeff & @RealSimpleAriel frequently refer to (and one that I learnt from them 🙏) when looking at a stock - "Focus on entering stocks that are between 0 and 4x ATR from the SMA50 and look to take partial profits as the stock moves above 7x" However, if drawing an "ATR Matrix" & calculating the ATR levels (from -2 to 11), challenges arise with high-ATR stocks when the entry is at/close to the SMA50. Let's take a recent "hot stock" real-world example to illustrate: PONY at the time of writing current price of $12.65 and a 17.47%, giving an ATR expressed in dollar terms of $2.21. So there are two possible approaches. Approach 1) Calculate ATR Bands/Levels by 'ATR $' Each band/level being the price of the current band + the ATR $. The formula, which is linear, for this is: SMA50 Price + (n*ATR$) Level 0 SMA 50 = $11.85 Level 1 SMA 50 + ATR$ = 11.85 + $2.21 = $14.06 Level 2 SMA50 + (2xATR$)= 11.85 + (2x$2.21) = 16.27 ... Level 11 SMA50 + (10xATR$)= 11.85 + (10x$2.21) = 36.16 Approach 2) Calculate ATR Bands/Levels using 'ATR %' Each band/level being the price of the current band multiplied by (1+ ATR%). The formula, which is exponential, for this is : SMA50 Price * (1*ATR%)^n Level 0 SMA 50 = $11.85 Level 1 SMA 50 * (1 + ATR%) = 11.85 * 1.1747 = $13.92 Level 2 SMA 50 * (1 + ATR%) * (1 + ATR%) = 11.85 * 1.1747 * 1.1747 = $16.35 ... Level 11 SMA 50 * (1 + ATR%)^10 = 11.85 * (1.1747)^10 = $69.65 So you can see using $PONY as the example, by band 11, the ATR% results in a target 92.6% higher. Could $PONY go to this price? Sure, just look at $NVDA over the past few years. Will it go to this price in the next few weeks or months? It's possible, but a lot less likely as this would be a parabolic move. Anchoring and recency biases would be strong with people more inclined to lock in (some) gains of a nearly "6 bagger" if the move was weeks/months and not years. In practice, I display the 'ATR $' and 'ATR %' extension side-by-side but calculate the bands and sort by 'ATR $'. Most stocks have lower ATR's (the average ATR of stocks with $1B+ cap is currently 3%) so the difference is small however swing traders who want to compound their accounts quickly typically focus on high ATR/ADR stocks of 4%+ so by being conservative, we can hopefully be pleasantly surprised if the stocks blasts upwards through all the bands. In summary, 'ATR %' is an excellent approach for assessing the current over-extension, but 'ATR $' is more practical and conservative for setting linear price bands. Hope this helps @MattBarkley and hope you are well. Best of luck! 🍀
Steve Jacobs tweet mediaSteve Jacobs tweet media
Matt Barkley@MattBarkley

@SteveDJacobs I'm still so impressed by this.. thx for sharing!! How is ATR Ext $ calculated? Curious as to why you sort it by $, feel like I've seen it sorted by ATR Ext % too

English
5
5
34
6.2K
MarketBulldog
MarketBulldog@Market_Tracker·
@RealSimpleAriel A Saturday video….yeeeessssss! 👍🏻🙏🔥👍🏻🙏🔥👍🏻🙏🔥
English
0
0
1
67
Ariel Hernandez
Ariel Hernandez@RealSimpleAriel·
5/16/2026 Daily Recap: Bulls ready for the Hamptons? - $QQQ $SPY small change in character recently with the deterioration in breadth under the surface. - Hit with a gap down on Friday and closed near the lows. - I personally think it's healthy for things to go sideways a few weeks here, but I've been getting lots of pushback on that idea as if "this time is different" - $XLE best group on Friday with many constructive names going into next week. - Hard to imagine I play anything $USO related just because of how new driven that group will be. Maybe it's the wrong idea but I will stay patient for the AI trade to just tighten back up. - Neo clouds and the space theme will still be two groups at the top of my list. $NBIS $CIFR $WULF $CORZ $RKLB $LUNR $PL - Semiconductors coming under the smallest bit of pressure and it seems completely reasonable to think that group could rest for a few more weeks $INTC $AMD $MRVL $ARM $MXL $NVDA $AVGO $TSM. - $CIBR $CRWD $PANW $FTNT $DDOG a group I will watch for any consolidation to see if I can hop abord what feels to be a frenzy of institution accumulation. - Solar names coming back to life in a big way recently. $ENPH $SEDG $NXT. It's always nice when we get another group to trade. - Gold $GLD Silver $SLV and Copper $COPX coming under some pressure on Friday. I don't love the positioning picture for copper. - I also don't love seeing the US Dollar come to life $DXY. Typically a strong dollar = bad for emerging markets. Emerging markets also include South Korea which is basically all SK HYNIX and Samsung. Not something I will panic over but will keep a close eye on that relationship if the dollar strengthens. - Still lots to be optimistic about but patience for new merchandise feels like the right move or smaller size.
English
27
12
217
17.6K
MarketBulldog
MarketBulldog@Market_Tracker·
@SRxTrades This is the recipe Time to start cooking The kitchen is hot 🔥
English
0
0
0
111
Sean trades
Sean trades@SRxTrades·
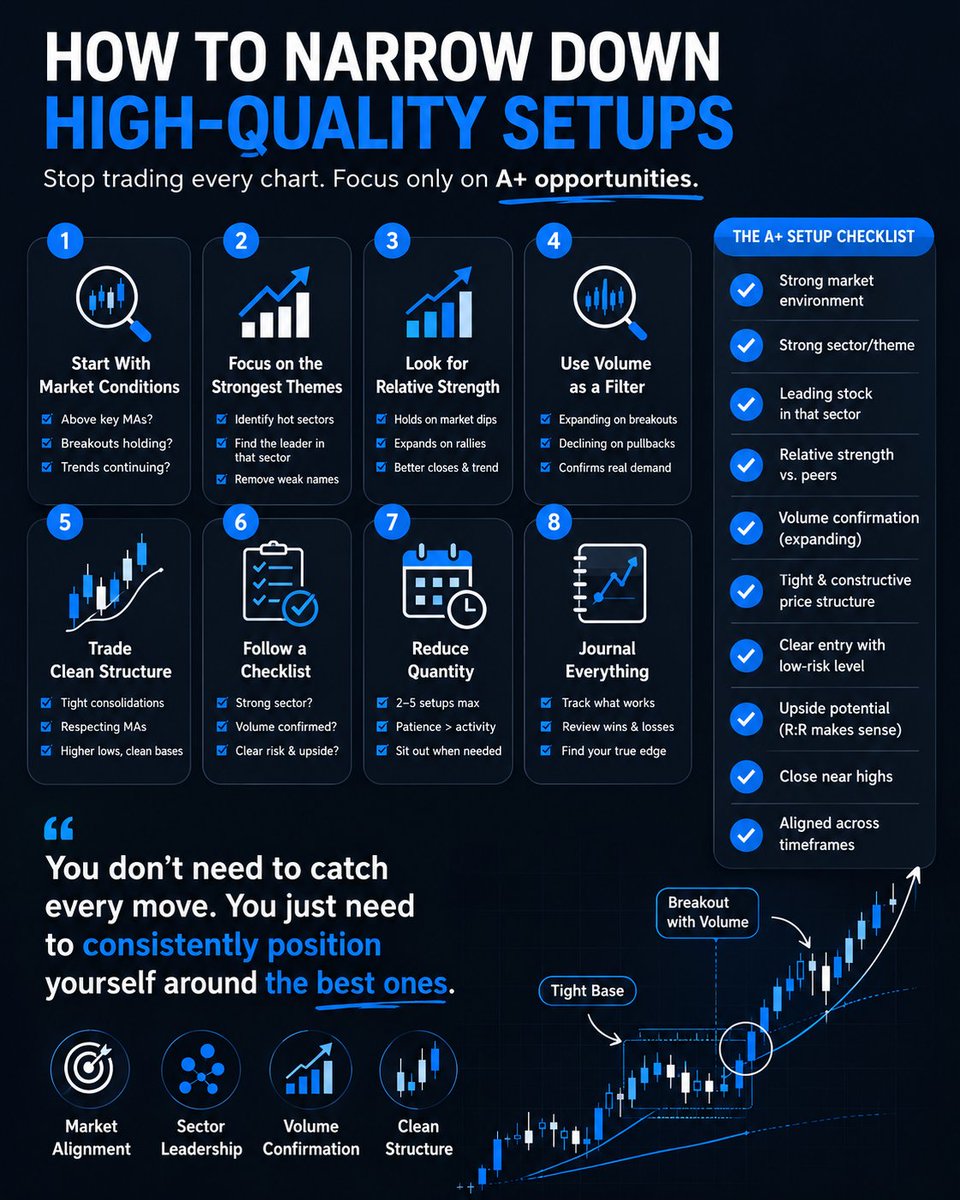
One of the biggest mistakes traders make is trying to trade every setup they see. The goal is not to find MORE trades. The goal is to find the BEST trades. Most traders don’t lose because they lack good entries... they lose because they lack filters. Here’s how I personally narrow down setups and focus only on A+ opportunities: 1. Start with market conditions Before I even look at individual stocks, I want to know what type of market we’re in. -Are breakouts working? -Are stocks holding gains? -Is there trend continuation? -Are we above key moving averages? If the market is choppy, I already know I need to: -Reduce size -Reduce trades -Be more selective Or sit in cash 2. Focus on the strongest themes Money moves in sectors and themes. AI. Semis. Robotics. Space. Instead of scanning random charts, I want to identify: The strongest sector Then the strongest stock inside that sector (The liquid leaders) 3. Look for relative strength The best setups show strength BEFORE they break out. Examples: Market pulls back → stock barely pulls back Market chops → stock tightens up Market rallies → stock expands aggressively Those are leaders. If two charts look similar, I’ll always choose: -Better relative strength -Better closes -More tigthness -Better volume patterns 4. Volume is non-negotiable Volume tells you whether institutions are involved. I always ask: “Is money actually pouring into this stock?” If the answer is no, I usually skip it. You want to see volume decreasing on a pullback and increasing on a break of range 5. Trade clean structure The best setups are usually simple. I want charts that are: -Tight -Constructive Respecting moving averages -Consolidating cleanly -Building higher lows -Closing near highs I avoid: -Loose action -Huge wicks -Choppy ranges -Overextended names Clean structure = easier risk management. 6. Reduce quantity You do NOT need: -100 watchlist names -50 open positions -Constant action Some of the best trading weeks come from: -4-5 great setups -Proper sizing -Patience At the end of the day, narrowing down setups is really about alignment. -Market -Sector -Leadership -Volume -Structure When all of those align together, that’s when high probability setups appear. You don’t need to catch every move. You just need to consistently position yourself around the best ones.
Sean trades tweet media
English
20
50
388
20.5K
MarketBulldog
MarketBulldog@Market_Tracker·
@Scot1andT @RealSimpleAriel $CRCL was an important short-lived exception. $31 offer price. Opened at $69 and closed at $83. 11 trading days later it hit $299. It then faded over 8 months to $50 low📈📉
English
0
0
0
257
Scot1and 🍀💵
Scot1and 🍀💵@Scot1andT·
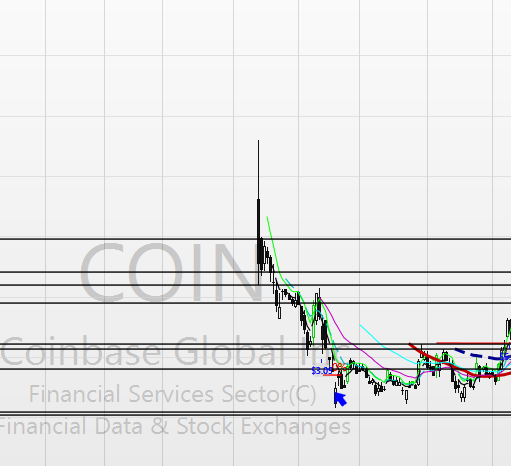
when they open an IPO hot its usually dead money for months. $CBRS $COIN
Scot1and 🍀💵 tweet media
English
5
9
97
19.2K
MarketBulldog
MarketBulldog@Market_Tracker·
Is now the time to buy $CBRS? It’s 70% above $185 offer. First day dynamics rhyming with $CRCL opening last year which then tripled in 3 weeks. @RoyLMattox @WesleyJMattox
English
0
0
1
356
MarketBulldog
MarketBulldog@Market_Tracker·
$CBRS now trading live and coming in white hot 🔥 $327 vs $185 offer @grassosteve
English
0
0
2
6.9K
PBA
PBA@801010athlete·
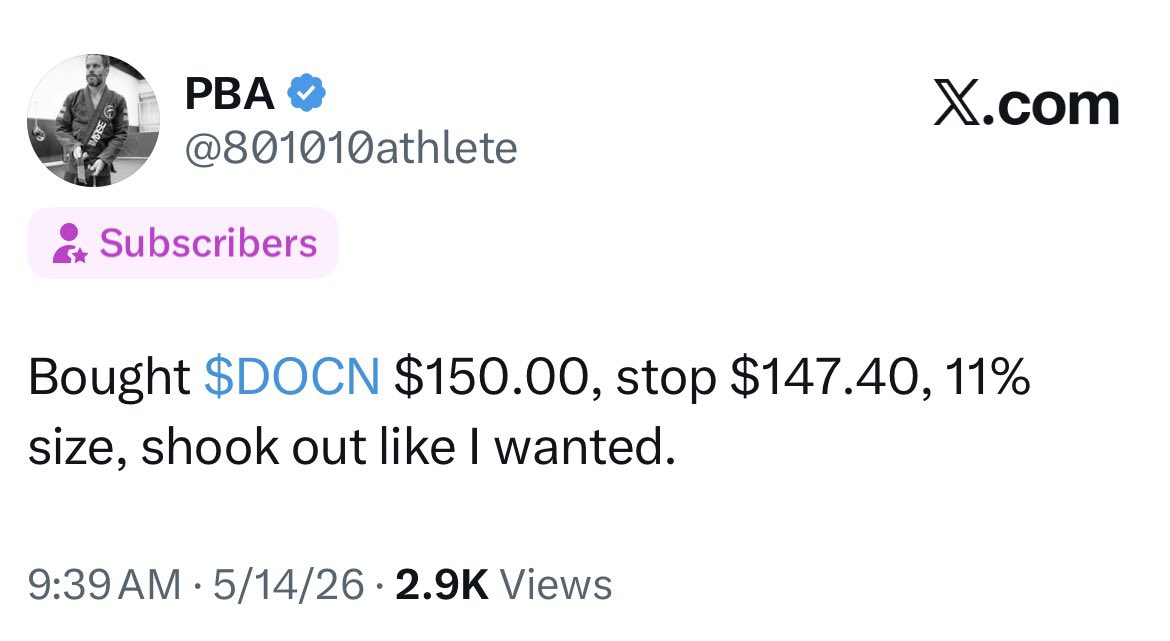
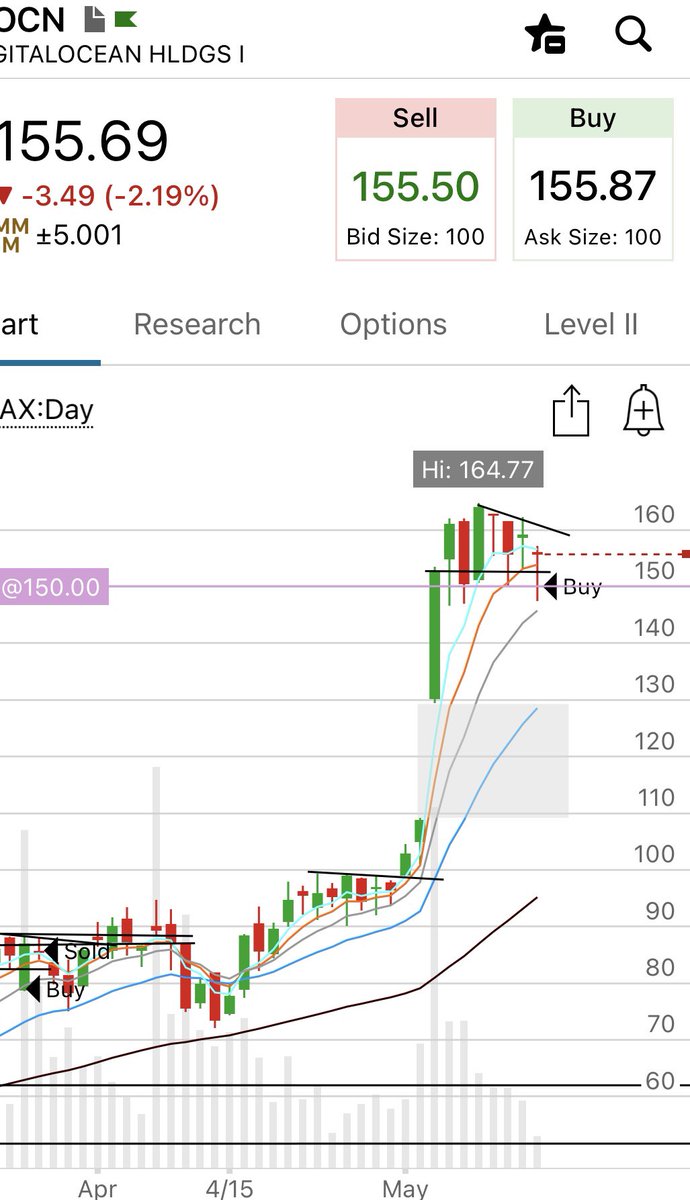
U&R Lifestyle $DOCN
PBA tweet mediaPBA tweet media
English
6
2
59
7K
Christian Flanders
Christian Flanders@CFlanders7·
I have never, ever in my time trading or in any historical look back seen this many institutional quality highly liquid names up 100%+ in less than 6 weeks. Very curious to see what happens going forward.
English
23
20
450
29.8K
MarketBulldog
MarketBulldog@Market_Tracker·
29 days ago the Nasdaq was 7% *below* the 200 sma. Now it’s barely 15% above. You ain’t seen nothing yet. $QQQ @RealSimpleAriel
English
0
0
0
38
MarketBulldog
MarketBulldog@Market_Tracker·
Is this the week the fever finally breaks? 🥵📉 Or has the melt-up only begun?🔥📈 $INTC $MU $MXL $SOXL @RealSimpleAriel
English
0
0
1
286
Ariel Hernandez
Ariel Hernandez@RealSimpleAriel·
5/10/2026 Happy mothers day! Markets are extended, here is my plan. - $XLK extends itself another 3.44% on Friday and now sitting over 10x ATR from the 50sma. - $SMH continues its monster run after the 1 day pause on Thursday $AMD $MU $INTC $QCOM - $UFO ready for takeoff. Lead by $RKLB and their best quarterly report to date. $PL $LUNR - $IGV multi month highs on Friday and we are seeing software names have fantastic reactions to their individual earnings reports. $DOCN $TWLO $FROG $FTNT $AKAM - Financials are a little bit of a red flag but the market seems to be brushing it off for now. $JPM $BAC $WFC $V $MA all living below the 200sma. Not going to make a big deal out of it for now. - We are starting to get into an acceleration phase for these memory and semiconductor names. Hard to know what the market does after those names decide to pullback. - My focus will be on all the names that have been recent earnings winners to see who holds up best. $AAON $AKAM $DOCN $FLEX $FTNT $HUT $INOD $MXL $SIMO $SITM $TWLO $RKLB $FROG $FLNC and many others.
English
17
15
287
21.7K
MarketBulldog
MarketBulldog@Market_Tracker·
@MJYeoman1 @SteveDJacobs ….I went back to 2010 and started seed at beginning. So initial value is your first 14 day average. Then next value is (13*previous Wilder ATR + the current ATR) /14 Rolling forward to today yields today’s 7.33 ATR value
English
0
0
1
57
Michael Yeoman
Michael Yeoman@MJYeoman1·
@SteveDJacobs How do you calculate the ATR% and ATR Ext? For MXL I have 15.89% and ATR Ext of 9.33%. Obviously I am not mathing correctly...
English
3
0
1
19.6K
Steve Jacobs
Steve Jacobs@SteveDJacobs·
📈Leading Stocks In Leading Industries ⚠️Notice ALL the 'semiconductors' stocks are extended at 7x or greater ATR-to-SMA50 (Stage 2C) Each table includes: - Stage Analysis - ATR% - ATR Extension to SMA50 - Reward-to-Risk (projected) This can be useful when building your watchlist 👀as you want to "focus on leading stocks in leading industry groups" - William O'Neil. * top 20% (30 Finviz Industries)
Steve Jacobs tweet media
English
3
8
34
2.9K