Matthias Kullowatz

7.6K posts

Matthias Kullowatz banner
Matthias Kullowatz

Matthias Kullowatz

@MattyAnselmo

Data scientist @datarobot. Co-founder https://t.co/PUN0SMh4ya and @analysisevolved. @mattyanselmo.bsky.social #rstats he/him

Seattle, WA Katılım Nisan 2012
694 Takip Edilen1.7K Takipçiler
Sabitlenmiş Tweet
Matthias Kullowatz
Matthias Kullowatz@MattyAnselmo·
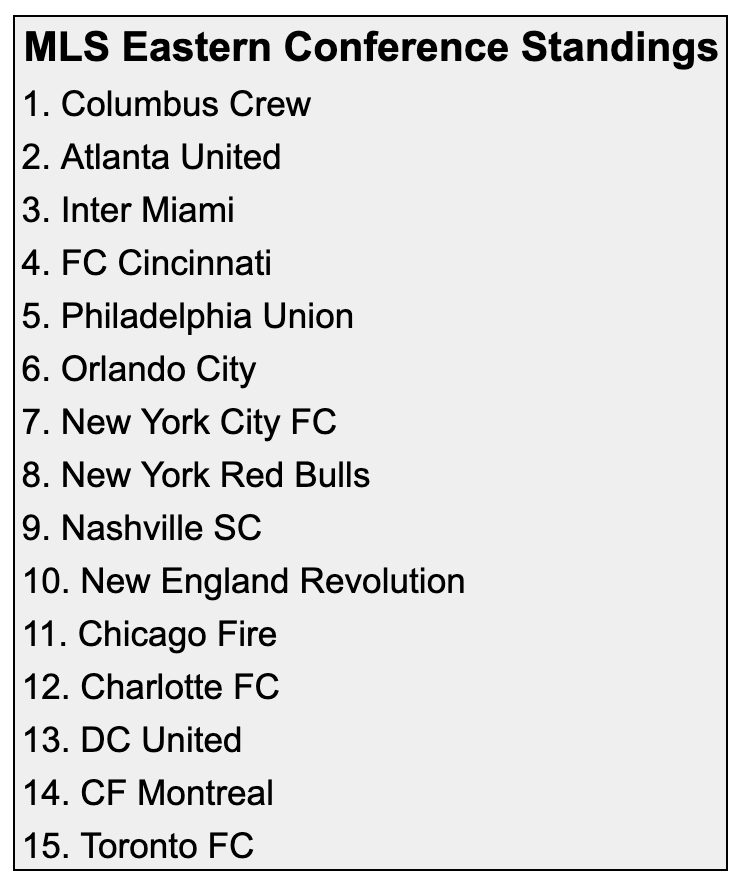
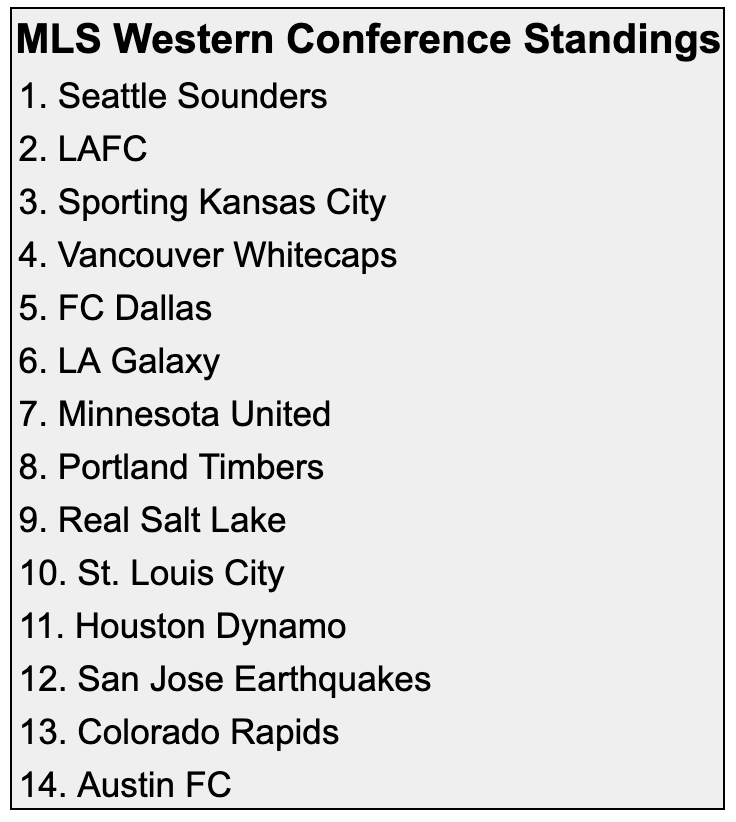
Continued some research on measuring how well individual soccer players play defense. Last time it was in open-play phases, and this time I tried to allocate defensive value on set piece plays: americansocceranalysis.com/home/2023/4/7/…
English
1
3
12
4.2K
Matthias Kullowatz retweetledi
NWSLPA
NWSLPA@nwsl_players·
Today, the Players are proud to announce the creation of the Om Arvind Gift in honor of the life & legacy of soccer journalist and women’s soccer advocate Om Arvind. Read more at ⬇️ nwslplayers.com/news/nwsl-play…
English
4
65
153
50.7K
Matthias Kullowatz
Matthias Kullowatz@MattyAnselmo·
If you are actually looking for metrics to complement xGD in team predictions, consider other flavors of EPV metrics. Something like the average of the maximum EPV in each possession, or the average starting EPV of each possession.
Tiotal Football@TiotalFootball

Mostly I want to make the point that xG and EPV type metrics are doing the same thing/ using a similar framework (goal probability) just at a different level of accounting. It’s why that 2008 @soccermetrics post imagines “an expected goal value” broadly defined (not just shots)

English
0
1
3
1.4K
Matthias Kullowatz
Matthias Kullowatz@MattyAnselmo·
I was able to explain nearly 90% of the difference between xGD and g+Diff (i.e. R2 = 0.9) with these two things: 1. How much passing value is lost to imaginary receivers on incomplete passes. 2. That g+ is built on a two-possession outlook, rather than just current possession.
Tiotal Football@TiotalFootball

hey @AnalysisEvolved, remind me what would be the major sources of difference above or below this trend line for team g+ diff vs xGD? Each dribble/pass turnover hands EPV over to the other team via interrupting g+ right? Is it just the mix of dead ball vs open play turnovers?

English
0
0
9
7.2K
Picks with the Professor
Picks with the Professor@ProfessorSides·
@isureppin12 @SethWalder @minakimes From my experience it’s about a 50% pay cut to go from a good industry position to sports. Hours and stress probably about the same, but in industry they compensate you for it. Supply and demand — sports jobs are fun and sexy so the people willing to do it increases.
English
2
0
4
514
Seth Walder
Seth Walder@SethWalder·
Another: you think analytics staffers choose to work in the NFL because of the *pay*? Everyone needs data scientists. Who do you think pays more: the Raiders or Amazon?
Seth Walder tweet media
ProFootballTalk@ProFootballTalk

The NFC Championship turned when Lions coach Dan Campbell opted not to kick a field goal (and in turn to take a three-score lead) with seven minutes left in the third quarter. There are lessons to be learned from that decision. nbcsports.com/nfl/profootbal…

English
57
98
1.4K
471K
Matthias Kullowatz
Matthias Kullowatz@MattyAnselmo·
@VictorPontes070 @STLCinderace @AnalysisEvolved g+ has been calculated before on European leagues, though it is not published. Between about 2015-2022, I believe Messi had 5 of the top 10 seasons. Ronaldo had one or two seasons in the top 10 over that time period.
English
1
0
1
44
Victor0770
Victor0770@VictorPontes070·
@MattyAnselmo @STLCinderace @AnalysisEvolved Hello, I would like to ask something about g+ if you can answer, will one day be this statistic exposed in the top 5 leagues europeans? It would be very interesting to see the records, or even the numbers of Messi and Ronaldo at their peak.
English
1
0
0
79
Matthias Kullowatz retweetledi
American Soccer Analysis
American Soccer Analysis@AnalysisEvolved·
Decision Day is nearly here! @MattyAnselmo simulated MLS playoff outcome probabilities based on the new playoff format & the strength of teams, as measured by both team-level metrics and player-level metrics according to the best combined lineup of each team's last two games.
American Soccer Analysis tweet media
English
5
13
64
45K
Matthias Kullowatz
Matthias Kullowatz@MattyAnselmo·
@colinalber10 @AnalysisEvolved Note that Western Conf teams are extremely likely to go on the road for the final, based on total points, and all their conditional cup final probabilities are thus <50% because of the huge home-field advantage we've observed in MLS for years. (e.g. STL is 4/13 to win cup final).
English
0
0
0
22
Matthias Kullowatz
Matthias Kullowatz@MattyAnselmo·
@HellbenderSTL @AnalysisEvolved 2 is definitely arbitrary, just trying to automatically capture likely lineups. To clarify, the player g+ itself averages the player's entire history in our database, with more weight to recent games. 2-game cutoff is just for determining likely lineup.
English
0
0
1
16
Matthias Kullowatz retweetledi
Backheeled
Backheeled@Backheeled·
𝑻𝒉𝒂𝒏𝒌 𝒚𝒐𝒖! All of our subscription revenue from June is headed to TOPSoccer, a program for children with disabilities! We raised enough money to help purchase new equipment for local TOPSoccer clubs. Read more ⤵️ backheeled.com/thank-you-for-…
English
0
2
14
7.8K
American Soccer Analysis
American Soccer Analysis@AnalysisEvolved·
For the first time in the sordid history of our organization, we were granted a media vote for the 2023 #MLSAllStar game. This is the team we submitted, made up of the g+ leaders at each position, which is unimpeachable. Let us know how much you agree in the replies below. #MLS
American Soccer Analysis tweet media
English
22
5
102
45.3K
Matthias Kullowatz
Matthias Kullowatz@MattyAnselmo·
@AnalysisEvolved @bbmikej Back of the envelope: typical MLS club scores like 1.5 goals per game. In predictive models, 60% of a team’s g+ over average is stable to future games. So if that 3.56 is like 2g+ over average, then this team would be predicted to score about 1.5+0.6x2=2.7 goals per game.
English
1
0
3
492