
Mind Math Money

11K posts

Mind Math Money banner
Mind Math Money

Mind Math Money

@MindMathMoney

Charts. Logic. TA. Psychology. 350K+ Subscribers on YouTube @MindMathMoney 🔗 https://t.co/hPeSIgS3t8 ⚠️ Not financial advice

Sweden Katılım Mayıs 2019
612 Takip Edilen13.1K Takipçiler
Mind Math Money
Mind Math Money@MindMathMoney·
@KobeissiLetter A 20% toll on cargo through the world's busiest oil chokepoint doesn't stay with the shipper. It shows up in fuel prices everywhere else a few weeks later.
English
0
0
0
9
The Kobeissi Letter
The Kobeissi Letter@KobeissiLetter·
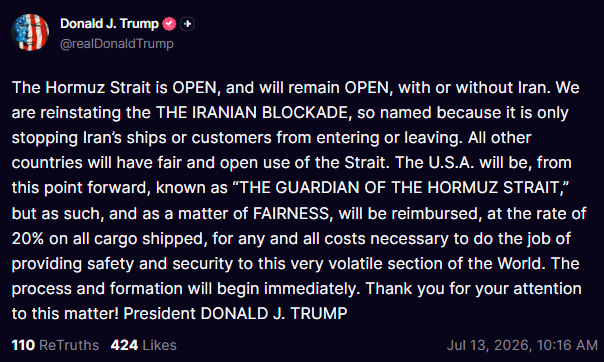
BREAKING: President Trump says the US is reinstating its blockade of the Strait of Hormuz for Iranian ships and customers. Trump says the US will now be known as "The Guardian of the Strait of Hormuz" and will be "reimbursed" at a rate of 20% on all cargo shipped. It appears the US is now imposing a blockade and fees to transit the Strait of Hormuz.
The Kobeissi Letter tweet media
English
260
286
1.7K
173.5K
Mind Math Money
Mind Math Money@MindMathMoney·
@MasterCryptoHq Sitting on cash instead of buying is still a position. It just doesn't get the same headline as adding to the stack.
English
0
0
0
5
Mind Math Money
Mind Math Money@MindMathMoney·
@AkaBull_ When every asset sells off together like this, that's leverage getting called, not a fundamentals story.
English
0
0
0
4
BitBull
BitBull@AkaBull_·
Why is everything selling off at once? More than $1.5T was wiped from global markets in just 10 hours. Bitcoin, gold, silver, Asian equities all under pressure. The main drivers look clear: fresh U.S. attacks on Iran are raising oil and inflation risks, possible BOJ yen intervention could force wider deleveraging, and rising bond yields are making financial conditions tighter. This is less about one asset and more about a broad risk-off move across markets.
BitBull tweet media
English
33
32
95
6.5K
Mind Math Money
Mind Math Money@MindMathMoney·
@AlexMasonCrypto If you'd actually called every top and bottom for 15 years straight you wouldn't need to post the targets. You'd just be quietly rich and nobody would know your name.
English
0
0
0
26
Alex Mason 👁△
Alex Mason 👁△@AlexMasonCrypto·
Bitcoin just entered the exact level where every bull trap ends. Fakeout is in the final phase, and Bitcoin will dump one last time before the next cycle begins. $62K → $58K → $48K → $87K → $200K Next stops: → $58K in August → $48K by October → $87K next year Reminder: I’ve called all the market tops and bottoms for the last 15 years, including the Bitcoin bottom at $16,000 and the top at $126,000. The next call will be even more important. I’ll post it here publicly like I always do. Turn notifications on. If you’re not following yet, you’ll understand why that was a mistake later.
Alex Mason 👁△@AlexMasonCrypto

I have perfectly predicted this pump. Now Bitcoin follows a descending channel pattern. $126K → $62K → $82K → $59K → $64K (fakeout). Reminder: I’ve called all the market tops and bottoms for the last 15 years, including the Bitcoin bottom at $16,000 and the top at $126,000. The next call will be even more important. I’ll post it here publicly like I always do. Turn notifications on. If you’re not following yet, you’ll understand why that was a mistake later.

English
21
4
53
16.4K
Mind Math Money
Mind Math Money@MindMathMoney·
@alphaticaio Mapping all four outcomes before the print is the actual edge. Most people only prepare for the one they're hoping happens, then panic when CPI hands them a different one.
English
1
0
0
19
Alphatica
Alphatica@alphaticaio·
HOW THE STRUCTURE HANDLES EACH SCENARIO FOR TOMORROW: Cold CPI + bank beats: the best case. IV compresses further. The shock absorber strengthens. Price pushes through $755-$760 and approaches the $789 target. The bull flag, Reverse H&S, and falling wedge all accelerate. Hot CPI + bank beats: mixed. IV spikes on CPI but bank earnings provide a floor. The shock absorber at +$327M absorbs the initial CPI reaction. The $751 floor catches any dip. Cold CPI + bank misses: mixed in the other direction. Good inflation data but earnings concern. The shock absorber absorbs the bank reaction. IV stays low from CPI. Hot CPI + bank misses: the stress test for the structure. The $751 floor and +$327M shock absorber are tested. The accelerators at $748, $740, and $735 are the downside chain if $751 breaks. $SPY $QQQ $IWM
Alphatica@alphaticaio

SPY OPEN | Monday July 13 $754.62. Up 0.14%. The first full session since the falling wedge confirmed. The breakout level became the floor. Tomorrow is the biggest data day of the month. THE BREAKOUT HELD: Friday SPY closed above $751.72 and confirmed the falling wedge. Today the structure tells you it's holding. The floor (where the shock absorber flips from cushion to amplification) sits at $751. The breakout level was $751.72. Those numbers just converged. The pattern breakout and the structural floor are the same zone. In plain terms: the level we watched for two weeks as a ceiling just became the floor. Price is above it. The shock absorber protects it. If SPY dips, $751 catches it. That's the breakout doing its job. THE STRUCTURE: The shock absorber rebuilt to +$327M after Friday's weekly strip. Positive. Cushioning dips. Not as thick as Thursday's record +$1.63B but healthy and growing. The rebuild follows the same 2-3 session pattern we've documented six times. The engine is at +93.2M. Approaching 100M again. The autopilot that buys every dip is running at 55% power. Twelve consecutive sessions positive. The longest run of the cycle. Seven of ten top levels are magnets pulling price up: $755: +$145M (at price) $756: +$78M $757: +$123M $758: +$95M $760: +$228M (largest, 0.7% above) $770: +$62M $800: +$96M $827M of magnets pulling toward $760. The next pattern target is the Reverse Head and Shoulders breakout at $756.68. That's $2 above price. The magnets are pulling price directly toward it. The bull flag breakout at $755.42 is $0.80 above. If price pushes through today, that's a fifth pattern confirming with a 93% success rate. IV: 13.3%. Near all-time lows heading into CPI and bank earnings tomorrow. The market is not hedging heavily for tomorrow's data. This either means the market expects a benign CPI print or it means the reaction could be outsized if there's a surprise because nobody is positioned for it. TOMORROW: THE BIGGEST DAY OF JULY Two major catalysts arrive simultaneously: CPI inflation data (8:30 AM). The last CPI on June 10 came in cold and SPY still sold off because the quarter-end rebalancing overwhelmed the good news. This time there's no rebalancing. The shock absorber is positive. The engine is running. If CPI comes in cold again, the structure can actually rally on the news this time. Bank earnings (before and after market). The major banks kick off Q3 earnings season. The financials stress test in June showed all 32 banks absorbing $708B in projected losses. The setup is clean. Beats here confirm the fundamental picture and give the market permission to push toward $760. HOW THE STRUCTURE HANDLES EACH SCENARIO: Cold CPI + bank beats: the best case. IV compresses further. The shock absorber strengthens. Price pushes through $755-$760 and approaches the $789 target. The bull flag, Reverse H&S, and falling wedge all accelerate. Hot CPI + bank beats: mixed. IV spikes on CPI but bank earnings provide a floor. The shock absorber at +$327M absorbs the initial CPI reaction. The $751 floor catches any dip. Cold CPI + bank misses: mixed in the other direction. Good inflation data but earnings concern. The shock absorber absorbs the bank reaction. IV stays low from CPI. Hot CPI + bank misses: the stress test for the structure. The $751 floor and +$327M shock absorber are tested. The accelerators at $748, $740, and $735 are the downside chain if $751 breaks. The structure enters tomorrow positive with a floor at $751, magnets at $755-$760, and the engine at 55% power. It can absorb a normal surprise in either direction. A double miss (hot CPI + bank misses) is the scenario that tests the floor. THE LEVELS: $755.42: bull flag breakout. Fifth pattern. $0.80 above. $756.68: Reverse H&S breakout. $2 above. $754.62: at price. $751: the floor. The breakout level that became support. $748: first accelerator below the floor. $760 is the magnet. $755 is at price. $751 is the floor. Tomorrow is the catalyst. $SPY $QQQ $IWM


English
4
1
21
3.8K
Mind Math Money
Mind Math Money@MindMathMoney·
@calvinfroedge The margin of safety crowd has been right on valuation and wrong on price for a decade now.
English
0
0
2
27
🏴‍☠️
🏴‍☠️@calvinfroedge·
You could have invested with a margin of safety But you decided to buy the NASDAQ
🏴‍☠️ tweet media
English
10
2
65
4.7K
Mind Math Money
Mind Math Money@MindMathMoney·
@whale_alert Coins leaving an exchange for an unknown wallet usually just means someone stopped trading and started holding. Exchange balances tell you where supply is parked, not where conviction actually is.
English
0
0
0
21
Mind Math Money
Mind Math Money@MindMathMoney·
@ThePivotKing Trading smaller in a market that can gap on a headline is the real edge here. Size is what decides whether you're still in the game when the setup you actually waited for shows up.
English
0
0
0
9
𝕋𝕙𝕖ℙ𝕚𝕧𝕠𝕥𝕂𝕚𝕟𝕘 👑
$Oil continues to build a bullish case despite all the volatility. The headlines have been noisy, but the technical structure is beginning to improve while key support continues to hold. Key levels: 🚨 70.75 line in the sand 🚨 73.00 key support 🎯 79.80-80.00 major resistance above Technical backdrop: • Trend change developing as the red line crosses above the gray line • Price remains above major institutional support bazooka block dark pool areas • Buyers continue defending key support • Structure favors higher prices while support remains intact The bigger picture: Geopolitical tensions involving Russia and Ukraine continue to evolve, and any further escalation could quickly become a catalyst for higher energy prices. The longer-term outlook still favors higher prices, with the potential for OIL to eventually trade back above 100 if the bullish structure continues to develop. All it may take is one major geopolitical trigger. That risk of a significant escalation still appears to be lurking in the background. Game plan: • Buy bullish dips while support holds • Stay patient and let price confirm the next breakout • Trade smaller than normal in this volatile environment Risk management remains critical. Oil can move several dollars in a very short period, so protect your capital. Full breakdown in the video below 👇#OIL
English
2
1
12
1.9K
Mind Math Money
Mind Math Money@MindMathMoney·
@ardizor Every broken head and shoulders looked exactly this clean right up until it failed. The neckline only becomes obvious information after price already answers the question.
English
0
0
0
6
ardizor 🧙‍♂️
THE HEAD AND SHOULDERS PLAYED OUT PERFECTLY One of the most reliable bearish patterns in technical analysis and BTC followed it line by line Left shoulder, head, right shoulder, neckline break The moment neckline at $62.5K gave way the measured move began Now trading at $52K and the pattern target is still below current price This isn't hindsight the structure was visible for months Turn notifications on next level gets called before it prints
ardizor 🧙‍♂️@ardizor

THE LAST SHAKEOUT BEFORE THE REAL BOTTOM IS LOADING Every bear market in history ended the same way one brutal final liquidation that destroys everyone who held through the entire drawdown This cycle is no different $64K → $53K → final capitulation Two weeks from now Bitcoin enters that phase the one that feels like the end but is actually the beginning I've called every major top and bottom for 15 years The moment I start loading spot, this account posts it first Follow now - you don't want to miss this one

English
27
2
35
22.9K
Mind Math Money
Mind Math Money@MindMathMoney·
@CoinMarketCap IBIT pulling in $291.9M while the whole complex only nets $197.4M says the rest of the ETFs are still bleeding out. One winner take most market forming in real time.
English
0
0
1
19
CoinMarketCap
CoinMarketCap@CoinMarketCap·
LATEST: 📈 US spot Bitcoin ETFs snapped an 8-week outflow streak last week, pulling in $197.4M, led by $291.9M into BlackRock's IBIT.
CoinMarketCap tweet mediaCoinMarketCap tweet media
English
40
9
70
38.9K
Mind Math Money
Mind Math Money@MindMathMoney·
The market is a machine for transferring money from the impatient to the patient.
English
0
0
4
264
Mind Math Money
Mind Math Money@MindMathMoney·
@Cryptic_Web3 Borrowing against BTC instead of selling only works if the loan-to-value leaves room before a margin call. That part never makes the headline.
English
0
0
0
9
Cryptic
Cryptic@Cryptic_Web3·
🚨🇯🇵LATEST: Japanese lender CRYL now offers Bitcoin-backed loans of up to ¥1 billion ($6.2 million), enabling individuals and businesses to unlock liquidity while keeping ownership of their BTC.
Cryptic tweet media
English
24
20
122
12.9K
Mind Math Money
Mind Math Money@MindMathMoney·
@rosoku_murakami Descending triangles resolve on the catalyst, not the shape. CPI tomorrow is doing more work here than the pattern itself.
English
0
0
0
149
マコト|ゴールドトレーダー
【ゴールド、3960ドルへの暴落警戒】 今、ゴールドは暴落のサインが出ています。 「ディセンティングトライアングル」 明日のCPIで全てが決まります #ゴールド #XAUUSD
日本語
4
0
28
4.8K
Mind Math Money
Mind Math Money@MindMathMoney·
@ShawnCT_ B wins. Stablecoins are the only model on that list with recurring revenue that doesn't need price to go up.
English
0
1
1
10
Shawn
Shawn@ShawnCT_·
Test your crypto business IQ: Which business model is the most profitable in crypto? A. Build compliance → Coinbase B. Issue stablecoins → Circle C. Build the network → Solana D. Build a launchpad → Pump.fun E. Political influence + Personal brand + Financial assets → Trump What’s your answer?⬇️
Shawn tweet media
English
65
32
155
19.5K
Mind Math Money
Mind Math Money@MindMathMoney·
@astronomer_zero Calling it a knife catch and staying humble in the same breath is rare. Most people only admit the first part after the trade already worked.
English
0
0
1
83
Astronomer
Astronomer@astronomer_zero·
$btc longs Forming a local range now. Adding if NYO takes out range local low Alright nice first reaction after taking the longs. What was a total knife catch ended up bouncing locally so far and we saw price react and local order flow do its job. From here, we are likely forming a range now locally before heading to bigger points of interest (low 60's to bet big, no guarantees) and 66k to TP big and lock in all the longs we have been building for two weeks now. Levels of importance to look out for and monitor price: range high, midrange and range low, until breakout to bigger points of interest indeed. Good start, staying humble until we see resolution of the range next. If we run range low, I am going to ad to the starter position. That is still local positioning (revolving around the local range), not yet the "big betting" I do near the red zone.
Astronomer tweet media
Astronomer@astronomer_zero

$btc The plan is panning out slowly, low 60's first, then 66k second. I entered another long (starter) here (aggressively) Alright! We are getting our favoured scenario, of price dropping first before hitting 66k. And so our plan of taking yet another long is slowly shaping up, the plan to get our sixth win in a row, the plan to carry another long, as we develop another fake Monday move imo. If you're new here, price is dropping to indeed form a fake move, potentially taking out the poor lows. Our game plan is coming together. A plan is just a plan however, there are enough plans on X, only half of them play out. Only putting real money on the line is what makes real money, so with that, comes an actual position. Exactly what I did, starting a small position here. Not the entire position yet, it will be added in the "bet big area". But I'm starting here because since the 66k magnet is active, there is no guarantee of our deeper levels of interest coming as stated, but I do have my notion. So there you go, the plan is shaping up, and here are my actions, also shaping up. All called live, all real. We are traders, we are not just callers, there are enough "callers" on X. Only real money speaks, since real money can't be hidden. Full transparency. Enjoy and have a great start of your week.

English
18
8
97
31.7K
Macro Liquidity by Sunil Reddy
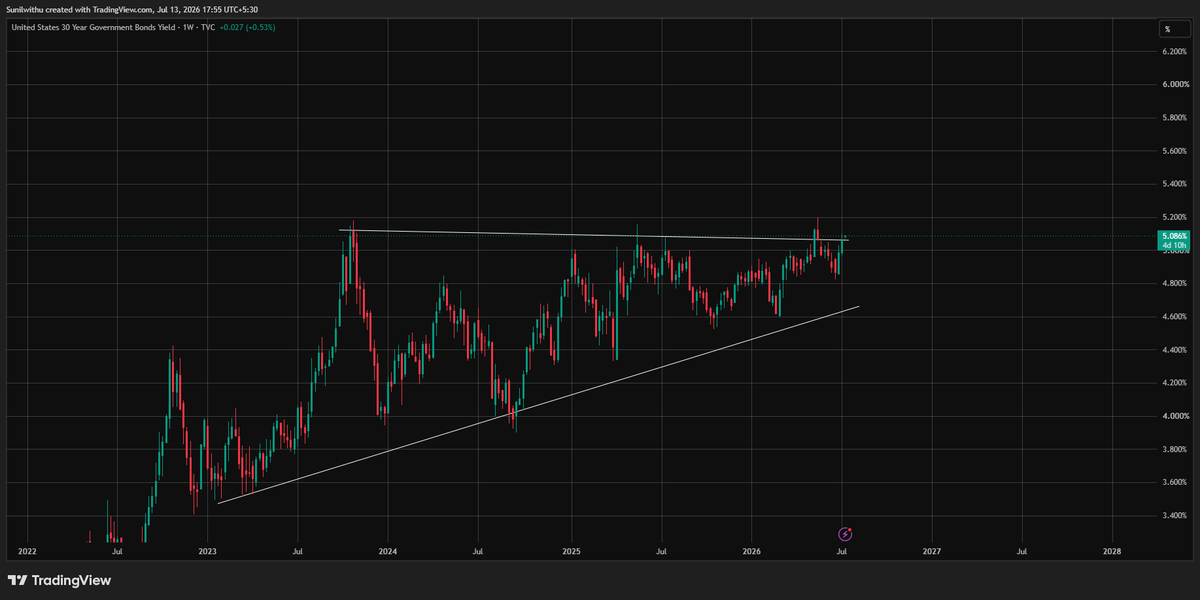
Every time the US 30-year yield moved close to 5%, Trump usually stepped back and de-escalated. The reason was simple: 5% at the long end is a serious pressure point for the entire financial system. It raises mortgage rates, increases government borrowing costs, tightens liquidity and puts pressure on equities. But this time, the 30-year yield is already above 5% and Trump is still escalating. That is a major change. The bond market has almost no room left to absorb another inflationary or geopolitical shock. Any further escalation from here could push long-term yields sharply higher and trigger a disorderly bond market sell-off. Watch the 30-year yield closely. This is where the real market risk is building.
Macro Liquidity by Sunil Reddy tweet media
English
20
24
149
9.5K
Mind Math Money
Mind Math Money@MindMathMoney·
@George1Trader The sweep only matters if the reclaim is fast. A slow crawl back above 61k tells a different story than a sharp v.
English
0
0
0
29
George
George@George1Trader·
#btc Rejecting at supply again, likely some lows are next. Clean lows resting around $61k with daily demand resting right below it. Sweep and reclaim and we likely have the strength to push higher.
George tweet media
English
12
2
125
13.6K
Mind Math Money
Mind Math Money@MindMathMoney·
@RedDogT3 Price telling a different story than the headlines is exactly why 748 matters more than any news alert this week.
English
0
0
0
13
Scott Redler
Scott Redler@RedDogT3·
📺 IS THIS JUST A PAUSE BEFORE NEW HIGHS? + SEMIS IN A REBUILDING PHASE + $NVDA TOP TRADE FOR THIS WEEK The market remains in a healthy uptrend. Last week's roadmap played out almost perfectly, with $SPY holding key support near $740, reclaiming $745, and rallying to fresh highs around $755. While traders spent the weekend focused on Middle East headlines, the price action continues to tell a much more constructive story. * $748 is now the most important level for $SPY. As long as the index stays above Friday's low, the current bullish pattern remains intact and there's little evidence that a meaningful volatility event has begun. Only a break below that level would suggest the market is entering a different environment. Until then, you should focus on technicals rather than reacting emotionally to news headlines. * Meanwhile, $QQQ continues to validate the Red Dog Reversal that developed after reclaiming its 50-day moving average. That signal offered an attractive opportunity to add long exposure. The bulls remain in control as long as $QQQ continues holding above key support. If you carry heavy hedges, you may want to reduce some of that protection and let price action determine whether money continues rotating back into growth. * The semiconductor sector remains the biggest source of uncertainty. $SOXX $SMH I think the group has entered a rebuilding phase following a strong advance. Some traders are watching a potential head-and-shoulders pattern, but don't assume it will automatically trigger it. Many bearish chart patterns simply evolve into consolidations before resuming higher. While a confirmed breakdown could create significant downside pressure, no such confirmation exists today. * Last Thursday, I said sell $MU into strength near recent highs. With the stock now trading between major support and resistance, I would wait for either a reclaim of higher levels or confirmation of additional weakness before becoming aggressive again. I also expect semis to remain the primary source of market volatility this week, especially following weakness in overseas semiconductor indexes $KOSPI after a major $SKHY IPO. * $NVDA remains my highest-conviction active trade. After the stock showed relative strength and a successful breakout above resistance, I successfully used my profit-taking strategy alongside my tier system. I am now holding my remaining position and watching whether #NVDA can continue its active sequence by staying above roughly $205. If support holds, I believe the stock could continue outperforming many of its semiconductor peers. * I also briefly cover $TSLA, noting that it may offer a short-term tactical trade above ~$402, although I currently have no position. I am not that interested in either #TSLA or $SPCX and the space-related stocks, as they are all technically broken and no longer market leaders. * So, the trend remains bullish until price proves otherwise. Ignore the weekend headlines, respect the key technical levels, manage risk actively, and allow the market (not emotions) to determine your next move. * If you found this helpful, please ❤️like and 🔁retweet
English
6
4
33
8.8K
Mind Math Money
Mind Math Money@MindMathMoney·
@DanielMuvdiYT Oil moves first because insurers reprice shipping risk before equities do. Five ships through in 24 hours already tells that story.
English
0
0
1
33
Daniel Muvdi
Daniel Muvdi@DanielMuvdiYT·
El KOSPI cae un 8% mientras se intensifica la situación en Irán. Los futuros de los principales índices continúan retrocediendo, con las tecnológicas del Nasdaq bajando un 1.2%, mientras el petróleo sigue disparado (WTI +5%). El estrecho de Ormuz permanece prácticamente cerrado: apenas cinco barcos habrían logrado pasar en las últimas 24 horas. La incertidumbre vuelve con fuerza al mercado y, si la escalada continúa, el Nasdaq podría estar buscando una corrección adicional 2%. La única variable es que Trump salga a decir que los iraníes son unos tipos increíbles, que ya quieren hacer las paces y todo lo demás. Así está la cosa. #Trading #Quantfury
Daniel Muvdi tweet media
Español
9
2
46
6.3K