Joshua Morgan

524 posts

Joshua Morgan banner
Joshua Morgan

Joshua Morgan

@Morgan_Josh_C

Greer, SC Katılım Şubat 2014
451 Takip Edilen142 Takipçiler
Zachariah Loney
Zachariah Loney@LoneyZachariah·
Possible but less likely than I originally thought because the broader markets are not selling off at all and are instead having a blowoff type move. If we get a broader market sell off it would make it likely. I expected that sooner, together with higher oil prices than we've seen. If oil does end up running to 150+ this summer and markets start taking a beating, then yes, 3.50 becomes quite likely. If not, we just need to break 5.68 to the downside to put in the weekly cycle low. The sooner we hit 5.68 in the next 30-50 days the lower we can go, too. I'm looking for anything between 4.00-5.68, but it will become more clear as we near the timing for the low.
English
1
0
0
32
Kerry Balenthiran
Kerry Balenthiran@TheCyclesTrader·
Another great under followed account is RESM. His research is bang in line with my own. 1987 = 2022 2000 = 2035 2x 17.6 years is the full cycle🔝to🔝
RESM Cycles@RESMcycles

@ISABELNET_SA @RyanDetrick We are seeing a repeat of the 1987-2000 run. It's the second half of the secular bull market. 1987 = 2022

English
5
1
15
3.6K
Zachariah Loney
Zachariah Loney@LoneyZachariah·
looking forward to it too, Luke. I'm still watching $hg $hgraf like a hawk and I think we are getting close to some action. I'm still looking for a BRIEF breakdown of 5.68, looking for a bottom in 30-50 calendar days. today is day 48 of daily cycle 4, and they usually run about 92 days long on average, and I'm expecting this one to be on the shorter side, so, closer to 30 days. So, we should start descending into the final low now/soon before the next weekly cycle starts and we get several months of solid upside again. On the flip side, closing a week solidly above 7.30 CAD could/would likely start a breakout, not my expectation, but keeping it mind. I'm getting thoroughly bored waiting!
English
4
0
5
926
Notorious
Notorious@thenotorious617·
I still got Cavs in 7. Knicks genuinely look beatable as hell and not even that special. I rewatched the game and Knicks really ain’t that special. Harden and Mitchell are yet to have a good game and Knicks barely beat us. Josh Hart is not shooting like prime Curry 4 more times.
Notorious tweet media
English
620
33
397
125.3K
LC666
LC666@Capital_KUMA·
$FUTU News of penalties for $FUTU driven the price down 20% pre open. Although I had no inside information the structural break of the chart happened 3 days ago and it was likely $FUTU will retest 88 level. Just glad I sold my holdings then
LC666 tweet media
LC666@Capital_KUMA

$FUTU if it doesnt shape up from here.....

English
1
0
1
1.8K
Joshua Morgan
Joshua Morgan@Morgan_Josh_C·
@HyGrowth Even with Bitcoin slowing to maybe 73k for the next couple weeks? It will hit 93k by mid June July.
English
0
0
0
53
🇺🇸🔋Mr. Deeds🔋🇺🇸
$SLNH We are in the final days of sub $2. Then we climb the stairway. Next target $3.02 - $ 3.49 🧲🧲🧲
🇺🇸🔋Mr. Deeds🔋🇺🇸 tweet media
English
8
2
80
4.3K
Shane Migura
Shane Migura@TheSqeakyMouse·
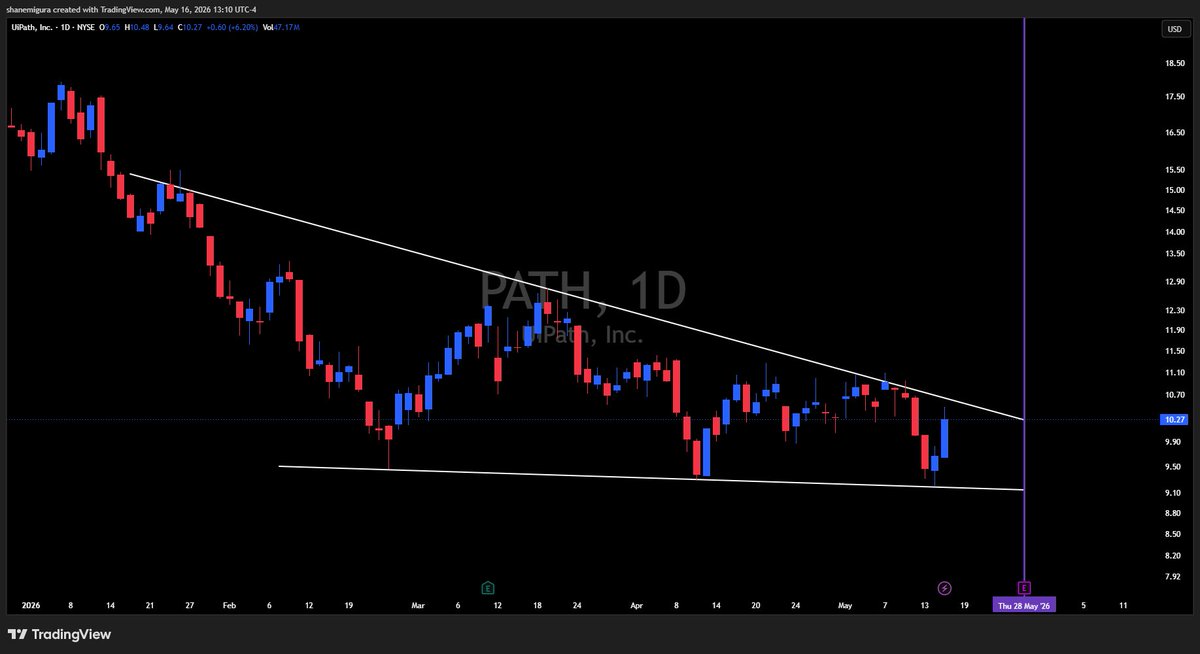
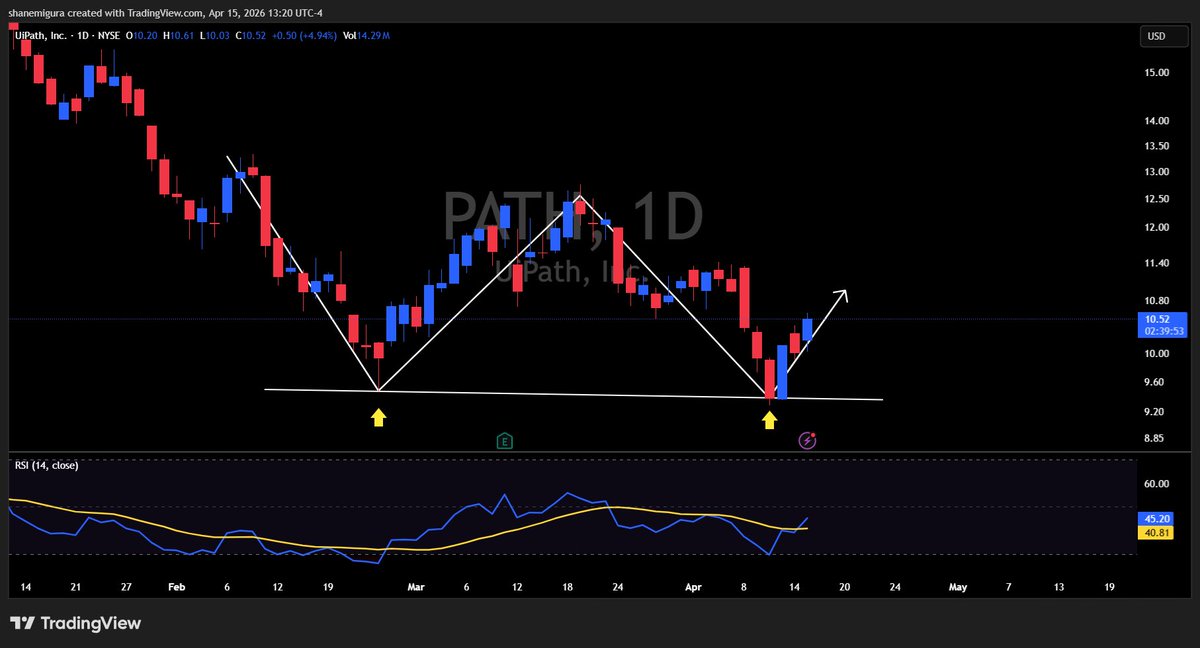
$Path continuing to form its descending wedge into earnings. I see a break out of it within the next two weeks which is why I’m holding shares and calls.
Shane Migura tweet media
English
2
1
35
11.3K
RStacker
RStacker@RaberTrades·
I did some derisking on a few names today. Glad I did, with news about US/Iran escalations. I didn’t sell a single share of $SLNH though. It’s not a short swing trade for me ❤️
English
2
0
44
3.5K
Joshua Morgan
Joshua Morgan@Morgan_Josh_C·
@EtherRawl I appreciate your work. It’s been super helpful in my research.
English
1
0
2
92
Rawl
Rawl@EtherRawl·
The Wyckoff plus psychological analysis is still in play, as people are still debating whether this is a fake move on Bitcoin or not. Meanwhile, the path we are following from multiple perspectives remains the one to watch. As you can see, we are now approaching my key timeline of May 10–15. This period is important to me because that’s when the new Fed Chair is expected to be announced. Typically, markets react with confusion at such times since they don’t yet know the new Fed’s policy stance. There are two sides to this sharp knife: the market could react extremely positively, pricing in further rate cuts and a friendly monetary policy, or we could see uncertainty prevail. In that case,typical uncertainty usually leads to a sideways market until a clearer path emerges — often a few weeks to a month later, around the next FOMC meeting. That next meeting will also be pivotal, as it will be the first with the new Fed Chair. Depending on his attitude, the market could either reverse direction or continue the current one. Besides that, we’ll have to see what kind of impact this brings and its magnitude, because that will become the next major narrative for the market to follow as the current conflict gradually fades away.
Rawl tweet media
Rawl@EtherRawl

This is a multi-perspective analysis to add confluence and explain why I see Bitcoin moving higher after we bottomed in recent months. Starting with the trend: The trend on the macro has been bullish since we tested the lows on February 23 at 63k. That was our first higher low in the new bullish structure. We then formed a second higher low at 65k, with the next expected higher low sitting in the 69k–71k zone. Wyckoff perspective: After the selling climax at 63k, we had our automatic rally up to 74k which tapped macro resistance and pushed us back down to around 65k. From there, we began building a liquidity range by sweeping highs and lows. After the secondary test, we swept 74k again, followed by another sweep of the lows at 65k (our secondary test in Phase B). This also aligned with the second higher low in the trend. Since then we’ve been building the final points of the support as the price goes up but doesn’t fall back down, and now we are now hovering above both the preliminary support and the automatic rally. In theory, as long as 74k holds and we continue building this staircase pattern, we can see an explosive move to the upside at any moment. Wall Street Cheat Sheet perspective: The current price action fits the Wall Street Cheat Sheet pattern almost perfectly. Many charts and fractals are copying what happened in December, with people calling this a fake move or bull trap. What they don’t realize is that they are contributing to the exact psychology needed for the market to move higher. As it chops around, it builds frustration and FOMO. Once we break out aggressively to the upside (aligning with both Wyckoff and the Cheat Sheet), those same people will feel they’re missing out and rush in to buy at any price. That’s when we’ll likely see a larger correction back to the 69k–71k zone. This pullback would hold the macro bullish trend and reset sentiment. Timeline perspective: A major pivot is likely around May 10–15 around with the new FED Chair announcement. This could spark euphoria as people anticipate the new FED will cut rates and act dovishly, adding to the buying pressure. Once everyone has bought expecting the new FED to push markets higher, we can get a healthy reality-check correction. Only then should the summer rally begin, extending into Q3 or even better Q4, with Bitcoin reaching 108k–116k — or making a new all time high while ETH and altcoins outperform in the second half of the year.

English
7
11
68
14.7K
Joshua Morgan
Joshua Morgan@Morgan_Josh_C·
@Mj4Stocks will you ever get a chance to buy in at $14? Most of what I read see this pushing upward.
English
0
0
0
64
MJ
MJ@Mj4Stocks·
$MRAM Everspin Technicals : Broke out from a huge monthly base here! Buy level is 14$ zone, that is our retest of this monthly breakout level. There is also nice volume coming in.. Looks like they have a decent balance sheet. The "Reliability" Play: In AI data centers, power outages can lead to the loss of massive "checkpoints" (the state of an AI model's training). MRAM is used in Write Cache and Storage Controllers because it is non-volatile; it saves the data instantly if power fails, preventing the loss of hours of expensive AI training time. Bottlenecks: Lower Density: MRAM chips currently have much lower capacity (megabits) compared to standard DRAM (gigabits). This makes them unsuitable for main system memory, keeping them restricted to "niche" cache roles. Manufacturing Cost: The specialized magnetic layers required for MRAM make the wafers significantly more expensive to produce than standard silicon memory, limiting its adoption to "mission-critical" applications where data loss is more expensive than the hardware. Thanks to @mogambotrades for putting this name in my Radar! 🫡
MJ tweet media
English
3
3
17
4.8K
Joshua Morgan
Joshua Morgan@Morgan_Josh_C·
@_gautam_94 yeah, sad that it has to be like that. I've made genuine comments on posts only to be called a "dummy". Oh well. I'll just talk to the folks who don't mind.
English
1
0
1
46
Gublo
Gublo@Gubloinvestor·
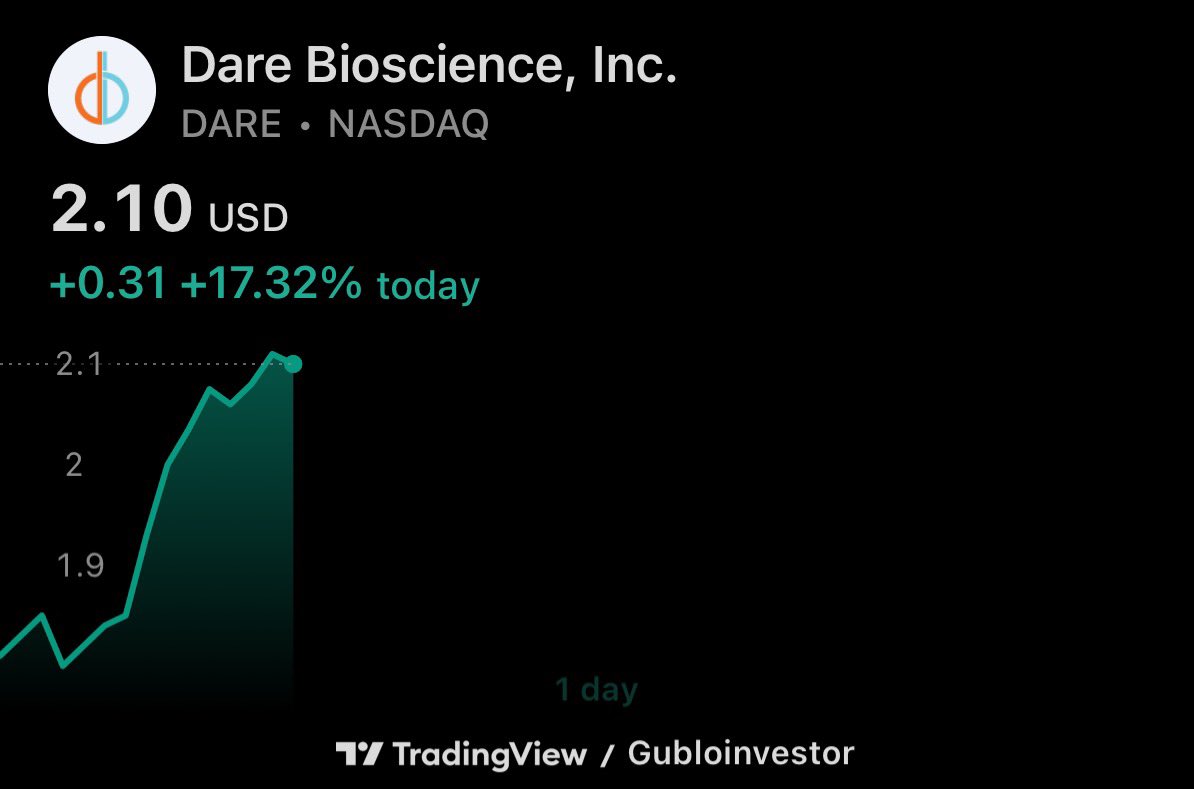
$DARE is your next 25X Penny stock
Gublo tweet media
English
52
57
946
208.4K
Joshua Morgan
Joshua Morgan@Morgan_Josh_C·
@TheRonnieVShow sorry if I ruffled your feathers. I was just making a point about what I was reading. If I offended you, please forgive me. I was real confused and was making a point to try and figure it out. Thanks for the clarity and all the hard work you do.
English
3
0
2
11
RonnieV
RonnieV@TheRonnieVShow·
You just cant read lmfao. The image was old from when I originally posted it before the correction happened. Then it played out. I deleted the post because dummies like you have trouble reading and understanding what I was saying… that market follow a cycle of crash-correction, crash-correction. Image looked like this and I quoted this tweet LOL GTFOH
RonnieV@TheRonnieVShow

Every major correction on this chart started the same way. The Weekly 9 EMA crossed below the 21 EMA. 2022 Bear Market • Drop: -27% Market rallied… Then another correction • -10% Market rallied harder... Fast forward to now: Tariff Panic • Drop: -21% We rallied again… And the same weekly bearish cross just printed. If the pattern repeats, the next move could be roughly another -13% correction. One green day doesn’t change the weekly structure. Weekly charts > Daily charts.

English
1
0
0
254
RonnieV
RonnieV@TheRonnieVShow·
Here are the facts. Called for market pullback/ correction in October. - Got a pullback in November. Called for market correction in February. - Got a correction Feb./Mar. Called market bottom. - New ATHs just printed on $SPY. Received MASSIVE hate on every call but was RIGHT. Haters gonna Hate but facts don't lie. Watch me cook! 👨‍🍳
English
39
3
251
15.8K
Joshua Morgan
Joshua Morgan@Morgan_Josh_C·
@TheSqeakyMouse What do you see its future like? Software is getting beaten. I have a good sir in. $PATH at $11.87 cost basis. Curious.
English
1
0
1
335
Joshua Morgan
Joshua Morgan@Morgan_Josh_C·
@PSInvestor Yeah, I have 1% holding for a 20% return so far. Probably will increasing now.
English
1
0
1
139
Patient Investor
Patient Investor@PSInvestor·
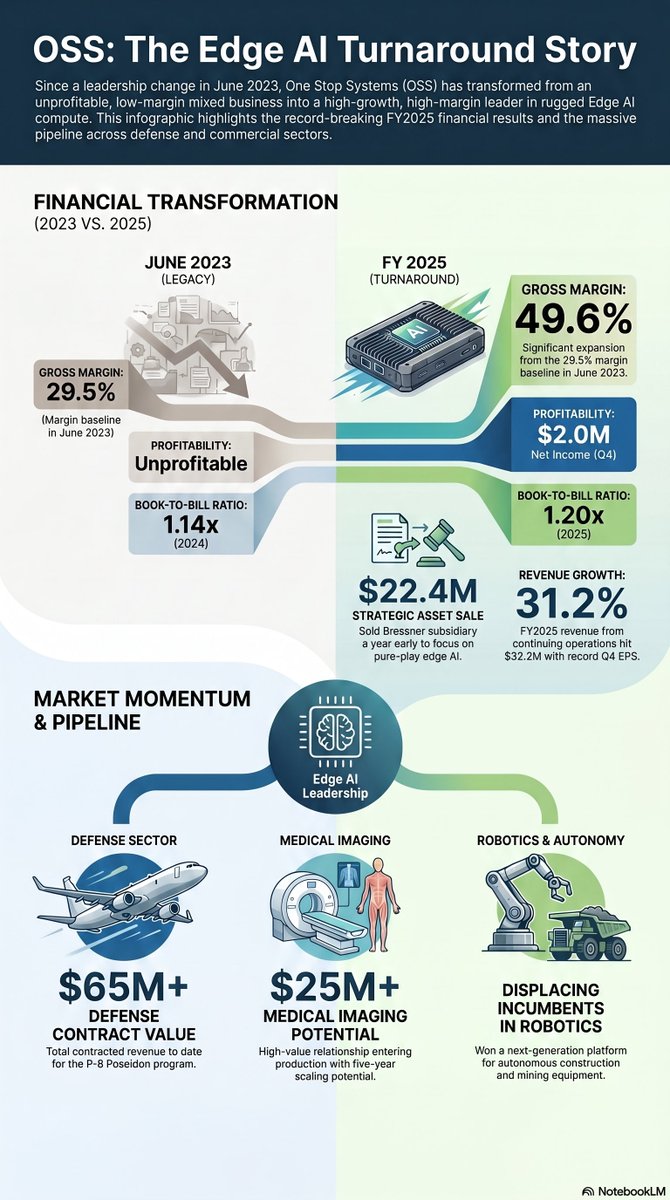
$OSS CEO and Chairman just issued a shareholder letter. Turnaround is real. 1. FY2025 revenue: $32.2M (+31% YoY). Gross margin: 49.6%. Was 29.5% when new team took over in June 2023. Now profitable. 2. Q4 2025: record EPS, record gross margin, second-highest quarterly sales ever. Net income $2.0M ($0.08/share). 3. Book-to-bill: 1.2x. Growing 30%+ while backlog expands faster. 4. Sold Bressner for $22.4M. A year early. Now pure-play rugged edge AI compute. 5. FY2026 guide: 20-25% revenue growth, ~40% gross margins, positive EBITDA. 6. P-8 Poseidon: $65M+ total contracted. $23M+ awarded since early 2025. Visibility through 2027. 7. Commercial wins: autonomous construction/mining robotics, ~$6M aerospace program, medical imaging opportunity worth $25M+ over five years. 8. June 2023: unprofitable, 29.5% margins, declining revenue. Today: profitable, 49.6% margins, 30%+ growth, pure-play. Less than two years. Completely different company.
Patient Investor tweet media
English
3
4
17
7.8K
Joshua Morgan
Joshua Morgan@Morgan_Josh_C·
@EtherRawl So, basically (most likely) no revisit of 60s and instead just a choppy grind upwards.
English
1
0
1
173
Rawl
Rawl@EtherRawl·
Small update on the EW plan for Bitcoin, for now it has been playing out exactly as expected, with a bottom at 63k. From there, a bullish phase started with the first leg up to 74k followed by a second leg down to 65k holding nicely above 63k forming a bullish structure. Even though it’s currently in a tight range and looks choppy, the wave count has respected what it started. Now that we’re back at 74k, I would prefer a more aggressive move to at least 84k, followed by a final leg to maybe 90k or slightly above. However, I must admit that altcoins not moving during this last leg is not healthy. It means volatility will likely persist through this 2/3 leg until they start moving together. If that doesn’t happen, the price action will become even choppier and more sideways, making the first bullish EW phase very compressed. By “compressed,” I mean there won’t be new lows under 60k, but also no explosive move—just a slow bullish structure preparing for the second macro EW leg, which should to be the most aggressive one. I remain positive.
Rawl tweet media
Rawl@EtherRawl

Bitcoin has been following this plan so far, and it's going well — besides the timeline, because that's not the whole point of this post. It's the structure that matters. After the February low, we needed two more waves to complete the full correction that started in October, a Wave 4 and a Wave 5, finishing the corrective C wave. We got both of them, even without making a new low. As I explained back then, even a retest of the lows was valid. The retest of $63k on February 24th still counts as confirmation of the final leg down. Since then, we’ve bounced back up, starting a new bullish Elliott Wave phase. We have already printed Wave 1 and Wave 2, and we’re currently in a choppy range around $65k and there are still two more waves to the upside, which I believe will spark pretty soon. Once they complete, we will likely teleport quickly to the 90k–96k area. There, we should stay for a few weeks, making a small distribution top. Around the new Fed Chair, we should begin a corrective ABC wave that lasts into the June FOMC. That FOMC meeting could either complete the first bullish corrective Wave C, or it could mark the beginning of the next one (Wave 2) around $71k–$74k, confirming the breakout from the current range before we push even higher this year. I see an 80% chance of making a new ATH this year, with the remaining 20% scenario being a range between 116k and 125k, where ETH and altcoins would start to catch up. P.S. There’s also a small alternative scenario I shared with the group where a deeper pullback in May–June that goes below $74k down to around $55k. That’s why I continue to recommend taking 20–30% off the table around the $90k–$96k area so you can then add half of that position back (say 10–15%) at $74k, and the second half at $55k. Both scenarios are bullish and can lead to a new ATH this year. That said, it would be preferable to see $74k hold as support, especially while the SPX makes a new lower low. If Bitcoin and crypto hold a higher low in the mid-term, that would be the perfect trigger for risk assets to outperform from the liquidity and I strongly believe this will happen because I no longer believe in the traditional 4-year cycle for multiple reasons.

English
8
10
90
8.1K
Joshua Morgan
Joshua Morgan@Morgan_Josh_C·
@stockmom Thanks for reminding me. I have to set it up for my 10 month old.
English
0
0
0
2
Stock Mom™
Stock Mom™@stockmom·
I helped two people set up their Trump accounts for their kids today. I'm overwhelmed with joy, in knowing I'm making a difference in those beautiful little baby's lives. I'll sleep easy tonight. 🙏🏼🇺🇸
English
25
10
255
2.7K
RonnieV
RonnieV@TheRonnieVShow·
Im not saying correction. Im saying we’ve already corrected and if could be over. Which would follow the pattern. $SPY
English
1
0
7
2.3K