Sabitlenmiş Tweet

Prediction markets can represent the best collective knowledge about our energy and climate future.
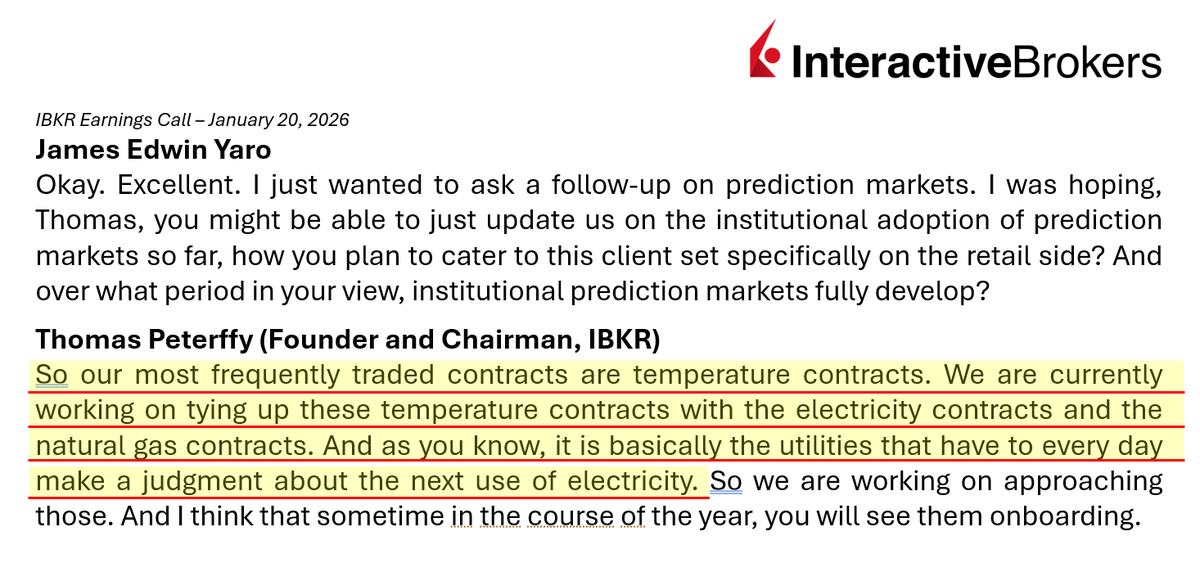
interactivebrokers.com/campus/traders…
English
Patrick T. Brown
3.4K posts
@PatrickTBrown31
Head of Climate Analytics @IBKR; Adjunct faculty (lecturer) in Energy Policy & Climate @JohnsHopkins; Sr. Fellow @TheBTI


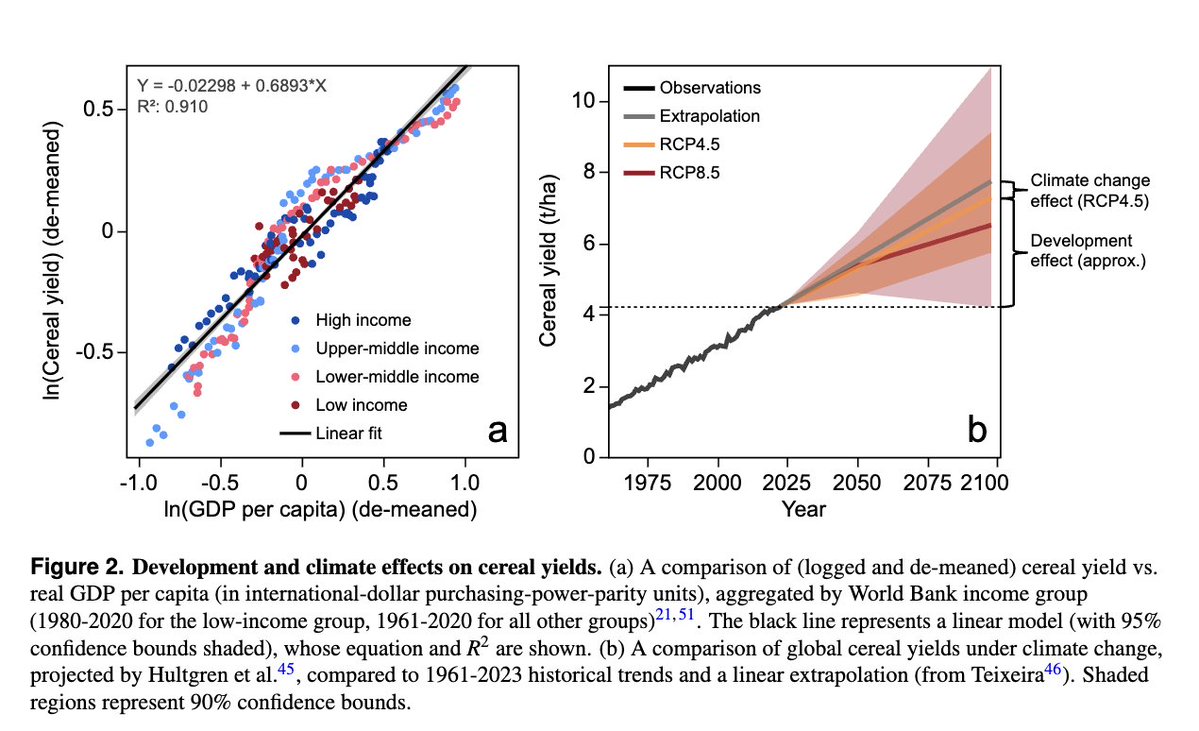
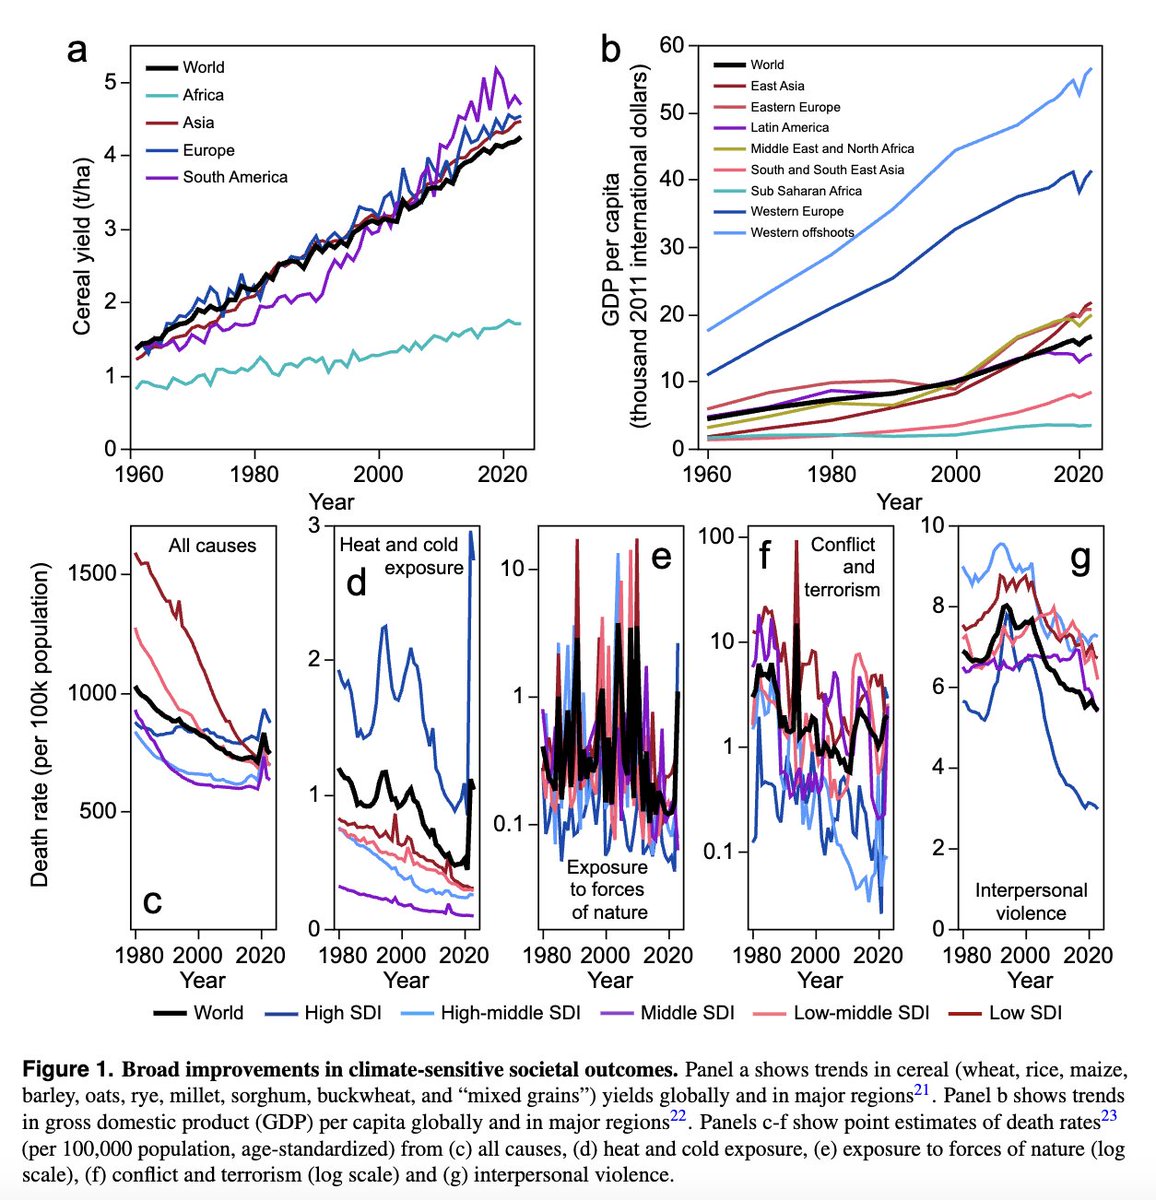
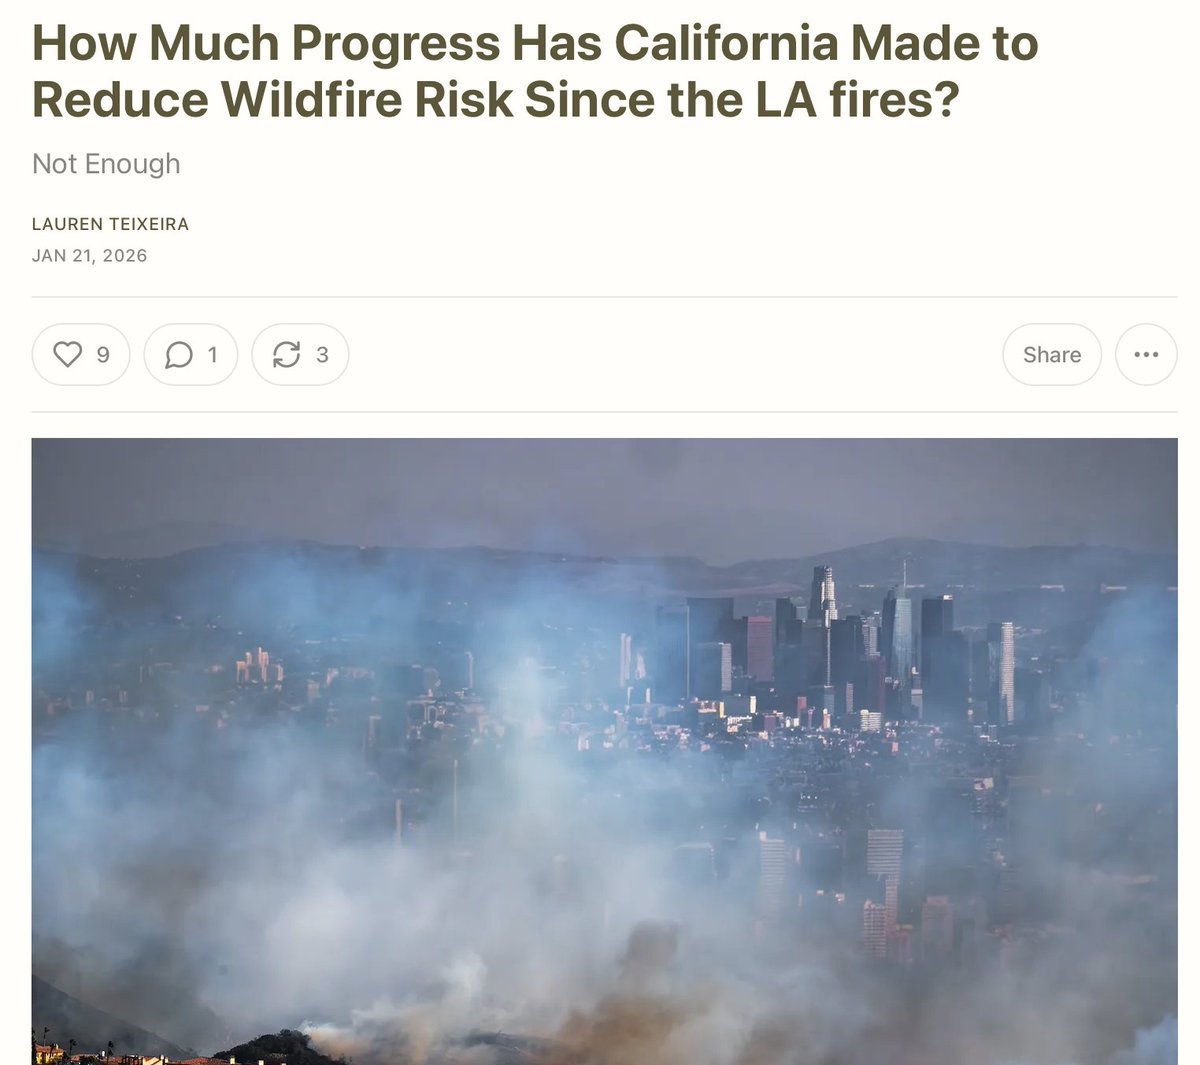
icymi: disastrous economic growth and the race for profit are driving rapid mass extinction via habitat & wildlife destruction, pollution, and emissions (2°C warming 2030-40).

ForecastEx has launched weather-forecast prediction markets, allowing participants to take financial positions on the daily high temperatures for an initial offering of 10 US cities. Prediction markets for daily high temperatures can benefit both participants (directly if they are skillful) and external observers (via the information they provide). I have participated in the National Forecasting Competition as both a meteorology student and later as a faculty member teaching synoptic meteorology and weather forecasting. From these experiences, I know there are many instances in which humans can consistently beat automated forecasting systems. In the article linked to in the next post, I lay out the details of the contracts and some tools for forecasting and identifying mispricings. Most physics-based weather models are computationally intensive and are thus run on supercomputers at most 4 times a day. Thus, a lot of information can enter at higher frequencies than the models can capture. Furthermore, temperature is recorded by point stations, whereas the highest resolution weather models have resolutions of a few km. Thus, the physical intuition of the forecaster can add value. On the day of a contract's expiration, when much of the trading action will occur, forecasting the high temperature essentially involves observing how the atmosphere is changing relative to the story that the various physics-based weather models predicted in their most recent runs. A forecaster can begin with the National Blend of Models text forecast or the National Weather Service graphical forecast to understand the physical story associated with the default central strike in the ForecastEx markets. A forecaster could then examine a multi-model meteogram to identify which models represent that physical story and which predict different evolutions in clouds, humidity, winds, fronts, etc. A forecaster could then monitor the live station feed to see which scenario is actually developing throughout the day. When observations (including non-temperature observations) point to a group of models that is noticeably warmer or cooler than the central National Weather Service and ForecastEx market value, that’s a signal that taking a position in the market could represent an opportunity. [full article link below]


Great to work with @matthewgburgess , @RogerPielkeJr and @PatrickTBrown31 on this paper. @USC_Econ , @HooverInst The economics of climate adaptation optimism osf.io/preprints/soca… via @OsfFramework