QuantBr

1.6K posts

QuantBr banner
QuantBr

QuantBr

@Quant_Br

Quant, PhD, machine learning. Finding signals in a noisy market.

Katılım Eylül 2016
1.6K Takip Edilen374 Takipçiler
QuantBr
QuantBr@Quant_Br·
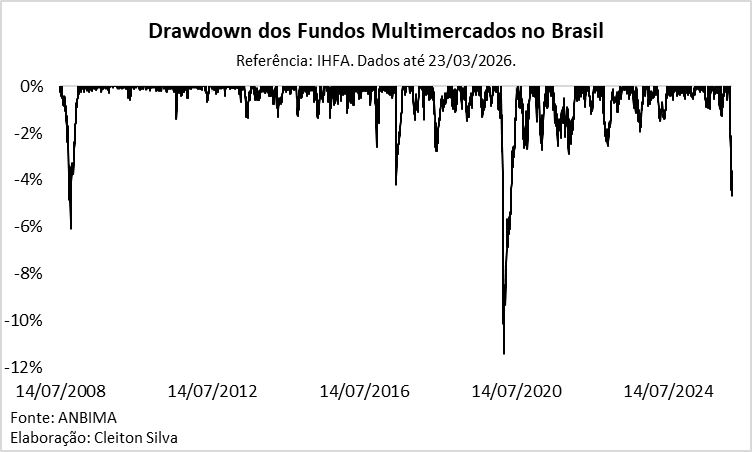
@Cleiton_CSJ O drawdown da série em excess return é mais válida para comparação histórica já que elimina o carrego.
Português
1
0
1
463
Cleiton Silva
Cleiton Silva@Cleiton_CSJ·
A pancada que os fundos multimercados tomaram agora em março é a terceira pior da série histórica que começa em julho/2008.
Cleiton Silva tweet media
Português
9
13
214
17.3K
pedrohm
pedrohm@phmt85·
@Quant_Br @hbredda Quant, lembra da resposta dele nessa pergunta ? Se puder ajudar, agradeço
Português
1
0
0
117
Ouriço de cartola
Ouriço de cartola@cegadede·
Vscode com copilot é tipo magia negra, o negócio advinha o que você quer fazer
Português
18
8
356
32.8K
QuantBr
QuantBr@Quant_Br·
@quantbeckman CPCV seems to be very efefctive from my point of view, though never heard of CPCVB. Can you give me more information about it (paper, blog, book)? Same to monkey test as well. Thanks
English
0
0
0
16
Alexandre Galvão Patriota
Alexandre Galvão Patriota@agpatriota·
Recentemente vimos o problema da cotação do dólar no Google. Um detalhe: as cotações que a Google apresenta não são ajustadas e podem passar uma impressão errada de uma evolução patrimonial que se teria com reinvestimentos de dividendos e bonificações. Alguém sabe se a Google fornece uma versão ajustada? Exemplo com a BBSE3: Gráfico à esquerda é o da Google. Gráfico à direita foram obtidos pela yahoo (pelo R)
Alexandre Galvão Patriota tweet mediaAlexandre Galvão Patriota tweet media
Português
2
0
22
1.5K
QuantBr
QuantBr@Quant_Br·
@agpatriota o unico confiável gratuito é o tradingview. Olha a diferença.
QuantBr tweet media
Português
1
0
1
137
QuantBr
QuantBr@Quant_Br·
@agpatriota @vowtz Mercado é o maior especialista de todos. Nem sempre está certo, mas é o melhor indicador do que esperar para o futuro.
Português
0
0
1
14
Alexandre Galvão Patriota
Alexandre Galvão Patriota@agpatriota·
Pensei em esperança e escrevi expectativa com s 😳 Eu imagino isso mesmo, mas um especialista disse que, nas contas dele, a taxa de juros de mercado tenderia a cair. Eu questionei sobre o governo não controlar os gastos e, no final, fiquei sem entender o motivo dele. Por isso estou perguntando para outro.
Português
1
0
0
47
QuantBr
QuantBr@Quant_Br·
@agpatriota @vowtz Os futuros de DI indicam uma expectativa do que acontecerá com a SELIC, saber se este cairá ou subirá é a pergunta de "um milhão de reais", se é que você me entende. O mesmo vale para o mercado de bolsa, dólar etc...
Português
1
0
1
60
Alexandre Galvão Patriota
Alexandre Galvão Patriota@agpatriota·
@Quant_Br @vowtz Sim, eu vi que os DI1F estão subindo na última semana. Mas isso é variável e daqui a uma semana pode mudar. Queria saber se há alguma espectativa de que caia ou se pelo andar da carruagem vai permanecer acima dos dois dígitos
Alexandre Galvão Patriota tweet media
Português
2
0
1
158
QuantBr
QuantBr@Quant_Br·
@agpatriota @vowtz Professor, no momento mercado está precificando que a Selic tem boas chances de subir até o fim do ano.
Português
1
0
1
61
Alexandre Galvão Patriota
Alexandre Galvão Patriota@agpatriota·
@vowtz Oi, Leandro, É possível ter alguma esperança de que a taxa de juros de mercado vai cair até o final do ano abaixo dos dois dígitos e se manterá abaixo consistentemente?
Português
1
0
0
212
QuantBr retweetledi
cephalopodshop
cephalopodshop@macrocephalopod·
Correlation between your signal and future returns is an important metric in quant trading. But what is a “good” correlation? Here’s a simple way to think about it.
English
11
102
1.1K
211.6K
QuantBr
QuantBr@Quant_Br·
As simple as that!
cephalopodshop@macrocephalopod

@PeterHomer14 Calculate returns on each contract by doing ret(t) = price(t)/price(t-1) - 1, splice together the sequence of returns for each contract to get a continuous series, form a cumulative return index cumprod(1 + ret) and never think about prices again.

English
0
0
2
103
QuantBr retweetledi
Peyman Milanfar
Peyman Milanfar@docmilanfar·
One of the lesser known ways to compare estimators is "admissibility". An estimator θ* = g(θ,y) of θ from data y is called *in*admissible if g is uniformly dominated by another estimator g(θ,y) for all values of g(θ,y), say in the MSE sense. 1/6
Peyman Milanfar tweet media
English
8
25
273
50.2K
QuantBr retweetledi
Frank Nielsen
Frank Nielsen@FrnkNlsn·
🤔"What is... an inductive mean?" (AMS Notices) Inductive mean = limit of a converging sequence of other means like the arithmetic-geometric mean or the arithmetic-harmonic mean IMs for complex numbers, matrices, functions Geometry of IMs 👉 ams.org/journals/notic… (PDF)
Frank Nielsen tweet media
English
2
40
243
12.7K
Dr. Watson
Dr. Watson@NewsRelevant5·
Da série "Mamãe, quero ser quant". Ah tá, filho. Então digira isto:
Dr. Watson tweet media
Português
4
1
26
2.6K
QuantBr retweetledi
Peyman Milanfar
Peyman Milanfar@docmilanfar·
The perpetually undervalued least-squares: minₓ‖y−Ax‖² can teach a lot about some complex ideas in modern machine learning including overfitting & double-descent. Let's assume A is n-by-p. So we have n data points and p parameters 1/9
Peyman Milanfar tweet media
English
9
100
674
67.2K
QuantBr retweetledi
Gabriel Peyré
Gabriel Peyré@gabrielpeyre·
Iterative least square minimizes a robust loss function (eg l1 norm) by approximating it with an upper-bounding surrogate quadratic function. francisbach.com/the-%CE%B7-tri…
English
4
117
698
34.3K
QuantBr retweetledi
Restructuring__
Restructuring__@Restructuring__·
BOND MATH: A SIMPLE OVERVIEW OF DURATION AND CONVEXITY As another bank crisis unfolds, good time to learn the most important concepts of bond math: duration and convexity. DURATION Duration is a measure of a bond's sensitivity to changes in interest rates: what is the bond price change associated with a 1% change in its yield? Specifically, duration measures the weighted average time it takes for a bond's cash flows to be received. The top left table of the image gives a good representation of this concept. The duration is 7.8 years. If I change the yield from 6% to 5%, the price increases by ~7.8% ($1,077 from $1,000) as you can see on the middle right side of the image. On the other hand, if interest rates rise, the present value of the bond's future cash flows decreases, leading to a decrease in the bond's price. Bonds with longer durations have higher interest rate risks since small changes in interest rates can have a significant impact on the bond's price. Additionally, zero-coupon bonds have higher durations since all cash flows are received at maturity, making them more sensitive to interest rate changes. If you are careful when looking at the picture, you can notice how the duration of the case on the right side is now 7.89 years (higher than the original 7.80 years). The duration has changed because the change in rates changed the weighted average life (you can notice how the time * weight columns are different in the two cases). This change is what is called the bond convexity. CONVEXITY Convexity measures the curvature of the relationship between a bond's price and yield. A bond with higher convexity will have a more pronounced response to interest rate changes than one with lower convexity. Think about convexity as the change in the weighted average life associated with a 1% change in its yield. Positive convexity means that the relationship is curved upward, indicating that a bond's price will increase more than it would decrease for a given change in yield. Negative convexity means the opposite, indicating that the bond's price will decrease more than it would increase for a given change in yield. The graph at the bottom shows a dynamic that is essential to understand for investors: the price change is slow as yields rise, but it can be significantly faster as yields decrease. This is why the upside / downside for every percentage increase / decrease in yield is often very asymmetric presenting investing opportunities. For example, if we start from a starting 6% yield, a 2% increase in yield would lead to a 24% loss while a 2% decrease in yield would lead to a 40% gain (1.66x upside / downside ratio). The upside / downside ratio increases even more as the change in yield increases. As shown, a increase / decrease in yields of 5% leads to a upside / downside ratio of 3.67x, compared to the 1.66x above. SUMMARY AND REAL LIFE APPLICATIONS As we learned, duration and convexity both measure a bond's sensitivity to changes in interest rates. However, duration measures sensitivity to interest rate changes linearly while convexity measures it non-linearly, accounting for the curvature of the bond's price-yield relationship. This means that while duration can estimate price changes for small interest rate changes, convexity provides a more accurate estimate for larger changes. Understanding the duration and convexity of a bond helps investors estimate potential losses or gains given interest rate changes and adjust their portfolios accordingly. Additionally, convexity provides a more accurate estimate of potential gains in rising yield scenarios, which is particularly valuable in distressed investing. In the private credit world, duration and convexity are often used to value bonds in distressed or special situations. For example, if a private credit lender is considering investing in a distressed company's bonds, they may use duration and convexity to assess the bond's sensitivity to interest rate changes and model the potential impact on the bond's price in different scenarios. Similarly, if a private credit lender is considering restructuring a company's debt, they may use duration and convexity to assess the potential impact of changes to the debt structure on the bond's price. ---- If this is too easy for you, check out our newsletter in my bio if you are interested in additional / more advanced content. Future editions are free but posts go behind paywall once published so make sure to subscribe now!
Restructuring__ tweet media
English
26
198
1.4K
310K