Realist

1.7K posts

Realist banner
Realist

Realist

@RealistNoReally

Two sides to every story and every trade. Stocks, Bonds, Long / Short. Family, outdoors, intelligent debates. I’m not selling anything.

United States Katılım Ekim 2023
228 Takip Edilen346 Takipçiler
Sabitlenmiş Tweet
Realist
Realist@RealistNoReally·
The “Boring” Brilliance of the Contrarian Bond Play I know what you’re thinking: bonds aren’t exactly “exciting.” They lack the viral pull of AI-driven tech stocks. But in investing, the most profitable moves often happen in the quiet corners of the market that the crowd is ignoring. Protecting wealth is equally important to growing wealth. When an asset class is out of favor, it creates a prime opportunity for the disciplined investor. Check my free Substack article for my thoughts on Protecting Wealth in an Age of Debt & Deficits. open.substack.com/pub/eric5280/p…
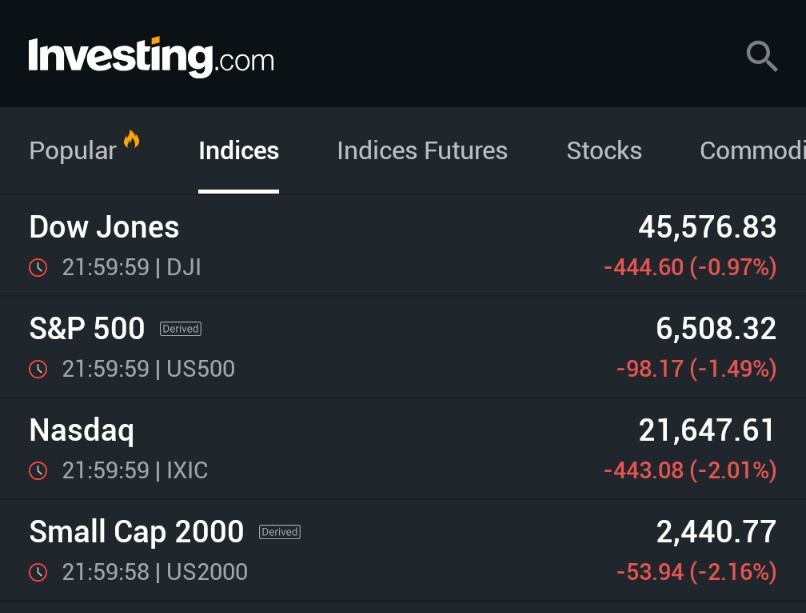
 $SPY $QQQ $TIPS
English
0
1
9
25.3K
Realist
Realist@RealistNoReally·
100%! I've been adding significantly to 20-30-year TIPS with real yields near ATHs. I hate to say it, but TIPS could outperform equities for several years if oil remains high and broadly impacts the global economy and inflation. Financial advisor generally steer clear of them. It’s hard to charge 0.5-1% advisor fees on TIPS but individuals should be adding in retirement accounts. I posted this back in December (and rates are even higher now). @eric5280/note/p-182172713?r=217g9x&utm_medium=ios&utm_source=notes-share-action" target="_blank" rel="nofollow noopener">substack.com/@eric5280/note…
English
0
0
1
15
Neil Sethi
Neil Sethi@neilksethi·
Great thread from Liz Thomas explaining the divergence between 1-yr inflation breakevens (which are calculated from the yield differential in TIPS vs nominals) which have shot higher vs inflation swaps (pricing for specific future CPI prices) which are little changed, meaning the jump in "market implied inflation expectations" is really just an investor preference for TIPS. Such a rush into TIPS has some support from a Goldman note where they breakdown the perfromance of TIPS during oil shocks: We estimate that TIPS on an outright basis generated meaningfully (hypothetical) positive total returns in the 1970s and 1990—owing to a combination of lower TIPS yields and high underlying inflation (Exhibit 4). While TIPS returns were negative in 2022, in all instances returns to being long TIPS were superior to being long nominals from the start of the shock to the oil peak. After the peak the relative performance picture more closely resembles distinctions between the two 1970s energy shocks and the more recent ones. The more sustained inflation problems in the earlier episodes meant TIPS returns exceeded nominals in the period following the oil surge, whereas in 1990 and 2022 nominals were the better option once oil had peaked and inflation risks began to abate.
Neil Sethi tweet media
Liz Thomas@LizThomasStrat

We're seeing some serious market dislocation on inflation 🚨 1-year Treasury breakevens currently imply 5.2% inflation over the next year. But 1-year inflation swaps are showing just 3.2%. What gives? It comes down to how these two metrics are actually calculated. 🧵👇

English
2
1
20
3.5K
Realist
Realist@RealistNoReally·
@StockMKTNewz Retirement accounts: up 2.04% YTD Trading account (long / short) up 17.77% YTD
English
1
0
1
86
Evan
Evan@StockMKTNewz·
THIS IS A SAFE SPACE How has your portfolio done so far in 2026
English
412
10
386
145.3K
Realist
Realist@RealistNoReally·
@StockSavvyShay @FuturumEquities No one believes the analysts' earnings estimates for 2027. They assume the economy strengthens from here, which may not be the case with higher inflation and lower growth (whiffs of stagflation...).
English
3
0
5
928
Shay Boloor
Shay Boloor@StockSavvyShay·
ThE mArKeT iS iN sUcH a BuBbLe Yet here are the 2027 multiples for some of the largest companies in the world: • $AMZN ~21x • $MSFT ~19x • $GOOGL ~19x • $AMD ~19x • $ORCL ~18x • $AVGO ~17x • $TSM ~16x • $NVDA ~15x • $META ~13x • $CRM ~12x • $ADBE ~9x • $MU ~4x
Shay Boloor tweet media
English
172
258
2K
268.6K
Jesse Cohen
Jesse Cohen@JesseCohenInv·
🚨🇺🇸 Restaurant stocks are in freefall. What happened to the US consumer?
Jesse Cohen tweet mediaJesse Cohen tweet mediaJesse Cohen tweet mediaJesse Cohen tweet media
English
3.1K
915
5.3K
1.1M
Ben Kizemchuk
Ben Kizemchuk@BenKizemchuk·
A proprietary momentum signal triggered on VIX today. This is incredibly rare. The last occurrence was on July 24, 2007, just days before the eruption of the “quant quake.” Back then, the quant quake unfolded as a sharp and disorderly unwind of highly leveraged, market‑neutral quant strategies, triggered by a sudden and unexpected rise in funding costs. At the time, the widely watched TED spread, a measure of credit risk in the banking system, spiked abruptly. The TED spread reflected the difference between interbank lending rates (LIBOR, RIP🪦) and the risk‑free tbill rate. For quant funds that depended heavily on stable, low cost financing, this jump in funding stress proved especially destabilizing. These funds were running with significant leverage and were heavily crowded into similar long/short factor positions. Even though they viewed themselves as hedged, operating largely market‑neutral and low‑beta portfolios at the time, their exposures were far from independent. They were all essentially leaning on the same factors, the same signals, and the same assumptions about their diversification. They did not account for their peers all essentially being in the same trades. So when funding conditions tightened, this hidden crowding risk was revealed: a modest increase in financing costs forced multiple funds to deleverage simultaneously. What began as isolated unwinds quickly accelerated as funds sold positions to meet balance sheet constraints. Losses mounted, and internal risk systems, like value-at-risk (VaR) thresholds, began to trip. These risk control mechanisms forced additional selling at the worst possible time, creating a mechanical feedback loop. Forced unwinds drove prices lower, which triggered more risk‑model breaches, which triggered more selling, overwhelming normal market liquidity. Correlations across previously uncorrelated strategies surged, and liquidity evaporated. A localized funding shock rapidly transformed into a broad, systemic quant unwind. Today’s environment bears an unsettling resemblance to the setup that preceded the quant quake. In the current cycle, multi‑strategy and equity hedge funds have again shifted toward market‑neutral, low‑beta positioning, as shown in the December 2025 Form PF data. After the September 2025 degrossing wave, funds cut directional exposure, reduced factor risk, and unwound crowded longs, pressures that fed directly into equity weakness and deteriorating liquidity we’re seeing now. Yet even as net exposure fell, gross leverage rose, indicating that managers have rebuilt financing‑heavy neutral long/short structures. Their portfolios may now appear low‑risk on the surface, but substantial embedded leverage remains underneath. The parallel to 2007 is the illusion of safety created by market‑neutral construction. Just as quant funds once believed they were hedged while crowding into the same factor bets, today’s funds likely hold portfolios that look neutral but are structurally fragile. As dispersion hedging has been unwound in recent weeks and correlations have risen, the universe of truly “liquid” market‑neutral trades has narrowed. Near record-high gross leverage supported by repo, prime broker loans, and margin financing means even modest funding stress can trigger rapid unwinds. The Form PF data suggests that today’s leverage buildup reflects financing‑intensive exposures rather than renewed directional risk. These balance‑sheet‑heavy trades now dominate. These are positions that can quickly become correlated and unstable under pressure. The funding backdrop today also echoes elements of the 2007 setup, though the indicators have changed. The TED spread is no longer a central gauge of stress, as LIBOR is no more, but modern equivalents, such as the spread between SOFR and OBFR, convey a similar message. Recent declines in reserve balances, driven in part by the federal government shutdown in 2025, pushed the SOFR‑OBFR spread higher, revealing tightening liquidity across both secured and unsecured overnight funding markets in 2025. With reserves still running materially below year‑ago levels and another seasonal tax drain approaching in April, the conditions are in place for a sudden and disorderly tightening in funding markets. And this is where the analogy to 2007 becomes most concerning. Then, as now, funds believed their portfolios were insulated by market neutrality and factor diversification. But when funding tightened abruptly, leverage became the transmission channel through which small shocks escalated into forced deleveraging. Today’s mix of high gross leverage, financing‑dependent structures, thinning liquidity, and suppressed net risk creates a similarly fragile setup. If the April tax drain further constricts reserves and widens the SOFR‑OBFR spread, hedge‑fund financing channels could strain quickly. That would likely trigger renewed deleveraging, reductions in equity and macro exposures, and potentially accelerate downside volatility. It’s worth remembering that we already saw a preview of this dynamic in October 2025, when a mini‑quant‑quake style unwind hit several major quant funds. Potentially amplifying this in 2026, recent Commitment of Traders report data from the CFTC is showing a steady buildup in VIX futures exposure. Asset managers and non‑commercial speculators such as institutional investors, CTAs, global macro funds, and other systematic strategies are accumulating. This matters because VIX futures trade on relatively thin liquidity, making large speculative positioning potentially self‑reinforcing. If volatility rises, trend‑following strategies may continue to increase long‑vol exposure mechanically, steepening moves in the futures curve. The structural plumbing connecting VIX derivatives to the equity market means that large VIX futures positions can ultimately transmit risk back into S&P 500 futures: rising volatility forces dealers who are short gamma or short vega to sell S&P futures to maintain hedges, depressing the index. Lower S&P levels push implied volatility higher, which in turn lifts VIX futures and forces further hedging. This can produce a positive‑feedback environment in which volatility products begin to influence equity behavior. Additionally, the S&P 500 is now trading below the JPM collar strike, which effectively acts as kryptonite for the index. As long as spot remains under that strike, dealer hedging flows require selling S&P futures on any attempt to move higher, turning the strike into an overhead barrier. This dynamic persists until the collar expires on March 31, keeping upward momentum capped and reinforcing downside pressure. Taken together, today’s rare VIX momentum trigger, combined with the ongoing buildup in long‑volatility positioning, and parallels to the conditions leading to the quant quake of 2007, all point to a system increasingly vulnerable to a self‑reinforcing volatility feedback loop. The result could be a deep and disorderly move lower in equities into mid-April. Incidentally, the roughly 7% drawdown over 17 trading days from the 2007 VIX momentum‑trigger date into the quant‑quake lows aligns with my previously noted short‑term view of the S&P 500 trading down toward the 5800–6000 range into mid‑April from today’s VIX momentum‑trigger date.
Ben Kizemchuk tweet mediaBen Kizemchuk tweet mediaBen Kizemchuk tweet mediaBen Kizemchuk tweet media
English
28
65
369
42.8K
Rick Rule Rhetoric
Rick Rule Rhetoric@RickRuleRulz·
“The top 3 mining equity investments in the world right now would be Franco Nevada, Wheaton Precious, and Agnico Eagle. If we are lucky enough to see a circumstance where Barrick, rather than spinning out their North American assets, combines their North American assets with Newmont’s North American assets, then you would potentially have a fourth entrant.”
English
7
37
347
37.5K
Realist
Realist@RealistNoReally·
@DeItaone @grok are other central banks buying or selling gold recently? How much impact does Turkey selling have on the gold market?
English
1
0
0
3.2K
*Walter Bloomberg
*Walter Bloomberg@DeItaone·
TURKEY’S CENTRAL BANK GOLD RESERVES SEE BIGGEST WEEKLY DROP SINCE AUG 2018, SELL ABOUT 22 TONNES LAST WEEK: BANKERS
English
67
255
1.5K
555.1K
Realist
Realist@RealistNoReally·
@Mr_Derivatives $SOFI is almost down 50% from its ATHs just 4 months ago.
English
1
0
2
968
Heisenberg
Heisenberg@Mr_Derivatives·
$SOFI fresh 9 month lows today. Damn you Muddy Waters. Damn you to the depths of….
English
48
7
337
55.3K
Realist
Realist@RealistNoReally·
@RenMacLLC Thanks. There is always more to it. Do you have any data points to share with the community on this?
English
0
0
1
28
Realist
Realist@RealistNoReally·
@MebFaber TIPS and Chill? 2.7% Real Yield seems like a decent entry if you’re closer to retirement.
English
0
0
0
85
Realist
Realist@RealistNoReally·
@SullyCNBC Just flew out of Denver…zero lines (seriously way faster today than normal).
English
1
0
0
307
Brian Sullivan
Brian Sullivan@SullyCNBC·
Houston.. we have a problem 4-5 hour security lines seems close to nonoperational.
Brian Sullivan tweet media
English
30
10
131
16.4K
MacroEdge
MacroEdge@MacroEdgeRes·
The flow of liquefied natural gas from the Gulf is expected to come to an abrupt end in the next 10 days #MacroEdge
English
11
121
605
36.9K
The Long Investor
The Long Investor@TheLongInvest·
What position can you not buy enough of right now?
English
257
4
220
112.7K
Realist
Realist@RealistNoReally·
It would be great to see your thoughts: Agricultural prices could take off with fertilizer prices skyrocketing (and drought in western US). Gold may have some technical support (or not). Rumors that central banks are selling gold (with oil way up), but I can’t find anything to back that up (it still looks like they are buying).
English
0
0
1
52
Realist
Realist@RealistNoReally·
@StockSavvyShay $SOFI doesn’t meet the market cap minimum for S&P 500. They can’t even be considered right now.
English
3
0
0
160
Shay Boloor
Shay Boloor@StockSavvyShay·
Dear S&P 500 Committee, You added $SMCI at the top and then watched it lose ~80% (allegedly with a little help from a hair dryer). You have the chance to swap that out for $SOFI which has a banking license, 13.7M members and is guiding for at least 30% CAGR through 2028 (all without ever needing heat tools to pass an audit). We think you know what to do.
Shay Boloor tweet mediaShay Boloor tweet media
English
102
160
1.8K
225.7K
Keith McCullough
Keith McCullough@KeithMcCullough·
I got us out of this Bridgewater 'All Weather' $ALLW before it got smoked today. Down -3.1% looked more like All Clouds, No Umbrella. @dsaleminvestor @HedgeyeRJM
GIF
English
5
3
32
7.6K
Realist
Realist@RealistNoReally·
@kkmaway I’m buying TIPS, still avoiding nominal bonds. And I added some gold today.
English
0
0
1
49
Krishna Memani
Krishna Memani@kkmaway·
The real question in this dip is if you have some cash to spare, are you buying bonds or stocks....duration of the conflict end up being the determining factor...IOW, don't hate bonds so much. It pollutes your thinking.
English
14
5
63
12.1K
Realist
Realist@RealistNoReally·
@JesseCohenInv $GLD down 10.3% this week seems more significant
English
2
0
2
152
Jesse Cohen
Jesse Cohen@JesseCohenInv·
Nasdaq 100 and Russell 2000 in correction territory. Dow and S&P 500 near correction territory. Absolutely brutal week for the bulls.
Jesse Cohen tweet media
English
32
53
266
22K
Realist
Realist@RealistNoReally·
@JesseCohenInv Hmm…Down 1.7-1.85% on the week seems pretty insignificant. Hard to say it's brutal.
English
2
0
2
151