Sman Cometh

13.5K posts

Sman Cometh banner
Sman Cometh

Sman Cometh

@STaylor76084368

Investor, trader, songwriter, musician, outdoorsman

Katılım Şubat 2019
78 Takip Edilen860 Takipçiler
Sabitlenmiş Tweet
Sman Cometh
Sman Cometh@STaylor76084368·
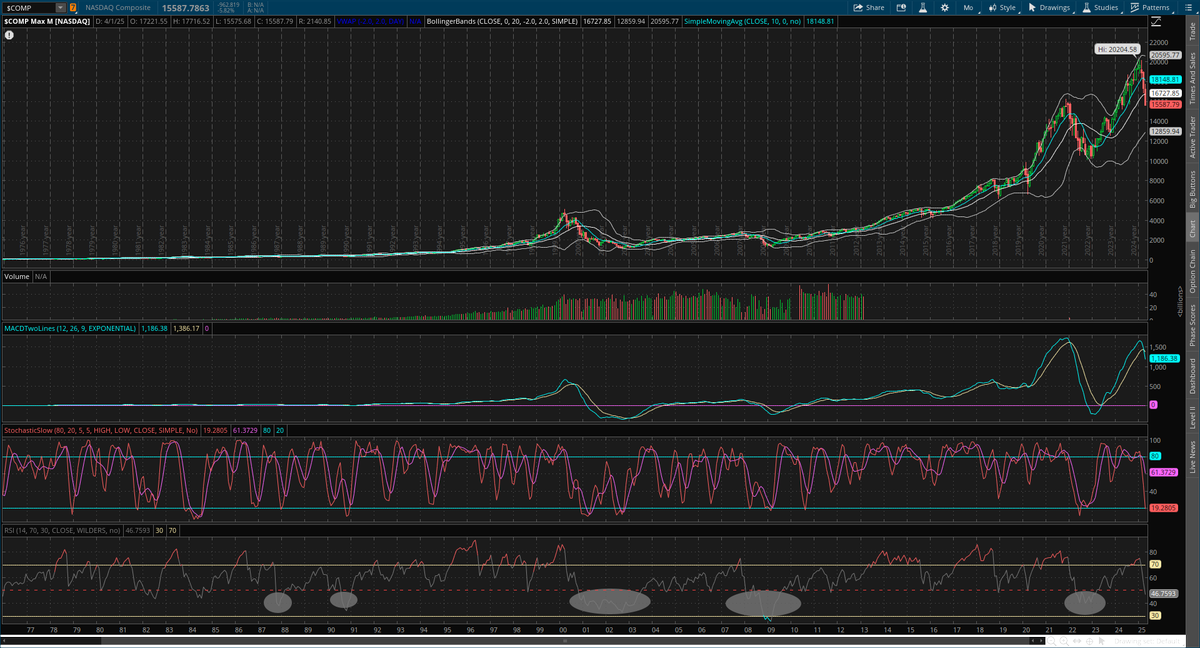
$NASDAQ Monthly Since 1976 - RSI (47) Is At LT Levels Associated w/ Bottoms as is Slow Stoch - Last 3 times NAS lived below RSI 50 for extended period: 2001-2003, 2008-2009,2022 Early April BUT keeping👀on. $SPX $NDX $VIX $NYSE $QQQ $IWM $DIA #stockmarketcrash
Sman Cometh tweet media
English
5
1
15
6.3K
Sman Cometh retweetledi
Ryan Detrick, CMT
Ryan Detrick, CMT@RyanDetrick·
Yes, the worst six months are coming up soon (May - October). But these six months have been lower only once the past decade and last year was the greatest Sell in May return ever (+22.8%). We are expecting another strong return this year.
Ryan Detrick, CMT tweet media
English
23
70
496
49.4K
Sman Cometh retweetledi
fxevolution
fxevolution@fxevolution·
The amount of huge transactions going through semiconductor stocks is increasing and today we saw some MASSIVE ones on $SMH and also $SOXL. Is something big about to happen? 🤔🤔 source: @VolumeLeaders
fxevolution tweet media
English
16
12
132
13.3K
Sman Cometh retweetledi
Frank Cappelleri
Frank Cappelleri@FrankCappelleri·
$SPX just hit overbought for the first time since September and remains in a steep uptrend. This mirrors last spring: after first tagging the RSI’s 70 threshold, momentum cooled, but the trend held and simply flattened. The next phase now could resemble this...
Frank Cappelleri tweet media
English
20
30
214
19.2K
Sman Cometh retweetledi
Warren Pies
Warren Pies@WarrenPies·
A historic earnings boom is developing. Estimates growing faster than they did in the mid-90s or late internet bubble years. Only covid recovery period saw a greater inflection. This boom is unique b/c it is not coming off an EPS drawdown (recovery).
Warren Pies tweet media
English
59
161
1K
114.6K
Sman Cometh retweetledi
Helene Meisler
Helene Meisler@Chartfest1·
SOXS with volume that is literally off the charts.
Helene Meisler tweet media
English
37
42
371
71.6K
Sman Cometh retweetledi
Frank Cappelleri
Frank Cappelleri@FrankCappelleri·
$SPX: 🔴 Down 3/4 days. 🟡 Down just 35 bps in 4 days after 3 huge weeks. 🟢 Now forming a potential bullish continuation pattern.
Frank Cappelleri tweet media
English
15
8
117
11.4K
Sman Cometh retweetledi
Wayne Whaley
Wayne Whaley@WayneWhaley1136·
THE S&P DURING THE WEEK OF APRIL21-28 OF MIDDLE ELECTION YEARS I see the S&P during April21-28 of mid election years as 6-18 since 1930 for an avg loss of 1.61% with the 1% moves 2-13. As reference, the S&P was 52-44 for an avg loss of 0.19% during the same week of all post 1930 years.
Wayne Whaley tweet media
English
17
37
144
19.9K
Sman Cometh retweetledi
Jason Goepfert
Jason Goepfert@jasongoepfert·
Why the coming week is crucial... Tech stocks rallied 20% in 3 weeks. That's (usually) either a market bottom or a near-peak in a bear market rally. The big tell: if buyers persisted over the following week, it was (usually) the former. Bulls want $XLK > 154 next week.
Jason Goepfert tweet mediaJason Goepfert tweet media
English
27
38
262
45.4K
Sman Cometh retweetledi
ISABELNET
ISABELNET@ISABELNET_SA·
🇺🇸 S&P 500 History shows the same script in over 20 major events since WWII: markets snap back quicker than feared, and those who hold their nerve often win. Panic usually hurts more than the shock itself 👉 isabelnet.com/?s=S%26P+500 h/t @LanceRoberts $spx #spx #equity #stocks
ISABELNET tweet media
English
1
12
41
5.2K
Sman Cometh retweetledi
Mike Webster
Mike Webster@mwebster1971·
A NEW Power Trend started TODAY! Yesterday, I recorded a new Webby Rambles On, combining two VIP concepts: my Webby RSI & the Power Trend I reviewed all important Power Trends going back over 120 years!! You'll learn a TON (I did) WRO #68 drops Saturday morning on Webby5150!
Mike Webster tweet media
English
11
24
242
12.7K
Sman Cometh retweetledi
Frank Cappelleri
Frank Cappelleri@FrankCappelleri·
The $SPX's 14-period RSI on the 2-hour chart was STILL overbought through Monday's close, a condition that reflects just how persistent and one-sided this advance has been. What really stands out is both how long it took for momentum to re-enter overbought territory and, more importantly, how long it has stayed there without interruption...
Frank Cappelleri tweet media
English
7
15
118
18.4K
Sman Cometh retweetledi
fxevolution
fxevolution@fxevolution·
THE FED’S FAVORITE INFLATION GAUGE JUST GOT CALLED A “ROUGH SWAG” At his confirmation hearing, Kevin Warsh didn’t just disagree with the Fed. He questioned the metric they rely on most. Core PCE sitting at 3.0% YoY was dismissed as a “rough swag.” That’s not a minor critique. That’s a direct challenge to the foundation of Fed policy. 📊 What Warsh Is Looking At Instead Instead of headline Core PCE, he pointed to: Dallas Fed Trimmed Mean → 2.3% Cleveland Fed Median CPI → 2.8% Both strip out volatility. Both suggest inflation is closer to target than the Fed admits. 🧠 Why This Matters for Traders If policymakers shift toward these measures: Inflation suddenly looks less sticky The case for rate cuts strengthens The market’s “higher for longer” narrative weakens Translation: The data didn’t change. The interpretation did. And that’s what moves markets. ⚠️ The Risk No One Is Pricing But this cuts both ways. If Warsh is right → policy is too tight. If he’s wrong → the Fed risks easing into still-sticky inflation. And that’s how policy mistakes happen. Not from bad data But from misreading the data that’s already there. When the framework shifts, volatility follows.
fxevolution tweet media
English
8
13
67
6.4K
Sman Cometh retweetledi
mon
mon@moninvestor·
For a lot of people, ETFs are genuinely the smarter move, and recognising that early saves you a lot of pain.
mon tweet media
English
11
4
120
14.9K
Sman Cometh retweetledi
Finom Group AYNI Luis Solórzano
Nasdaq Momentum Breadth Thrust triggered: As shown in chart attached, the Nasdaq McClellan Oscillator achieved greater than 80+ (top panel). Every time this has occurred since 2017, the index (bottom panel) was higher a year later 💯 $COMPQ $NDX $QQQ $SPX $SPY @FrankCappelleri
Finom Group AYNI Luis Solórzano tweet media
English
1
15
68
6.7K
Sman Cometh retweetledi
The Chart Report
The Chart Report@TheChartReport·
This was the strongest 16-day rally on record for semiconductors. @mattcerminaro
The Chart Report tweet media
English
2
13
65
5.8K
Sman Cometh retweetledi
Walter Deemer
Walter Deemer@WalterDeemer·
Breakaway Momentum Watch: Will now take a miracle -- 2550 net advances tomorrow (i. e. no more than 150 declines). But the bulls do have that Whaley Price Thrust working for them...
English
2
17
275
21.1K
Sman Cometh retweetledi
Daily Chartbook
Daily Chartbook@dailychartbook·
"We estimate that CTAs bought $44bn of US equities last week and $84bn globally. Over the next week, we estimate CTAs will continue to buy US and global equities in every scenario." -GS Morgan
Daily Chartbook tweet media
English
2
31
147
11.9K