

Sat Living⚡️
7.3K posts

@SatifyLife
Charts | Macro Flows | Articles | History | Art | Music


"A Breakthrough": White House Says Strategic Bitcoin Reserve Announcement Is Imminent zerohedge.com/crypto/breakth…


Expert-level post. I may have reverse-engineered what @Strategy is doing with $STRC and $MSTR. This is not really a “preferred stock” story. It’s a synthetic internal yield curve for capital funding. The real spread is NOT: STRC yield vs SOFR The real spread is: MSTR market premium (mNAV) vs STRC funding cost. Strategy itself has effectively identified ~1.22x mNAV as an issuance floor. But once you layer in an 11.5% STRC funding cost, 1.22x is STILL negative carry. That means: (1.22 - 1.22) - 11.5% = -11.5% So the system only works if BTC/share growth (their “BTC Yield”) exceeds the funding drag. This is why the 10% BTC Yield (increase in ₿PS) target matters so much and is most likely a low number and easy for them to beat. It’s not a random KPI. It’s a reflexive sustainability threshold. The actual breakeven appears closer to ~1.33x mNAV: 1.33 - 1.22 ≈ 11.5% Below that, the curve is inverted. Above that, positive reflexive carry resumes. The heat map below is effectively a synthetic sovereign-style funding curve for Strategy. Red = destructive financing regime Orange = weak equilibrium Green = positive reflexive carry Dark green = convex accretion regime This is also why mNAV matters far more now than it did a year ago. Before STRC, mNAV was mostly a valuation metric. After STRC, mNAV became a funding spread.

@Z06Z07 @TimKotzman @Strategy @saylor @phongle Forgive me for not getting this Grain What’s the math behind 1.22x being the issuance floor? (Before we get to it being 1.33)

Bitcoin Agentic Currency Kilowatts (B.A.C.K.) to the Future! @jvisserlabs B — Bitcoin (Base Energy Layer) The monetary and energy anchor of the new era. Digital scarcity + energy monetization → foundational layer beneath everything. A — AI (Applications & Intelligence) The top of the stack where value becomes visible. Agents, workflows, and intelligence driving exponential utility. C — Compute (Chips + Infrastructure) The engine room. Semiconductors, data centers, networks — where capex flows heavily. K — Kilowatts (Energy) The limiting reagent. Power generation, distribution, and optimization — the true bottleneck of AI scale.


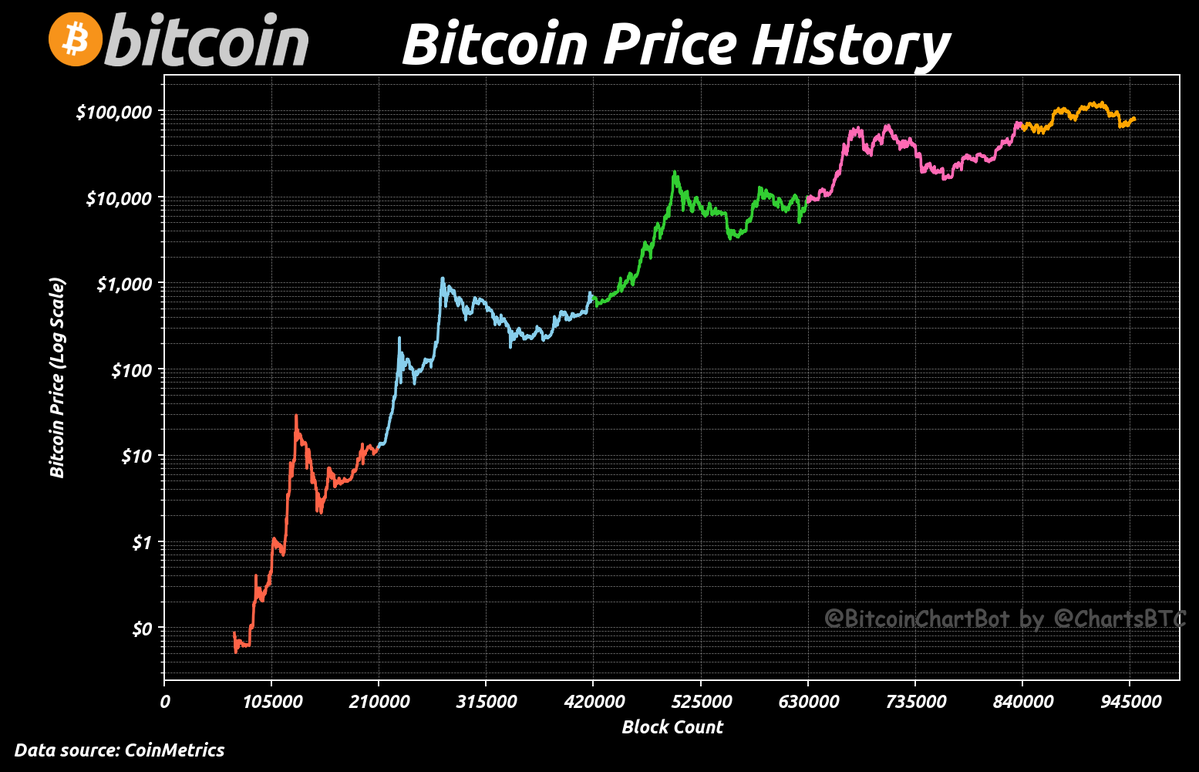
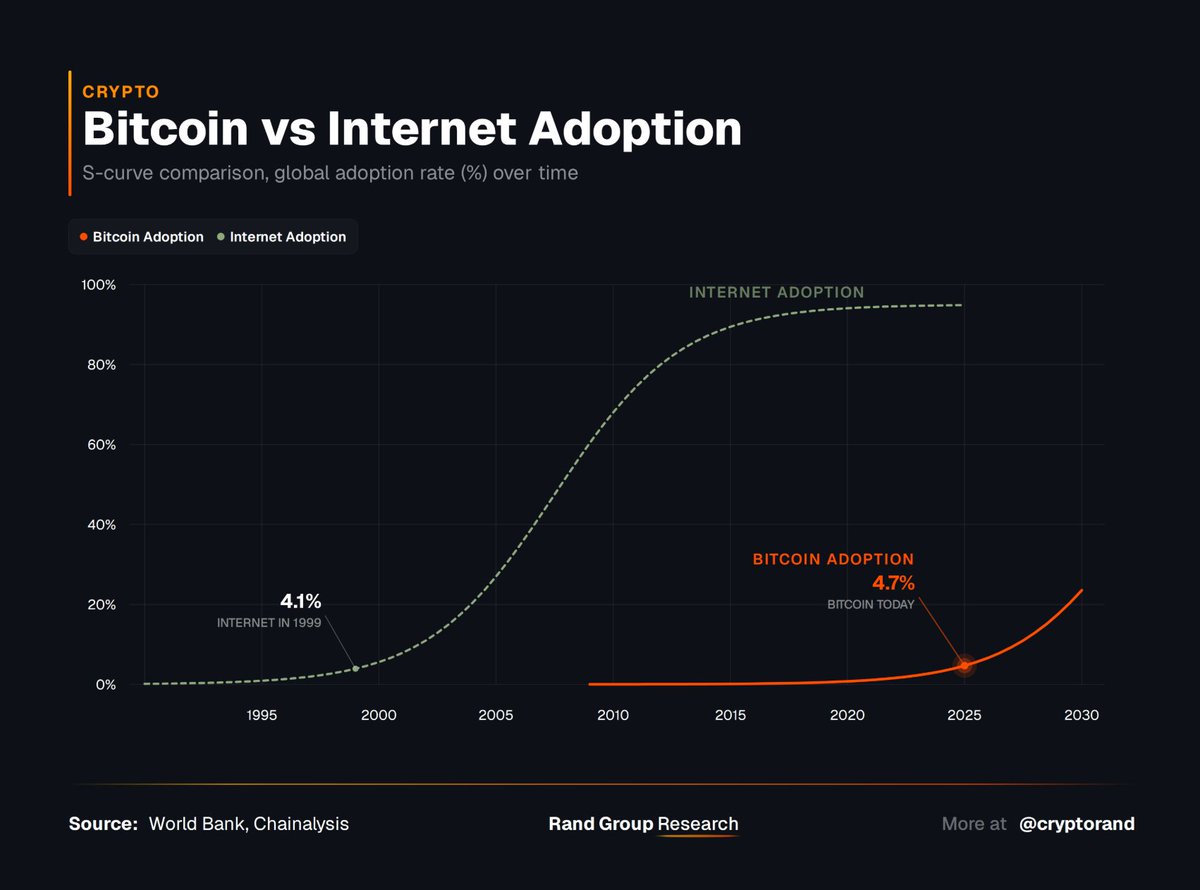
The standard Power Law just draws a line. BACK-κ solves for the exact acceleration constant (κ = 2.452). The precise rate at which Bitcoin's adoption curve bends through time. The B.A.C.K. (Bitcoin Acceleration Constant Kappa) takes the same historical data and instead interprets it as a parabola to take into account the Demand/Supply curve. 
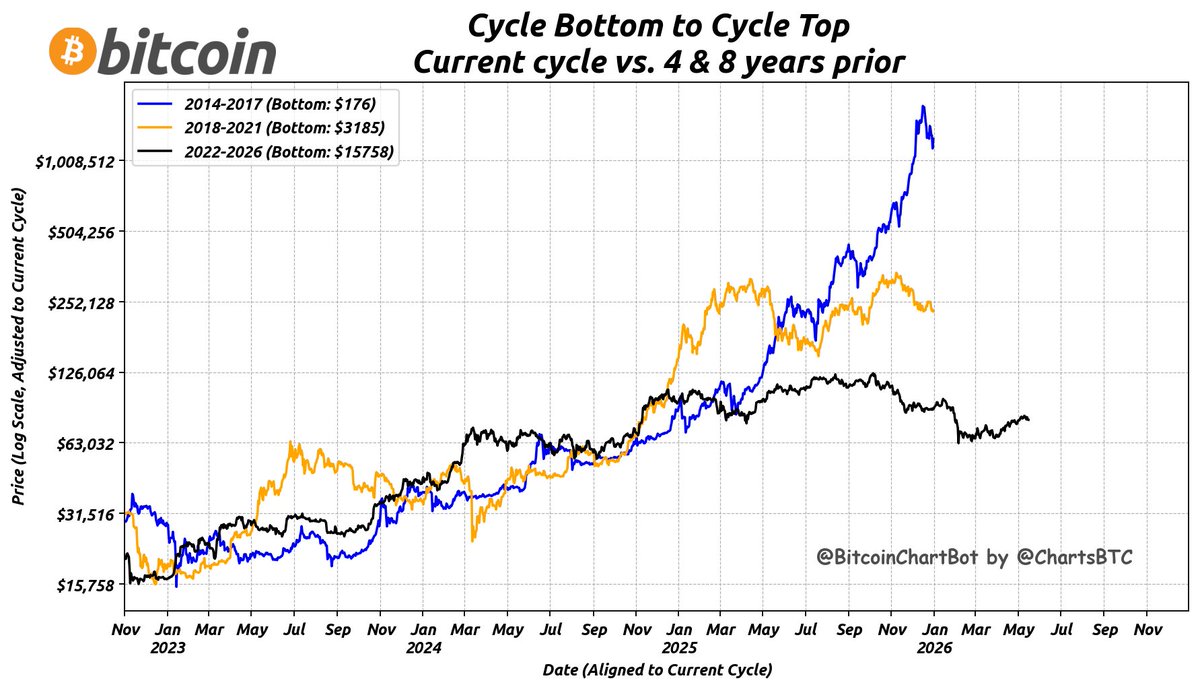
Right now BTC sits 38% below BACK-κ fair value — exactly where it sat at every major cycle bottom (2011, 2015, 2018, 2022). Every single time, it launched. But this cycle has a new variable: the Minsky moment. Japan is cracking. G7 debt is terminal. If sovereign stress hits while the spring is coiled: 🟡 Japan Soft Minsky → $1.2M 🟠 Carry Trade Unwind → $2.0M 🟢 BOJ QE Infinity → $3.9M 🔴 Full G7 Cascade → $7.2M 🟣 M2 Permanent Shift → $12.7M The spring is coiled. The fuse is lit. The only question is how big the explosion is.🟠

#Bitcoin Bottom to Top vs. 4 & 8 Years Ago Current Price: $80,924 Price 4 Years Ago: $31,295 (Scaled: $154,834) Price 8 Years Ago: $8,475 (Scaled: $758,801) as of 05/15/2026 $BTC #BottomToTop #BitcoinChartBot


