ScoGaun

1.9K posts

ScoGaun banner
ScoGaun

ScoGaun

@ScoGaun316

Business Owner • Investor • Proud Dad • Sports Junkie ~Life is a Journey, not a Destination. Appreciate Each Moment & Follow Your Dreams.

Katılım Aralık 2010
876 Takip Edilen236 Takipçiler
ScoGaun
ScoGaun@ScoGaun316·
@ohiain Cool I'll check Em out, thanks.
English
0
0
2
25
iain
iain@ohiain·
@ScoGaun316 I’ve posted them on my feed many times before!
English
1
0
1
72
iain
iain@ohiain·
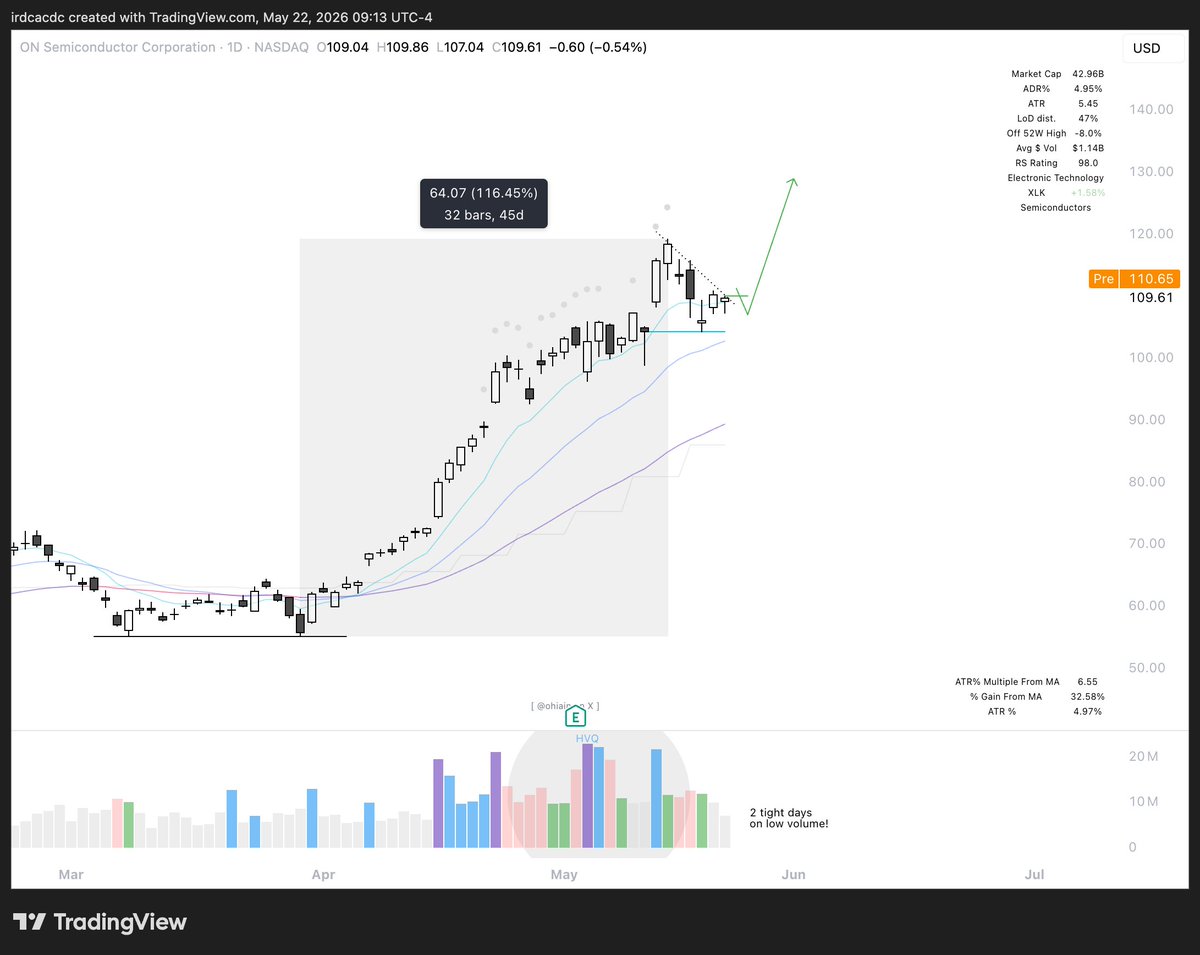
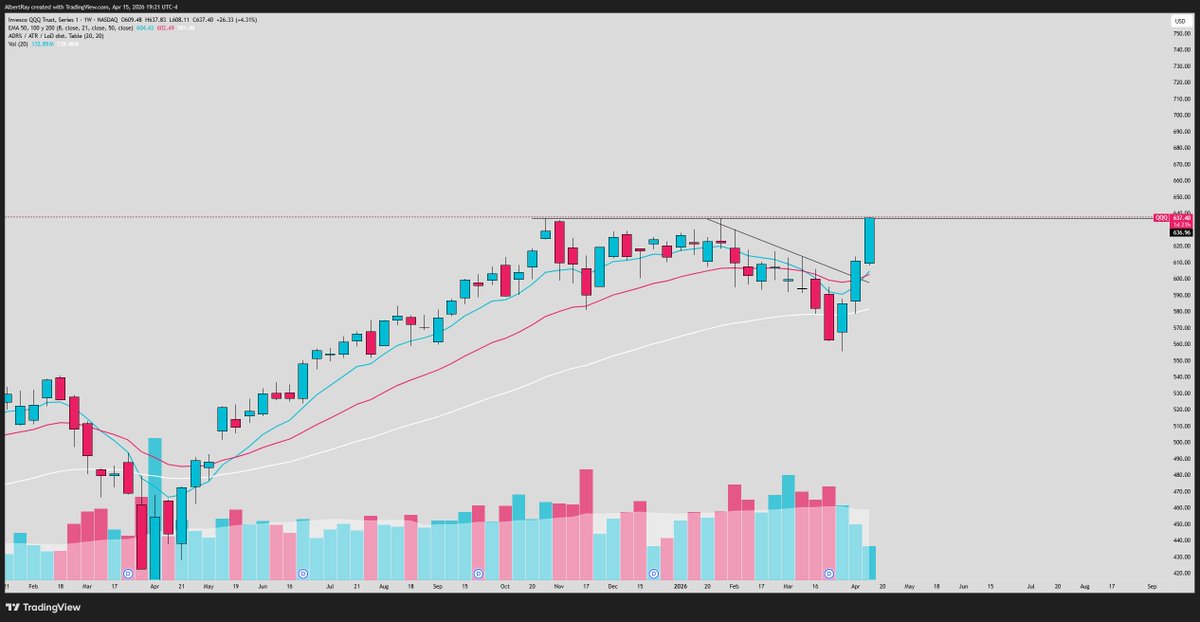
When I say I’m looking for “coiled” price action, what I’m really referring to is tightness on the chart. Names like: $ON, $LUNR, $CRCL + $AFRM. …are all good examples of what I’m watching as I head into today’s session. Tight ranges, volatility contraction, repeated higher lows, sellers getting absorbed near key pivots, and price respecting the 9/21EMAs instead of completely falling apart. That’s the type of action that usually grabs my attention because strong stocks often tighten BEFORE expansion! Think of it like a spring... "The tighter the coil becomes, the more powerful the potential release once momentum returns." Compression creates opportunity. Charts: $ON, $LUNR, $CRCL & $AFRM.
iain tweet mediaiain tweet mediaiain tweet mediaiain tweet media
English
7
19
186
12.4K
Casey | Trade Tracs
Casey | Trade Tracs@CaseyVSilver·
@SRxTrades I totally agree with you, It is part of my daily routine to check where money is rotating
Casey | Trade Tracs tweet media
English
2
0
2
272
Sean trades
Sean trades@SRxTrades·
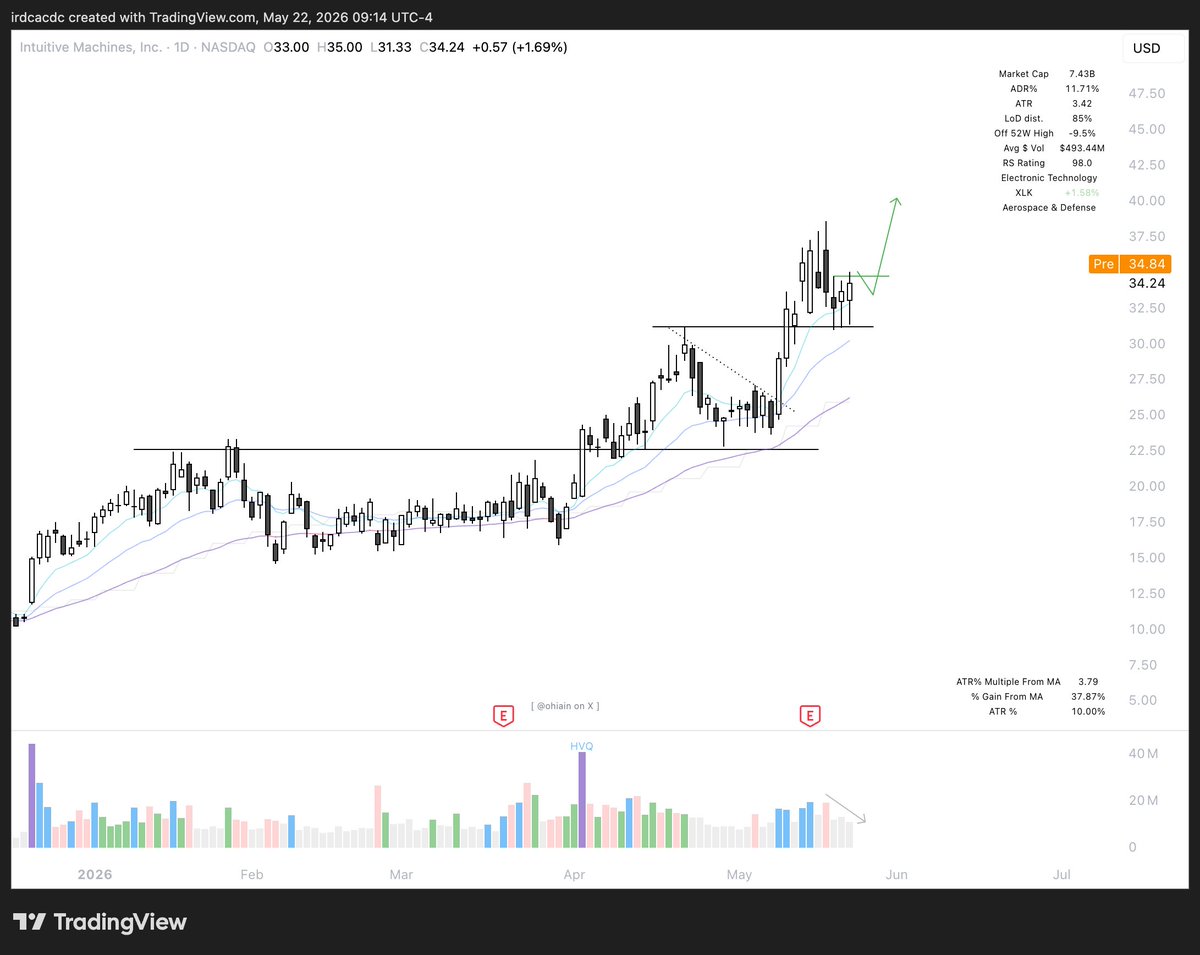
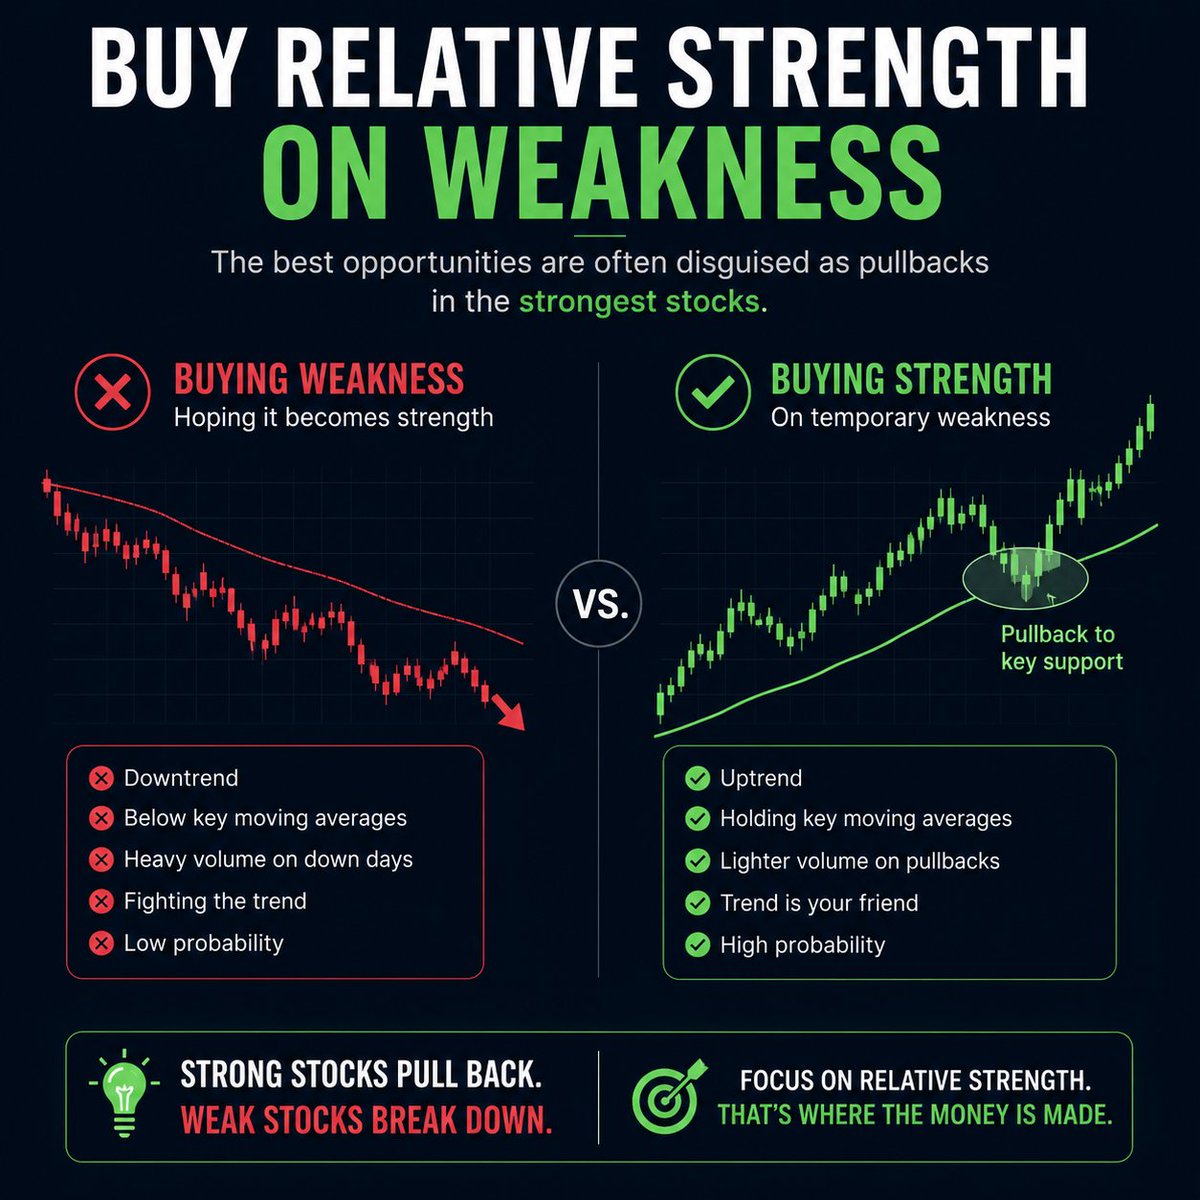
Rotation is bloodline of a bull market When 1 group starts leading the market higher... eventually it stalls to build a bigger base & Then the money goes searching for the "next" big winner. We are seeing this happen all over the market, especially in the last few days as semis have cooled off after an explosive run. Some days the markets rip and some of your positions do nothing.. that's because capital is flowing into specific sectors This is why having a great entry is so important... Many traders will puke up a position on an inside day or a scheduled pullback because they chased to get an entry in a stock they thought was going straight up. Instead you can buy relative strength stocks into a weakness day.. when those stocks pullback into key levels and big bases. That's how you stay a head of the rotation... by getting a great entry, you can sit in a position for a few hours/days before the market rotates into that theme/sector Just a reminder, not every single sector will get rotated into.. You still want to trade the big themes and stocks with tailwinds Combination of a few leading names in leading sectors.
Sean trades tweet media
English
17
21
251
15.4K
ScoGaun retweetledi
Zeus Trades⚡
Zeus Trades⚡@Zeustrades·
🚨$250,000 Giveaway🚨 10x $25k options prop firm accounts To enter: -Follow @Zeustrades & @OptionsFunding_ -Like & Repost -Tag a friend that would benefit from this Winners announced on 5/23/2026
Zeus Trades⚡ tweet media
English
257
268
318
11.3K
ScoGaun
ScoGaun@ScoGaun316·
@TheUltimator5 There was a huge spike in iwm dir delta for iwm I remember that for sure
English
0
0
2
277
TheUltimator5
TheUltimator5@TheUltimator5·
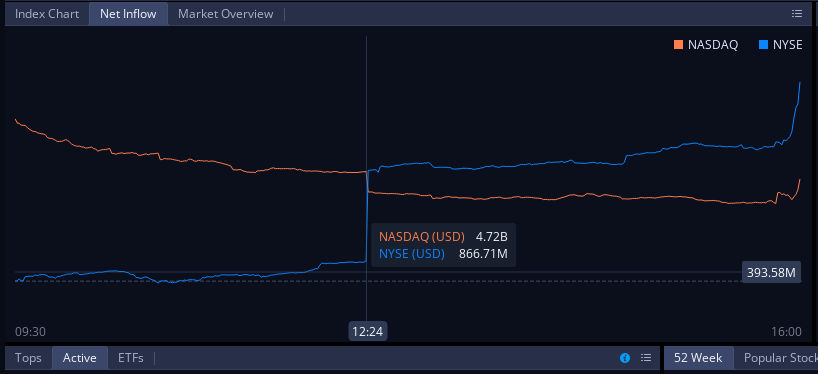
I just opened up Webull and saw the net inflow from Friday (15 May). At 12:25pm eastern, the inflow for NYSE jumped up 4 billion instantly ad NASDAQ dropped 1 billion. Looks like 4 million share buy block on $SPY and 2 million share sell block on $IWM simultaneously. I wonder why. OPEX? Something else? Serious question.
TheUltimator5 tweet mediaTheUltimator5 tweet mediaTheUltimator5 tweet media
English
3
1
81
6.4K
ScoGaun
ScoGaun@ScoGaun316·
@TheUltimator5 They are essentially a 50/50 though of being bought at the ask and sold at the bid to open
English
0
0
0
535
TheUltimator5
TheUltimator5@TheUltimator5·
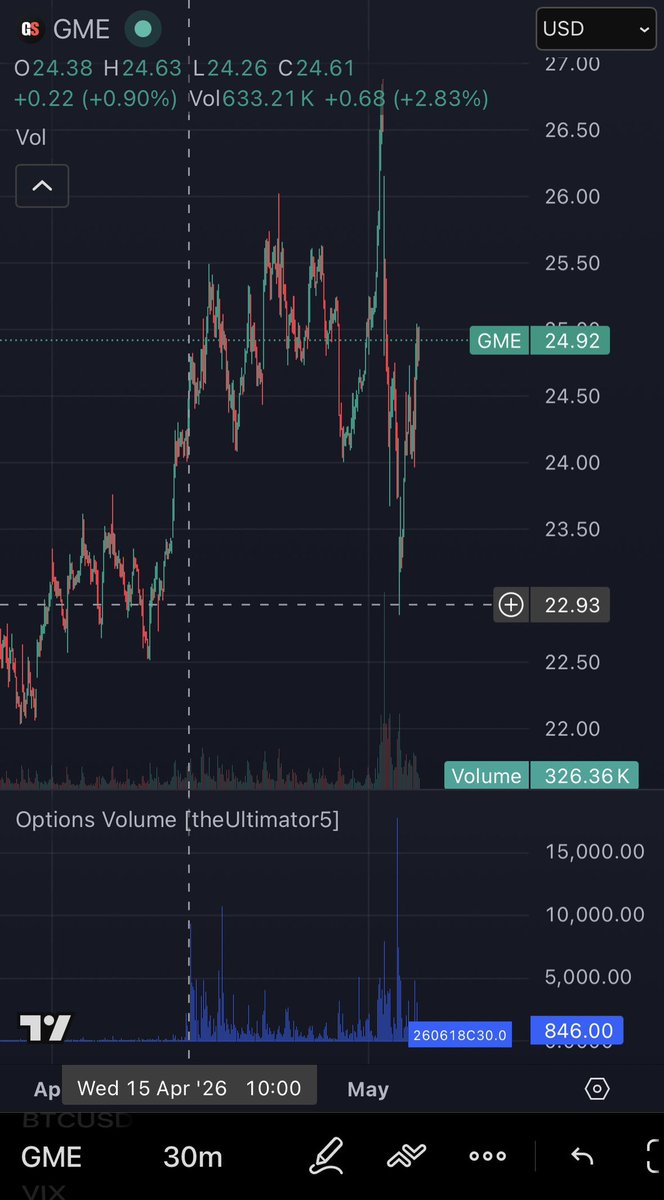
These 18 June 2026 $30 $GME calls are quite the wall set up. The numbers are increasing dramatically every day too. Up to about 100k OI, which is extremely rare to see with the exception of deep outside leaps. Since these are relatively close to the money as well as short duration, stock price and time play a major role in the hedging. The calls started ramping up quickly on 15 April, and haven’t slowed down. Either someone is setting up a wall around that date for some reason, or someone had inside knowledge of pending news and decided to front run it. I am leaning towards a wall getting placed to create ramping sell pressure into that date due to charm. I heard there are a ton of swaps expiring end of May, so it may be a preemptive move on that as well. Any other theories floating around?
TheUltimator5 tweet mediaTheUltimator5 tweet media
English
16
6
202
12.6K
ScoGaun retweetledi
Luc
Luc@investingluc·
Suddenly, you're 5 years in with nothing to show for it. Then you turn the corner...and make back those 5 years of losses in 6 months. This is the reality for most traders, me included. Years of mediocrity, breaking even, highs & lows, inconsistency...nothing working. Years where nothing happens, then weeks where years happen. That's the power of compounding skills, experiences, and capital. You’re delusional if you think you won’t have to pay market tuition...medical school is $500K, business mba is $200K, law school is $300K. But you're just gonna waltz into the most competitive game in existence and beat the market in year one? or two? Gotta pay the piper.
English
78
187
2.2K
90.1K
Orlando
Orlando@thisisorlando·
For those looking to trade squeezes 🍋 Short interest data gets way too much attention. It’s lagging, self-reported, and doesn’t tell you how shorts are actually positioned or hedged. High SI alone doesn’t create a squeeze. You can have crowded shorts that unwind slowly with barely any price reaction. The real fuel today is in the options market. Call buying, dealer hedging, and gamma effects are what actually drive those violent upside moves. Put selling matters too. It can signal strong demand below and help create a floor, especially when size shows up. If you’re only watching short interest and ignoring options flows and dark pools activity, you’re missing the bigger picture.
English
4
0
35
1.8K
ScoGaun
ScoGaun@ScoGaun316·
@alphaticaio That's for midterm years? Data for June looks bearish, but July tends to be very bullish for sure
English
1
0
1
43
Alphatica
Alphatica@alphaticaio·
Good question. From our monthly breakdown: September averages -0.60% and October averages +1.06% in $SPY. So the Sept-Oct window is net positive, driven almost entirely by October. The May-Aug stretch does the bulk of the summer's work, May +0.72%, July +1.97%, August +0.30%. On the "here to end of September is historically weak" framing; September is the only consistently negative month in the dataset, so we agree there. But the claim has to be specific. "September is weak" is supported by the data. "May through September is weak" is not, you're diluting one bad month across four positive ones. We'd love to test midterm Sept-Oct specifically but with 5 midterm years in sample, splitting further gives you 5 data points. That's not a finding, it's an anecdote.
English
1
0
1
138
Alphatica
Alphatica@alphaticaio·
A lot of you asked: "What about midterm years? What about which party is in office?" We tested every political regime since 2003. May-Oct under Republican presidents: +3.39%, positive 90% of the time. May-Oct under Democrat presidents: +3.76%, positive 67% of the time. Difference: p = 0.94. Statistically identical. It doesn't matter who's in office. Midterm year summers: +1.30%, positive 60% of the time. Weaker than non-midterm years (+4.27%) but still positive and with only 5 observations, the difference isn't significant. Republican midterm summers specifically (the current setup): 2006 +5.67%, 2018 +2.13%. Both positive. Post-inauguration summers (Year 1) are the strongest: +11.96%, 100% win rate. Every new president gets a summer rally. First term vs second term, election year vs non-election year, every cut is positive. The adage fails under every political condition we tested. Bootstrap confirms: no subset produces a confidence interval that excludes zero except first-term summers. The finding doesn't change regardless of who is in the White House. $SPY $QQQ $SPX
Alphatica@alphaticaio

🚨🚨🚨Next week FinTwit will be flooded with "Sell in May and go away" takes. Every year, same adage, same fear. We ran 9 statistical tests on it before the noise starts. 22 years. $SPY and $QQQ. Every May-October period since 2003. May-October was positive 77% of the time in $SPY and 81% in $QQQ. The adage implies summer is negative. It's positive 4 out of 5 years. Binomial test confirms: significantly different from a coin flip (p = 0.017). "The seasonal difference isn't real. In $SPY, the gap between May-Oct and Nov-Apr returns has a p-value of 0.49 which is statistically indistinguishable from a coin flip. In $QQQ, May-Oct actually returns MORE than Nov-Apr. Bootstrap confidence interval includes zero for both indices. There is no seasonal edge." The cost of following the adage: $10,000 invested in Buy & Hold grew to $69,649 in $SPY and $195,026 in $QQQ. The "Sell in May" strategy: $34,333 and $44,603. You lose $35,316 in $SPY, 50.7% of your terminal wealth. In $QQQ, you lose $150,423, 77.1%. The adage costs you more than it saves you. The real problem month is September (-0.60%), not May (+0.72%). July is the strongest summer month (+1.97%, p < 0.01). The adage is named after the wrong month. Summer is actually safer. Probability of a >10% drawdown in 60 days: 16% in summer vs 24% in winter for $SPY. The "dangerous" season has lower drawdown risk at every horizon we tested. The edge has decayed and reversed. From 2021-2026, May-Oct outperformed Nov-Apr by +4.4% in $SPY and +7.8% in $QQQ. The adage doesn't just fail, it's backwards now. We tested the event window. In the 10 days before May 1st, $SPY averages +0.74% with a 73% win rate. The market rallies into May. Nobody is actually selling. Sell in May and go away. To where? The market was positive 77% of the summers you missed. The adage cost you half your portfolio. The seasonal difference has a p-value of 0.49 which is statistically indistinguishable from noise. $SPY $QQQ $SPX
English
1
2
31
3.7K
ScoGaun
ScoGaun@ScoGaun316·
@SRxTrades You don't put any importance on the declining volume?
English
1
0
2
358
Nicholas A. Pantano
Nicholas A. Pantano@npantano_·
I just can't take this shit anymore. Every tweet, every message, every headline is another lie to justify the repeating fractal. Macro POI tomorrow on SPY. That's why he's saying this. He works for BlackRock. $spy Market is theatre, everything is a lie. 🤡
The Kobeissi Letter@KobeissiLetter

BREAKING: Iran responds after President Trump says their “entire civilization will die tonight:” “All diplomatic channels and indirect talks have been frozen after President Trump's recent threats,” Iran says.
English
15
2
45
22K
ScoGaun
ScoGaun@ScoGaun316·
@ohiain How do you personally identify sector rotations?
English
0
0
0
159
iain
iain@ohiain·
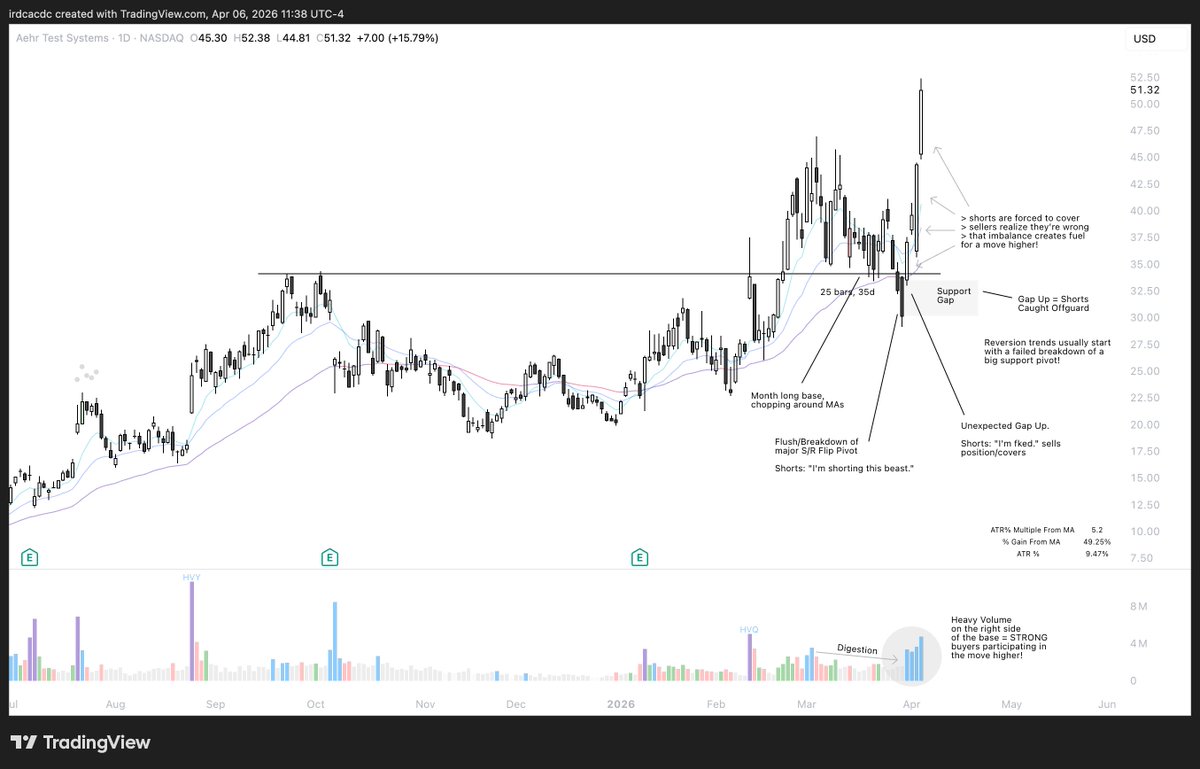
The biggest moves in the Market don’t come from clean breakouts… they come from failed breakdowns. From a psychological standpoint, when a stock breaks down below a big level, shorts pile in, weak hands panic sell, and liquidity floods the market. But when that move fails (and price quickly reclaims that level) it traps everyone leaning the wrong way. Now shorts... > are forced to cover > sellers realize they’re wrong > that imbalance creates fuel for a move higher It’s like a trapdoor that doesn’t open. Everyone jumps expecting downside… and when it snaps shut, they all have to rush back the other way. From my perspective, this is one of the highest quality signals I look for in my selection process. Not just “did it reclaim?” but how did it reclaim? - Was there strong volume on the move back up? - Did it reclaim a BIG level (swing low, weekly H/L, EMA)? - Is it happening within a strong name or leading group? Because when a failed breakdown happens in a relative strength name, that’s where things get interesting. What I’m really looking for is: aggressive rejection of lower prices. That tells me demand is stepping in hard, and that supply just got absorbed. And when that happens, the move that follows is often fast… because it’s not just buyers pushing price up, but it's also trapped sellers fueling the move. This is something I’ve started to prioritize more in my entries, hence the U&R entry setup that I've talked about for the last few months. Instead of chasing strength, I’d much rather position around a shakeout and reclaim. > risk is tight > invalidation is clear > upside is asymmetric But only if I’m right. :) Example: $AEHR
iain tweet media
iain@ohiain

Know that the biggest moves always come from failed breakdowns. It sounds simple… but when you truly understand why, it changes the way you see the markets. Yesterday was a perfect example of this. $QQQ was setting up for what looked like a clean breakdown below 600, sentiment was bearish, charts were cracking, and everyone was bracing for continuation lower. But then something flipped… Instead of momentum following through, price reclaimed the level it just broke. That’s your signal, not confirmation of weakness, but exhaustion of sellers. Let’s break down the psychology: Everyone gets trapped. When a key level breaks, traders short the breakdown and longs panic sell. It’s human nature, we fear missing the move. But when price fails to follow through and reclaims that level, those same traders are now trapped in the wrong direction. Think like this, trapped shorts = fuel. Once the breakdown fails, shorts have to cover to protect themselves. That short covering creates demand, which accelerates the reversal. Combine that with dip buyers stepping in at discounted levels, and you get explosive momentum back to the upside. The failed breakdown shakes confidence, resets positioning, and flips the psychology of the crowd. Markets move fastest when the majority is caught offside. So how do you spot a failed breakdown in real time? - Watch for immediate reclaims. If a key support level breaks, but price quickly snaps back above it on volume, that’s your first clue. The speed of the reclaim tells you there’s real demand. - Volume shifts. Heavy volume into the breakdown, followed by even heavier buying volume into the reclaim, confirms the trap. - Higher low confirmations. The next higher low after the reclaim often signals the start of a new leg up bc the crowd that sold the breakdown is now chasing back in. - Sentiment flips. When social feeds, traders, or even you start thinking “this thing looks dead,” yet the chart starts reclaiming key levels... that’s usually the start of something big. Yesterday’s move showed us this. Everyone was leaning bearish, expecting continuation… but the failed breakdown flushed out weak hands and created a reversal today. Something to take away is that failed breakdowns are not random. They’re kinda like psychological resets. They remove weak hands, trap the shorts, and hand control back to strong hands. If you can train yourself to recognize them, not panic into them, you’ll catch some of the most powerful moves in the market. The next time a chart looks like it’s “breaking down,” keep this in mind. Watch what happens after... Btw, if anyone was wondering, I still like $PLTR lol.

English
10
26
247
36.5K
ScoGaun
ScoGaun@ScoGaun316·
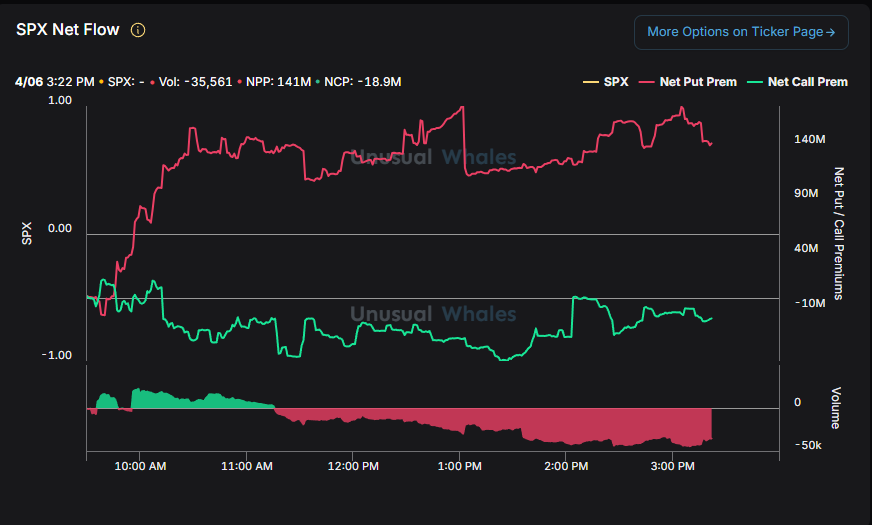
@MichaelPBento What's been interesting lately, and today particularly, is SPX QQQ IWM net flow all bearish while SPY is bullish, which is driven more by retail than SPX. Recently, SPY has been the lagger and big money has been hedging largely for 4/17
English
0
0
1
87
Michael Bento
Michael Bento@MichaelPBento·
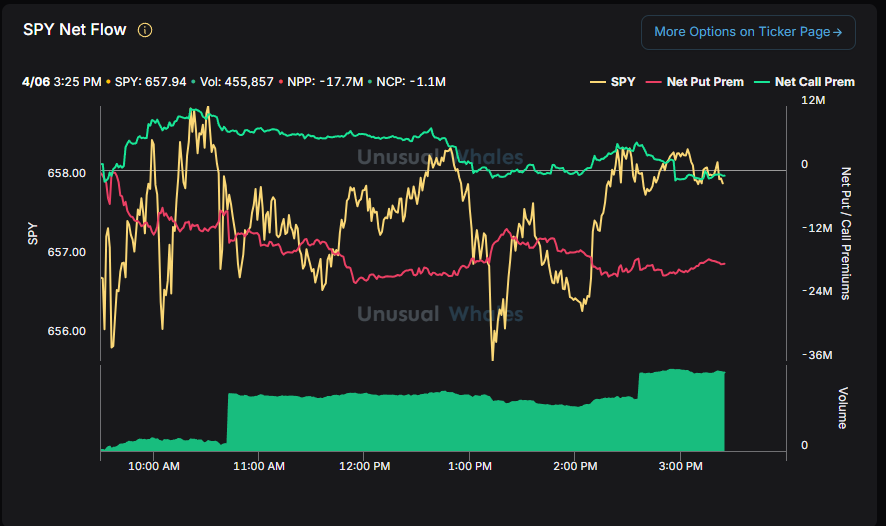
Net flows are still indicating a bull trap in progress. We are stuck on the call wall at 658 which has rolled down from 660 this morning (not a bullish sign). Meanwhile on SPY is looks like a failed test of the 20DMA which is now well below the 200DMA. Then looking to the news from this afternoon Trump was giving his usual jawboning to try and pump the markets but clearly he is whether intentionally or not indicating that the "talks" have only one condition he will accept which is Iran's complete unconditional surrender which will not happen. I continue seeing aggressive short dated put orders coming over that target 630. I think that Wednesday looks like it is shaping up to be the big dump. I would not be surprised if tomorrow is flat but let's see how the MOC imbalance looks like before making that judgement.
Michael Bento tweet mediaMichael Bento tweet mediaMichael Bento tweet mediaMichael Bento tweet media
English
18
6
212
10.9K
Seer
Seer@seer_xyz·
@JohnLoc18 If you are in this comment section to talk shit or ask to see his losses you are a fucking weirdo.
English
16
0
38
3.9K
JLoc
JLoc@JohnLoc18·
I stupidly missed the rage rally in April 2025 and I won’t miss this one $SPY.
English
68
24
804
61.6K
MarketMindsetPro
MarketMindsetPro@Realfinancial2·
ONE THING ABOUT TRADING VIEW
English
252
250
2.1K
150.8K
ScoGaun
ScoGaun@ScoGaun316·
@JohnLoc18 This should already baked into options premiums and forward pricing. Market makers adjust pricing before ex-dividend.
English
8
0
2
566
JLoc
JLoc@JohnLoc18·
$SPY dividend has been paid, cheap premium tomorrow 👍
JLoc tweet media
English
33
4
263
34.5K
ScoGaun
ScoGaun@ScoGaun316·
@FreeWyckoffs I think it's right between both yours and @npantano_ predictions, and gme heads to 28-30 range before distributing back to 18-20. Island gap at 28.40 and gap till to ~30 🤝
English
0
0
1
520
Free Wyckoffs
Free Wyckoffs@FreeWyckoffs·
It is not. You will likely go to $25’s-$26 on an upthrust action and then distribute to $17-$18. But I’ll just let the volume-less “Wyckoff God” show you the way. Even though the methodology relies entirely on volume analysis. He also said $0.50 incoming on $AMC and it won’t go over $6 ever again. Bash me, go ahead. $GME My discord knows what’s going on. Real VPA.
Free Wyckoffs tweet media
English
23
5
59
12.1K
John
John@market_sleuth·
Every weekend it’s like Groundhog Day on X with wrangling about the futures prices on Sunday night. They were down 70 handles on $SPX & now 39. Use a dartboard. 🤣. 60 minutes after the cash open is generally the true trend for the day. 💯 Chill. 😶‍🌫️
English
25
10
380
27.2K
Sean trades
Sean trades@SRxTrades·
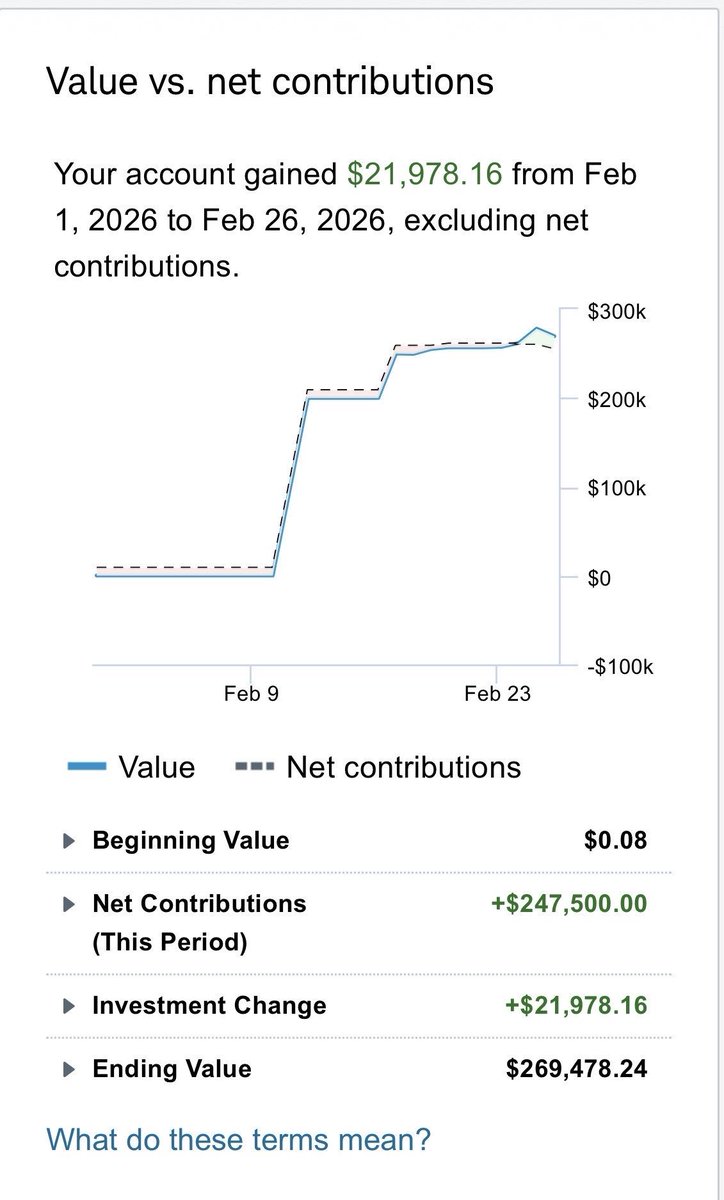
February was a slower month for me to start the year My focus was managing my risk and doing less when the environment wasn't right.. A lot of traveling and tanning while waiting out the chop days.. “It never was my thinking that made the big money for me. It always was my sitting.” -Jesse Livermore I ended up switching brokers this month to TOS and so far I'm incredibly happy with my decision As I focus on growing and scaling my accounts... I want to make sure I'm on the best platform possible Lets see what March brings!
Sean trades tweet mediaSean trades tweet mediaSean trades tweet mediaSean trades tweet media
English
7
2
114
15.9K