@TrendSpider crazy its parabolic now cant touch, RSI at 96 yikes. Long way to fall down
English
Kristian Gehradte
2.8K posts

@WWWKGPHOTO
Photographer who likes looking at charts


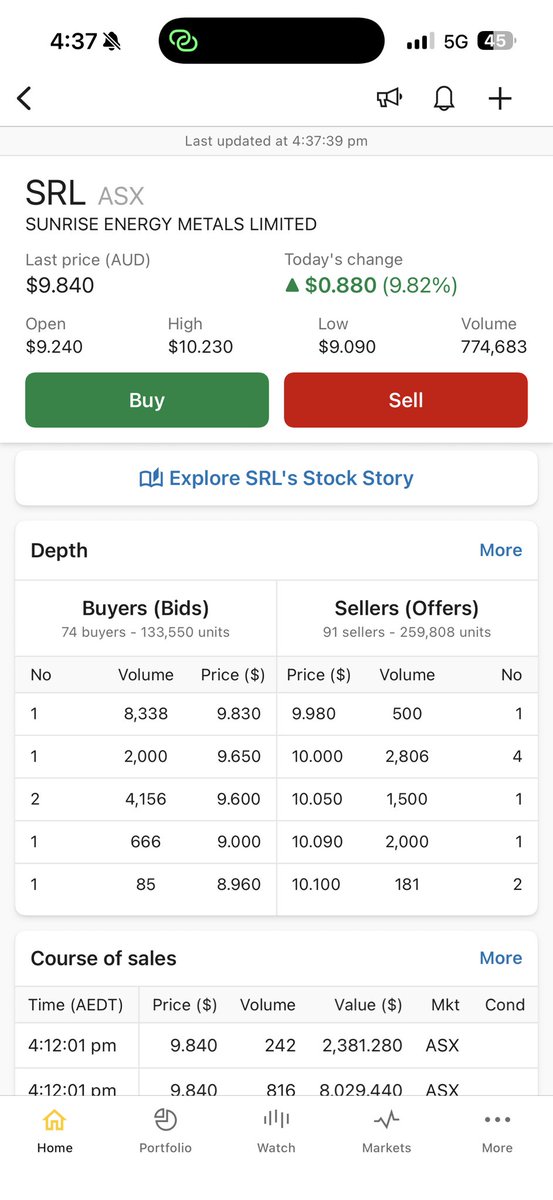
$SRL - #ASX


The Better Portfolio Update 🚀 For six months, I've told you $PATH is the best opportunity I can find. I still believe that thesis — nothing about UiPath has changed, and I still expect it to 10x within five years. What changed is I found something better. $BETR — Better.com — is going to compound topline revenue at 50%+ per year for the next several years, and it's priced like a company growing at a fraction of that. If rate cuts accelerate, we could see 100%+ annualized growth. I expect $BETR to 20x within five years. I highly recommend reading my recent post about the company and watching our latest video. So why not own both heavily? I would if I could. Here's the problem: despite running a leveraged strategy for seven years — $20k to $1.6M in $TSLA at 300% leverage, riding $5M to $10M and back in $PATH without a phone call — Interactive Brokers effectively allows 0% margin on $BETR. It's a $700M company with limited daily volume, and IBKR's risk engine won't extend leverage on it. My solution: I moved ~89% of my net liquidity into $BETR and spread my margin across a broad basket of 30+ other names. IBKR's portfolio margin system requires that no single position outside of BETR exceeds ~10% of net liquidity when Better dominates ~90% the portfolio like this. If I could leverage $BETR freely, I'd still be 100% net liquidity in $PATH and 150% in $BETR, with the rest split among my top favorites. But I can't, so the broad basket is how I keep my margin working instead of sitting idle. That breadth comes with a tradeoff I want to be upfront about. When you hold your top three or five ideas, it's possible every one of them works. When you hold 30+, some of them will be duds — that's just math. Even Peter Lynch said four out of ten won't go as planned. But I believe deploying margin this way will add far more to my returns than leaving it unused. My portfolio as of 4/7/26: Core position (89% of net liquidity) $BETR — $1.8M @ $33.85 avg Top conviction (each ~9% of net liquidity) — $1.3M total across all $PATH $HIMS $ZETA $DOUL $FOUR $KLAR $LMND Remaining broad basket — $2.7M total across all $IBKR $NKE $UPST $MELI $MU $SMCI $CAKE $AMZN $COIN $SKM $CELH $DLO $TSLA $HOOD $GLBE $GT $ELF $AMD $WHR $ROOT $FLY $CRM $NVDA $MNDY $FUBO $BMNR $MSTR $META $MIAX $WEN $TEAM $FVRR To be clear about what happened here: I didn't lose conviction in UiPath in the same way I didn't lose conviction in Lemonade when I started buying UiPath originally, or stop loving Tesla when I bought heavily into Lemonade. I found a situation where the math on the upside is roughly double over the same timeframe. If your current best idea is a 10x in five years and you find a 20x in five years, you move heavier into the better opportunity. That's not giving up on a thesis — that's doing exactly what the thesis framework is supposed to do. For context on the strategy overall: I'm up over 300% in the past 12 months and have averaged nearly 100% annualized time-weighted returns over seven years. I'm also down 73% YTD. Both of those things are true simultaneously, and that's what leveraged concentration looks like. A sub-20% market pullback could easily cut my portfolio in half. This is shared for entertainment and educational purposes only. I'm not a financial advisor. I do not recommend using margin. I'm learning, experimenting, and sharing in real time. Thanks for reading.

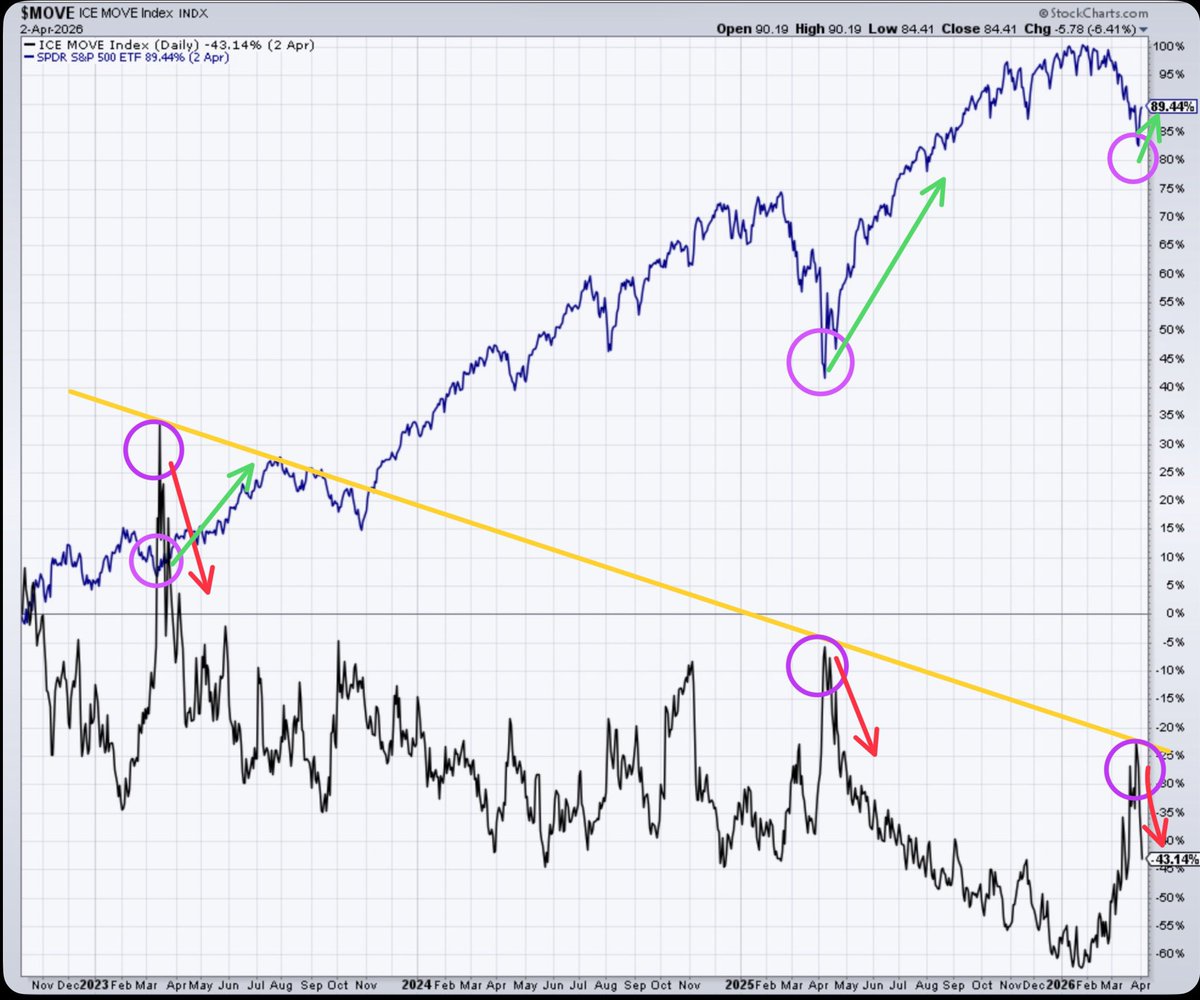
$SPY $MOVE THE MOST IMPORTANT CHART THIS WEEKEND 💛 Everyone searching for a sign of a bottom, and the correct answer is nobody really really knows, however… The ICE MOVE Index (Merrill Lynch Option Volatility Estimate) is the "VIX for Treasuries” Large spikes in treasury volatility (which are rare) have marked every single short term, intermediate term, and longer term bottoms, the chart clearly shows that. Especially when there is…A LARGER SPIKE 🧐 A 40% move in the $MOVE index is very large. I don’t think it’s a coincidence that an almost perfect trendline (highlighted in yellow) has marked the previous two largest peaks with where we are now 🤔 Many don’t know that in the world of deep economics and treasury markets, that there is “stealth” QE5 going on right now, it is called RMP’s (Reverse Management Purchases), it is basically the FED buying short term treasuries to give the banks reserves/liquidity 💦 So in that backdrop there should be less implied volatility in the treasury world, and another piece of context that has caused all the spikes evaaa evaaah in the $MOVE index is Major FED Decisions on monetary policy and Geo Political Shocks…hmmm…I wonder if we have one of those right now 🤨 It’s almost impossible to chart a news driven event that clearly moves and marches to the beat of one man’s thoughts, Iran’s replies, and the price of a Barrel of oil… but this charts is VERY VERY interesting! Hope you enjoyed the research, much love 💛🍌🍌🍌


New 1M and 3M candles coming next week. Prepare for many OL (Open, low) moves coming in April.


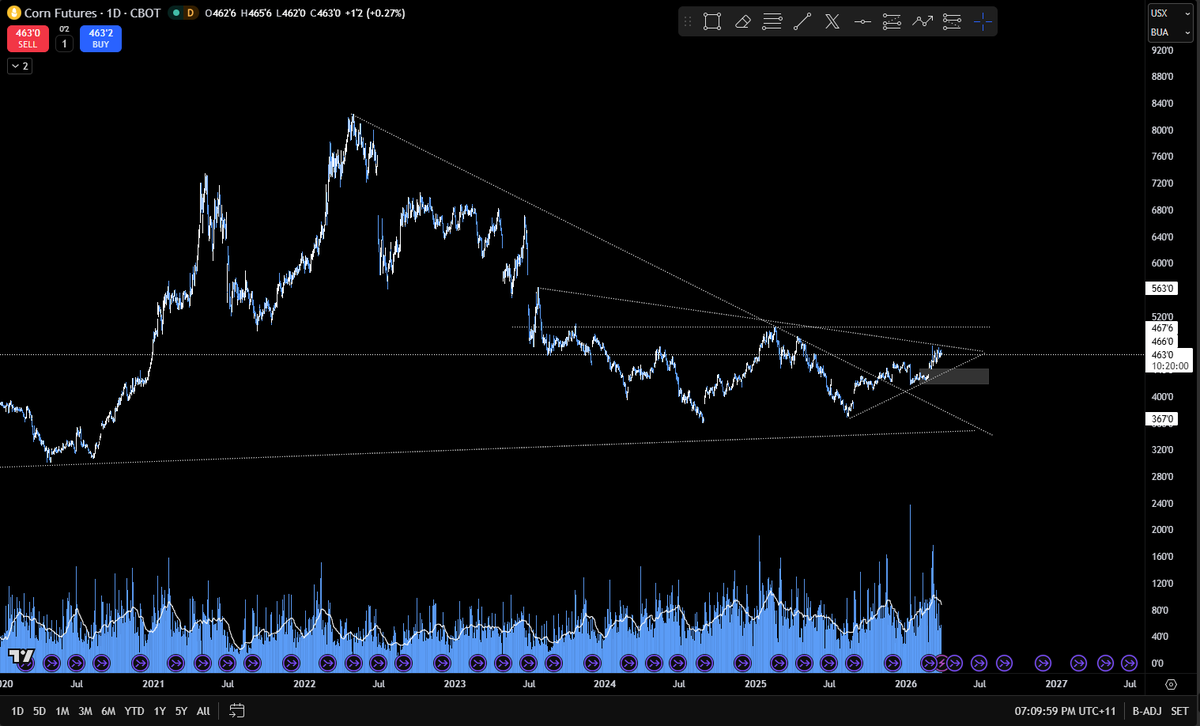
#Cotton #Wheat and #Corn both recently broke out from similar set ups, does Cotton follow here?

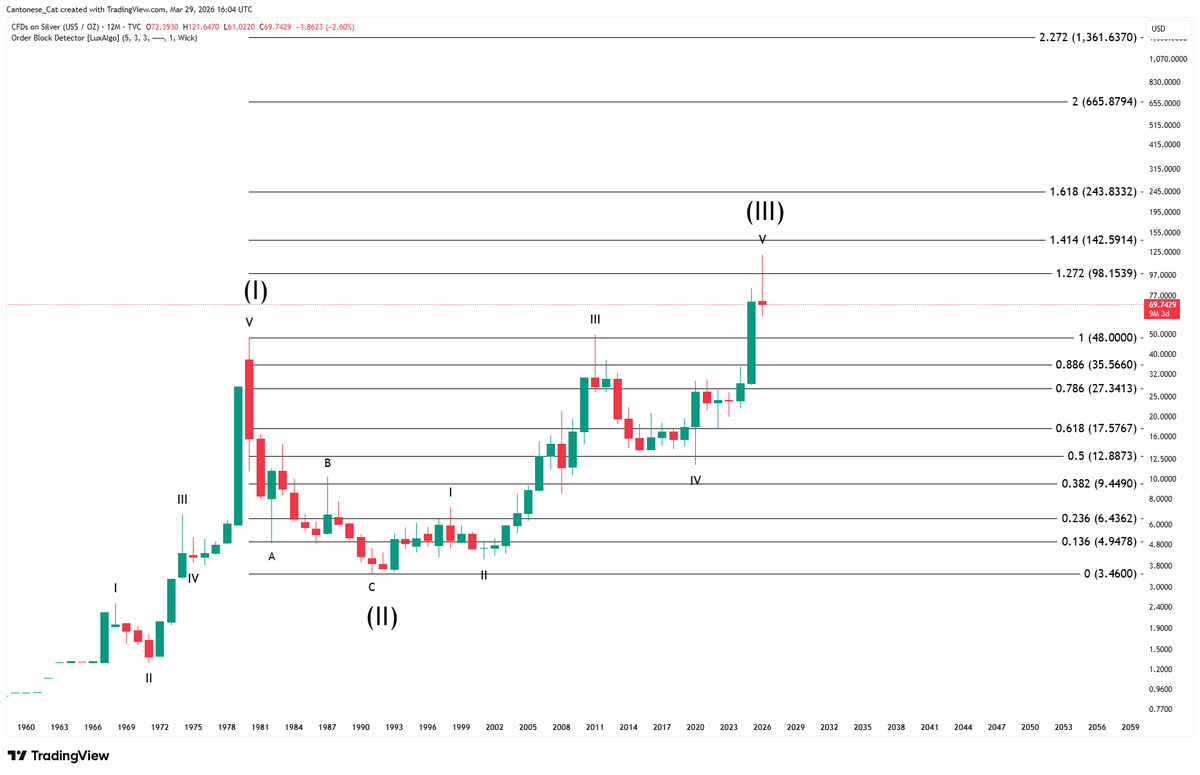
WDS - Woodside - Monthly Imagine telling people in 2008 that Woodside was about to enter a 20-year bear market. You’d have been laughed out of the room. Woodside isn’t a bad company, far from it. It’s simply that oil has been in a multi decade bear market, and when the underlying commodity is suppressed, even the best producers struggle to shine. But cycles always turn. If you understand macro cycles, you know where oil is heading over the next decade and you know that Woodside will be one of the biggest beneficiaries. Just as people laughed at the idea of a 20-year bear market, they’ll laugh again now when you say it’s about to enter a multi-year bull market that will take out prior highs. That’s the nature of cycles: disbelief at both extremes.


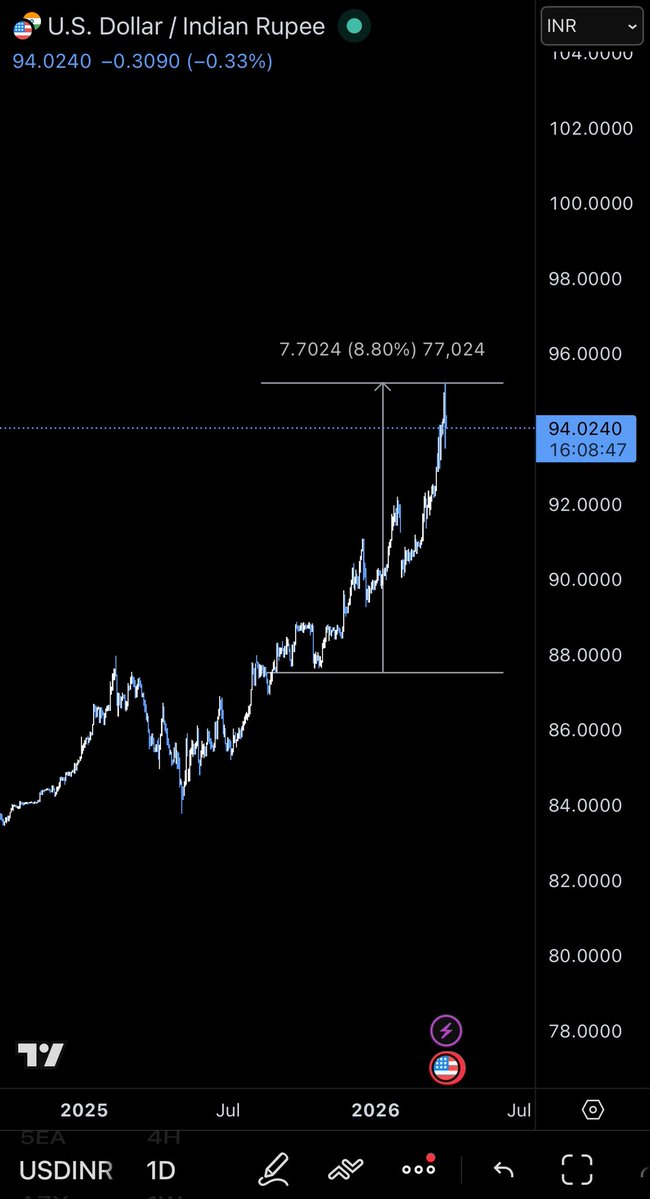
Indian Rupee - Looks like shit. #USDINR

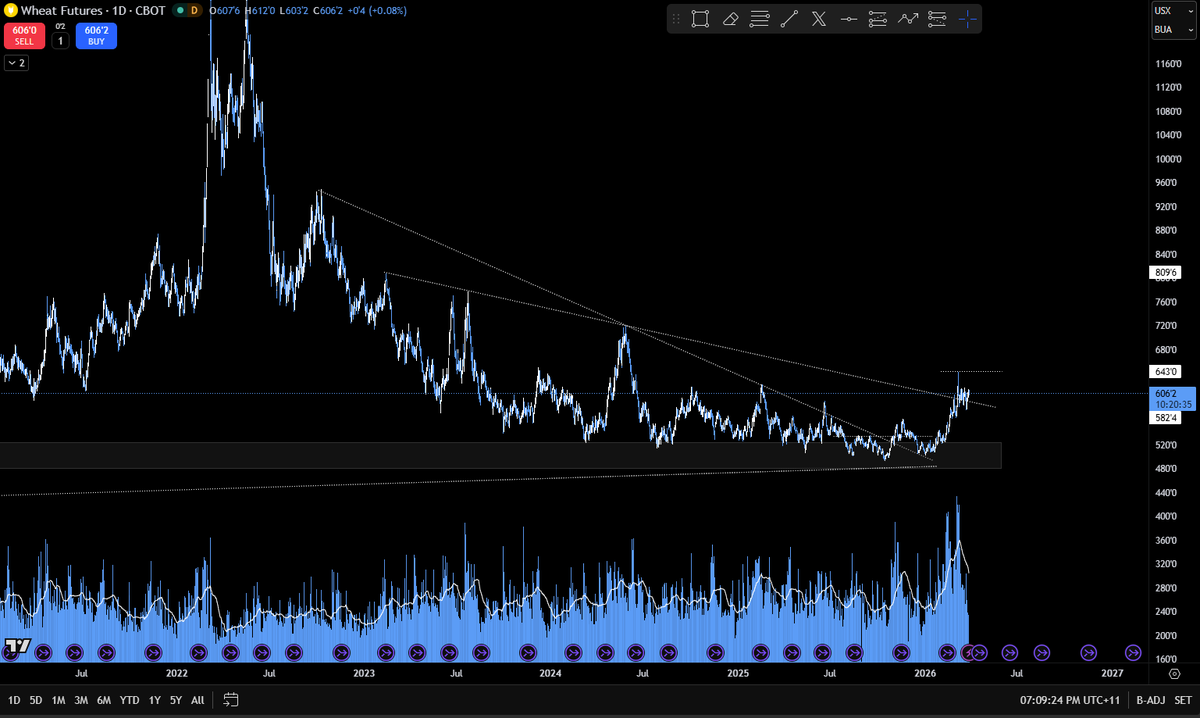
Wheat remains 1 standard deviation below its long-term trend. The market seems particularly complacent given the situation. This is good news for investors who have time to position their portfolios accordingly if they wish to. $WEAT