
Dean van den Heever
1.7K posts
Dean van den Heever
@dean_vdh
Cape Town, South Africa Katılım Ağustos 2011
1.8K Takip Edilen272 Takipçiler
Dean van den Heever retweetledi

An Anthropic engineer watched my screen from the next table at a cafe in SF.
"Are you running Claude against live prediction markets right now"
I told him yes.
Then I showed him the stack.
214 trades. 74% win rate. +$9,437 in 19 days.
Here's what actually happened:
I gave Claude two repos and a simple job.
A full market archive. Wallet behavior, entries, exits, and timing across the board.
Three commands. 500+ markets. No API key. Just a clean way to score the board fast.
The system does not try to predict the world.
It tries to find which wallets consistently exit better than the crowd, isolate the pattern, and only fire when the same structure shows up again.
Main filter:
captured value / expected value > 0.70
If a wallet wins often but leaks the move on exit, it gets ignored.
If it captures most of the move and cuts losers fast, it becomes signal.
Sizing uses Kelly:
f* = (p*b - q) / b
That is what stops the terminal from apeing into weak edges.
Most of the time it does nothing.
No edge - no position.
Three trades from the run:
> AMD Xilinx - entered 52c. Model said 59c. Closed +7c in 2h40m.
> Artemis launch - entered 63c. Model said 85c. Closed +22c in 5h10m.
> Derecho MW - entered 71c. Model said 87c. Closed +16c in 1h50m.
When he saw the repo links and the live terminal, he stopped talking for a second.
Then he said:
"We tested something close to this internally."
That was the whole joke.
The data is public.
The repos are public.
The market is public.
But most Polymarket traders still trade headlines, hold too long, and call it conviction.
Polymarket does not reward the smartest story.
It rewards the cleaner exit.
Giving This Free for 24 hours.
To get it:
1. Comment the word 'Market'
2. Like and Retweet this post
3. Follow me
@ZayvenKnox
English

I've spent more than half my life refining my trading system.
Now I'm giving it away at no upfront costs.
Want the system?
Comment "SYSTEM" and I'll DM you the details.
(Must follow)
English

You know what
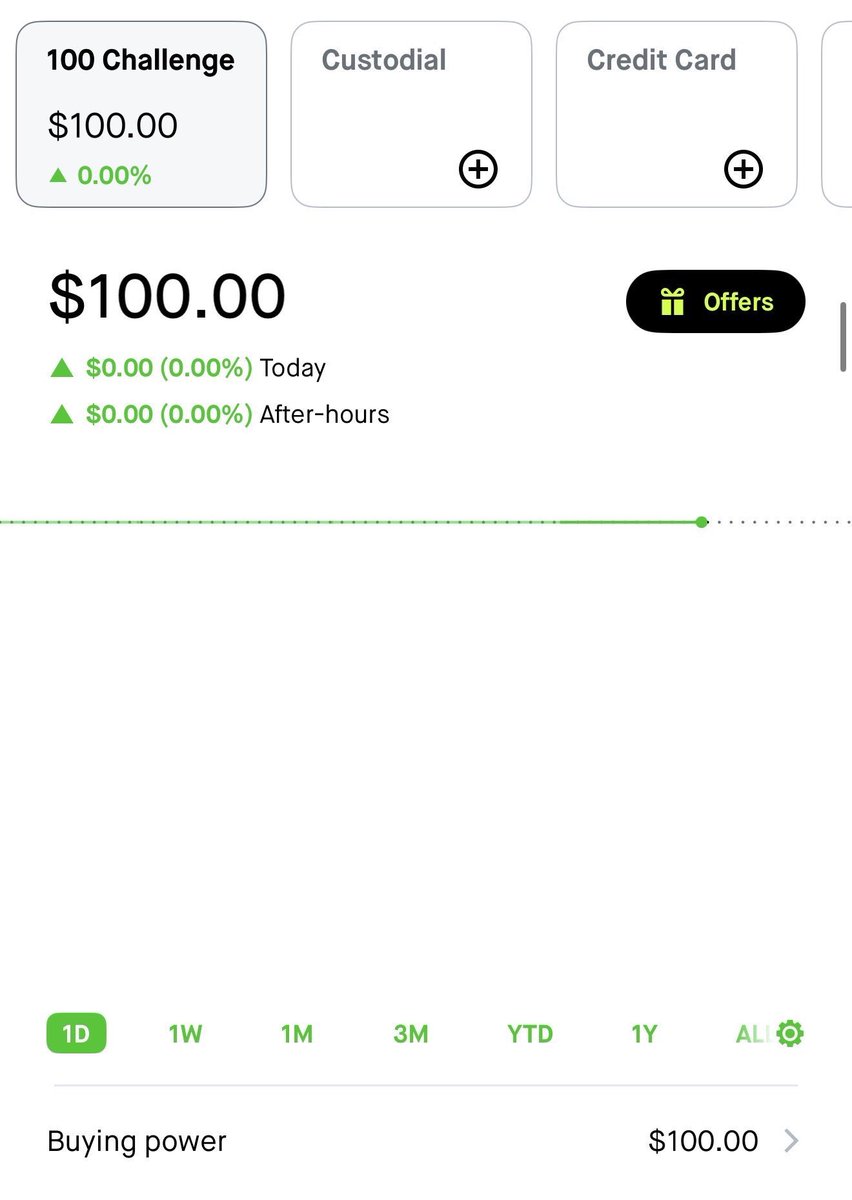
I’m restarting the $100 to $10,000 challenge.
I want everyone to have a fair shot at this.
Last time it took me about 5 days, will try to do it faster this time.
If you want to follow along, comment below to join
Going to lock comments in 24 hours
English

Options with the WHEEL Strategy on $AMD changed my life.. I've made many millionaries with my call out at 77
I sold over 100 puts in 12 months all expiring WORTHLESS and then in February I got ASSIGNED Shares at a discount in the 200s
Those shares are now at 455 +117% Return in 2 months!
Selling PUTS on GREAT Companies is a CHEAT CODE! You are getting PAID to place a BUY ORDER
No Fomo No Chart Watching No 0 DTE
Im starting a new small and large account challenge
I will be making videos on X and doing spaces all NO CHARGE
All i ask is drop a👍
English

I think this is an important point that many new traders need to understand.....We sometimes easily say :
''You need 10-15 good/outlier trades to have a great year''
.....But how hard is it to actually capture them?
Below are some of my realizations over the past 5 years and what I truly mean when I say :
''You must surround yourself with assets where asymmetry or outlier potential can emerge more easily and naturally.''
For years into trading I had the following mindset: ''Filter your universe of stocks with some simple rules that and then focus on the stocks that look strong and the BEST setups.''
That worked nicely and still works nicely in certain windows per year where opportunities are all over the place and everything you touch turns into gold.
But these are small windows within each year.
So what do you do the rest of the months when only selective assets work and most of the universe isn't moving? Are you still executing on great setups? Because this leads to extreme frequency of trades and possible deterioration of your capital.
The other issue I had with that mindset was that without knowing anything about companies ( since I was looking only at price as a guiding factor) , I lacked that conviction element to hit the button big when it was needed. So naturally I was missing out on some moves just because I had nothing else to back up my conviction other than price. Trust issues.
Another problem I also figured out as I studied more was that amazing opportunities didn't emerge always from perfect ''setups''. They just went straight up from setups I would classify as 3*/5 or 2.5*/5......So I thought:
''is focusing on the best setups limiting my opportunity potential? Maybe...''
The other issue I also had was that out of 5K stocks available there are at least ~300 of them that look quite good based on prior price action moves, at any given point in time, and on certain occasions provide ''nice setups''....
So what, am I going to trade all of them when they show some linearity and a 5* setup?
<>
You have to remember that even if you track 800 different stocks over the span of a year as a result of your selection filters , where the list sits around 300-400 at any given snapshot of time......due to frequency and portfolio allocation constraints you can't execute trades in all of them.
So what happens in reality is the following:
If you execute let's say 60 trades per month (your average frequency) and you track a list of 300 stocks, you can essentially attempt on 20% of that universe in any given month.....Essentially you are covering the potential of 20% of that territory..... And how many stocks out of that 20% territory captured by your execution attempts actually have the chance to be outliers?
If you're executing only on great setups within that list of 300 tickers, then it's kind of random whether an outlier will emerge in that 20% coverage you have.
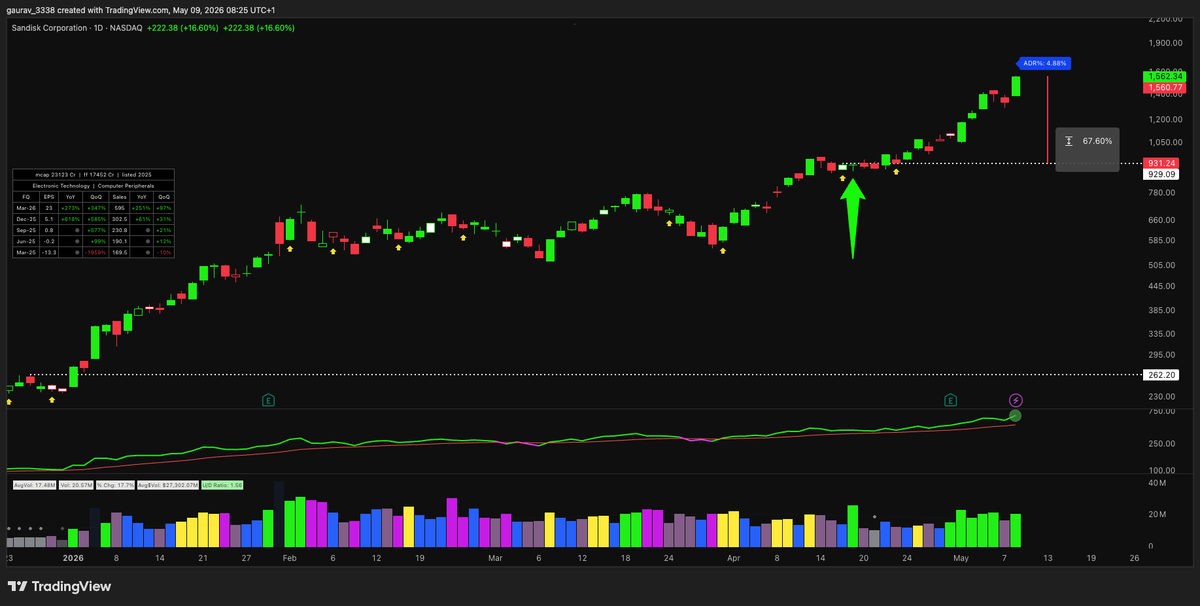
A lot of people might say ''man.... I had $SNDK, $AXTI, $LWLG, $MU etc. on my universe list , why didn't I trade them?''
For many people the reality is that the universe was too big relative to their frequency to potentially trade them, because other opportunities emerged first and didn't materialize.
<>
But here is where overfitting starts to spiral....
Because you can attempt to shrink down your universe (e.x from 400 to 50) by butchering your outlier potential, or you can shrink it WHILE carrying the essence of that outlier chance with you.....This is the whole game essentially.... I'll explain:
What butchering your outlier potential means:
For example, some people in their attempts to shrink down the universe put filters to only trade or surface stocks with let's say amazing fundamentals....That's not wrong, because ''usually'' for long term moves great fundamentals need to emerge....BUT IS it universal on all great moves???? The markets show that huge opportunities emerge even without any fundamentals (e.g. $OKLO, $LWLG, $AXTI recently etc.)
So if you put ''great fundamentals'' as a filter to go from 400 stocks down to 50, then you might be shrinking down the outlier potential as well.....
The filters used by traders are many, and each filter you add if you haven't deeply explored it's ripple effects has the potential to heavily exclude phenomena that the market has proven to reward......which essentially means...shrinking your outlier potential in the process. A hole in the water....
There's a reason only a few great traders exist and a lot of average ones.....Because the great traders , through studying, through experience, through observation of past historical opportunities are able shrink down their universe to align it with their frequency, WHILE simultaneously carrying over a large portion of the outlier potential the original ~400 stock list had.
And that's the HARD part. Because you TRULY succeed when you go from 400 stocks down to e.x 50 without losing many of the potential outliers in the process.
Think about it this way.... if 20 tickers out of those initial 400 were going to make a massive move, that's only 5% of the whole initial universe. Now if you shrink down to 50 and still have 10 of those sitting in your new list, your outlier chance just jumped to 20%. That's the whole game right there.......
......That's how you truly increase your outlier chance and position yourself in places where ASYMMETRY can emerge more easily.
And this is where I've focused my work in recent years. We know that great moves can happen because of themes alone, stories, catalysts, great fundamentals, or combinations of all of them. How can you mix all of those elegantly in order to shrink the universe without overfitting, while still carrying a higher outlier potential?
And this is where the phrase I use becomes evident: ''phenomena > setups.'' If, based on historical observations, you create good combinations of behavioral, fundamental, and technical factors, each with their respective weight, the bigger the chance you carry larger chunks of that outlier potential during the universe shrinking process....The more you carry the better your year will be.
<>
A lot of food for thought, but it's a good exercise for many to understand why trading is EASY and yet so damn HARD at the same time.....
Marios Stamatoudis@stamatoudism
10-15 good trades are more than enough for a spectacular year. And we had a few already $SNDK, $MU , $AXTI , $WDC , $STX, $LWLG , $INTC $NOK and way more. As I always say all our effort should be in placing ourselves in places where these outlier trades can emerge easier and naturally.
English

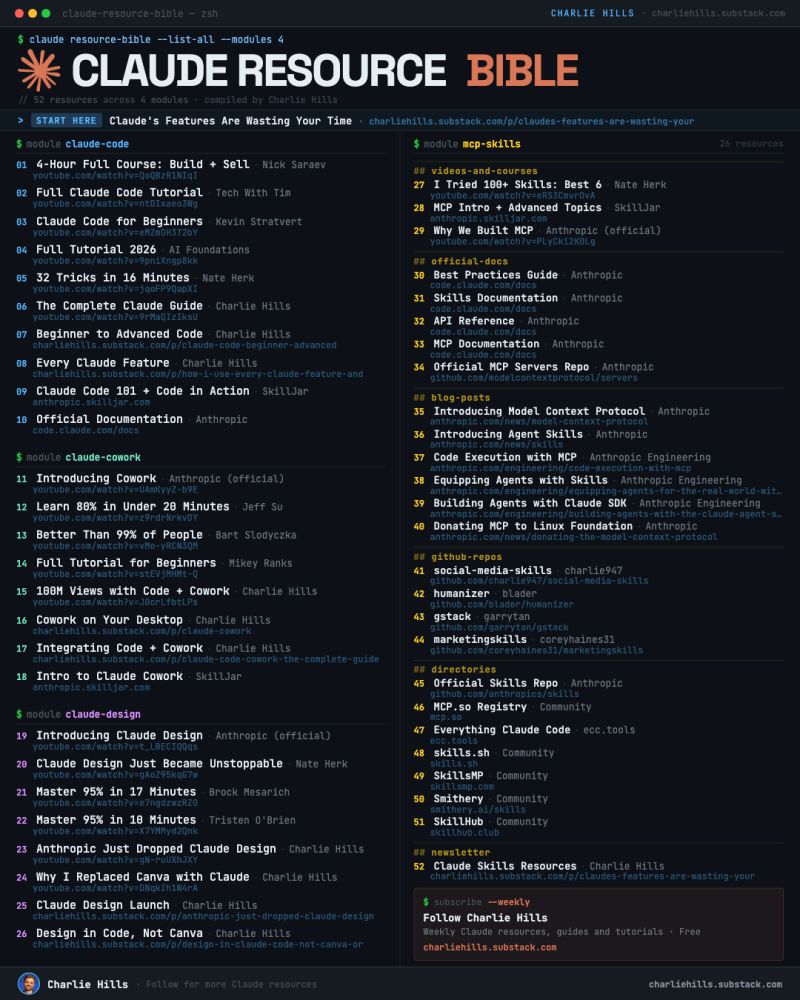
You don't need a $500 Claude course.
52 free resources, sorted into 4 modules:
CLAUDE CODE
1. lnkd.in/e7gUgJFe 4-hour build + sell course
2. lnkd.in/eVNQjV66 full Code tutorial
3. lnkd.in/eBBsW3SD Code for beginners
4. lnkd.in/eaHUHfnE full 2026 walkthrough
5. lnkd.in/e6nZb9JZ 32 tricks in 16 mins
6. lnkd.in/ehtPc5Tg complete Claude guide
7. lnkd.in/eX9prA4V beginner to advanced
8. lnkd.in/e-934Yhi Claude features ranked
9. anthropic.skilljar.com the official course
10. code.claude.com/docs official documentation
CLAUDE COWORK
11. lnkd.in/efCGYqNh Anthropic's official intro
12. lnkd.in/eMGATsbn Cowork in 20 mins
13. lnkd.in/eB-8-c7i better than 99% of users
14. lnkd.in/exZCjUbg full beginner walkthrough
15. lnkd.in/epwYqQKA 100M views with Cowork
16. lnkd.in/eeHWHJ49 Cowork on your desktop
17. lnkd.in/eMRDhZYJ Code + Cowork combined
18. anthropic.skilljar.com official course
CLAUDE DESIGN
19. lnkd.in/eKsTX-4T Anthropic's official intro
20. lnkd.in/e42_X9hY Design got unstoppable
21. lnkd.in/eFhPrBYp master 95% in 17 mins
22. lnkd.in/eg7b5hmM master 95% in 10 mins
23. lnkd.in/egy4Q4NQ launch reaction video
24. lnkd.in/eWtwB-nJ why I replaced Canva
25. lnkd.in/eZHgXYn7 Design launch breakdown
26. lnkd.in/eZ6wSdJA design in Code, not Canva
Save this for the next time you want to learn Claude.
Join AI Community : whatsapp.com/channel/0029Va…
Repost ♻️ to help someone in your network.
English

This lecture is the simplest systematic edge ever published - and the same framework runs on Polymarket today
Greenblatt's formula turned $10K into $1M while the S&P barely cleared $73K over 16 years
Bookmark this - the math is so simple it almost feels illegal
Here's the formula:
Combined Rank = Rank(ROC) + Rank(Earnings Yield)
ROC = how good the business is
Earnings Yield = how cheap the stock is
Rank ~500 companies on both. Sum the ranks. Take the top 30. Hold 12 months
The results:
30.8% annual returns. 16 years
$10K → $1M S&P same period: $10K → $73K
Worst year: -4%. Best year: +79.9%
When S&P lost 43% over 3 years → formula returned +73.5%
Why almost nobody runs it:
5 months a year it underperforms. sometimes whole years
Fund managers can't survive that - clients pull capital quarterly
The edge belongs to retail with long horizon and discipline
The Polymarket parallel:
Greenblatt: rank stocks on ROC + Earnings Yield → take top 30
Polymarket quants: rank buckets on ECMWF + GFS divergence → enter biggest gaps
Same brain. Different table
→ rank systematically. no opinions
→ never override the model
→ accept some periods underperform
→ let small consistent edges compound
The key insight:
Greenblatt didn't beat the market with intelligence
He beat it with a 2-metric formula and the discipline to follow it
Polymarket isn't different
The math is public. The discipline is rare
Watch the lecture below ↓
Chase@0xChaseTM
This Polymarket trader has 2,668 trades, 99% win rate, and skipped every loud market on the platform It sounds impossible until you see how simple the math behind it is ECMWF and GFS forecasts vs a casual order book - the gap is wide and compounds daily Here's the system: He doesn't predict weather He prices against it. ECMWF and GFS already know the answer - he just acts on it. The niche: Toronto. Taipei. Tokyo. Manila. Karachi. Singapore. Jeddah. Lagos. Paris. Munich. NYC. Chicago. Denver. Daily temperature binaries. Nothing else Three entry patterns: → Buy No at 85¢–99¢ on exact-degree questions "will Madrid hit exactly 16°C" - hitting one specific degree is rare. No wins almost every time Example: Taipei 29°C No at 85.3¢ → +$438 → Buy Yes at 95–98¢ on threshold questions when models are confident "will Karachi hit ≥41°C" - when forecast clears it cleanly Example: Karachi ≥41°C at 98¢ → $7,230 ticket → +$137 → Buy 3¢ lottery tail bets on rare-but-possible outcomes Example: Paris 22°C → $9 invested → $260 payout → +2,766% The math: Ticket sizes: $1K–$7K Profit per trade: 2–15% Hold time: 1–3 days Cities traded daily: 20+ Active position value right now: $108 Same capital recycled across dozens of cities every single day Why it works: ECMWF and GFS produce sharper probabilities than the Polymarket order book at 24–72h horizons. The book is full of casual users He's pricing against actual physics The risk profile: Each trade has convex downside - lose 100% if wrong Diversified across 20+ uncorrelated geographies A freak weather day in one city barely dents the book The lottery tail bets are the asymmetric upside layer The key insight: The loud markets are where attention lives The quiet ones are where the math wins He's not smarter than the market He's just running a public model against a casual order book The atmosphere is the only thing that can beat him And it almost never does
English

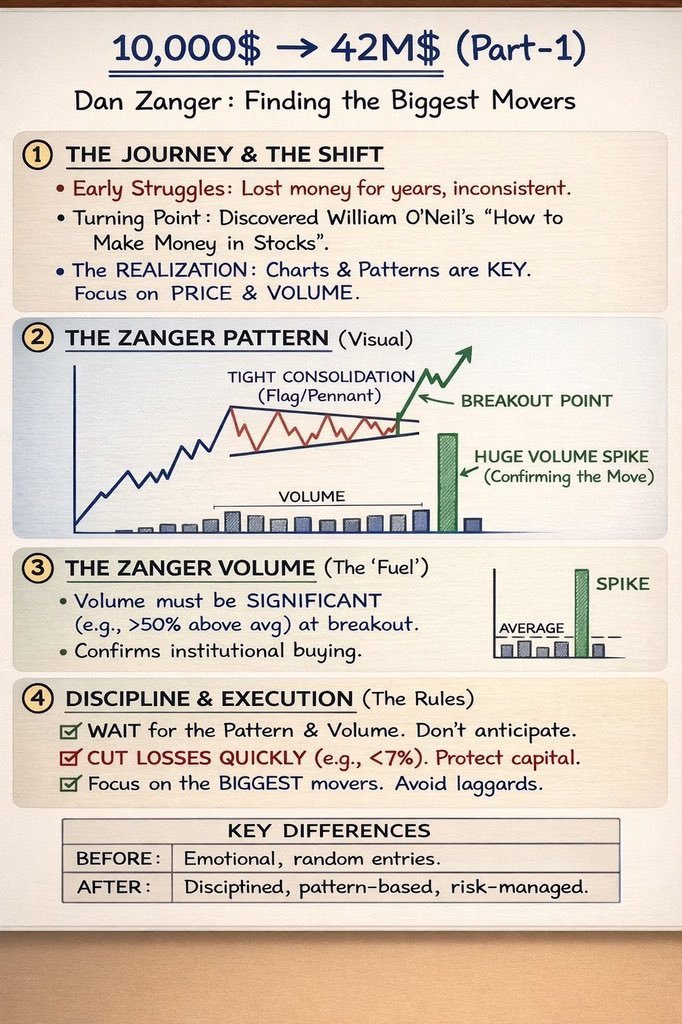
10,000 → $42,000,000
How Dan Zanger did it 🧵
Most people think it was luck.
It wasn’t.
It was a shift.
1️⃣ THE JOURNEY & THE SHIFT
• Lost money for years
• Inconsistent results
• Emotional trading
Then he discovered William O'Neil and his book
How to Make Money in Stocks
The realization:
👉 Charts & patterns matter
👉 Price + Volume are everything
Not opinions. Not news. Not predictions.
2️⃣ THE ZANGER PATTERN (The Setup)
He focused on:
📈 Strong uptrend
📦 Tight consolidation (Flag / Pennant)
🚀 Breakout above resistance
But here’s the key:
Breakout must happen with huge volume spike
That volume confirms:
✔️ Institutional buying
✔️ Real demand
✔️ Not a fake move
No volume = no trade.
3️⃣ VOLUME = FUEL
At breakout:
• Volume must be 50%+ above average
• Spike confirms momentum
• Institutions are entering
Retail traders chase candles.
Professionals watch volume.
4️⃣ DISCIPLINE & EXECUTION (The Real Edge)
His rules:
✔️ Wait for pattern + volume (don’t anticipate)
✔️ Cut losses quickly (around 7%)
✔️ Focus only on biggest movers
✔️ Avoid laggard stocks
Before:
Emotional. Random entries.
After:
Pattern-based. Risk-managed. Disciplined.
The Big Lesson 👇
He didn’t trade more.
He traded:
• Less
• Bigger setups
• With strict risk control
Edge = Pattern + Volume + Discipline.
English

The U.S. government, hyperscalers, and $NVDA are literally telling you that the future will be dominated by the following 10 groups of stocks.
Space:
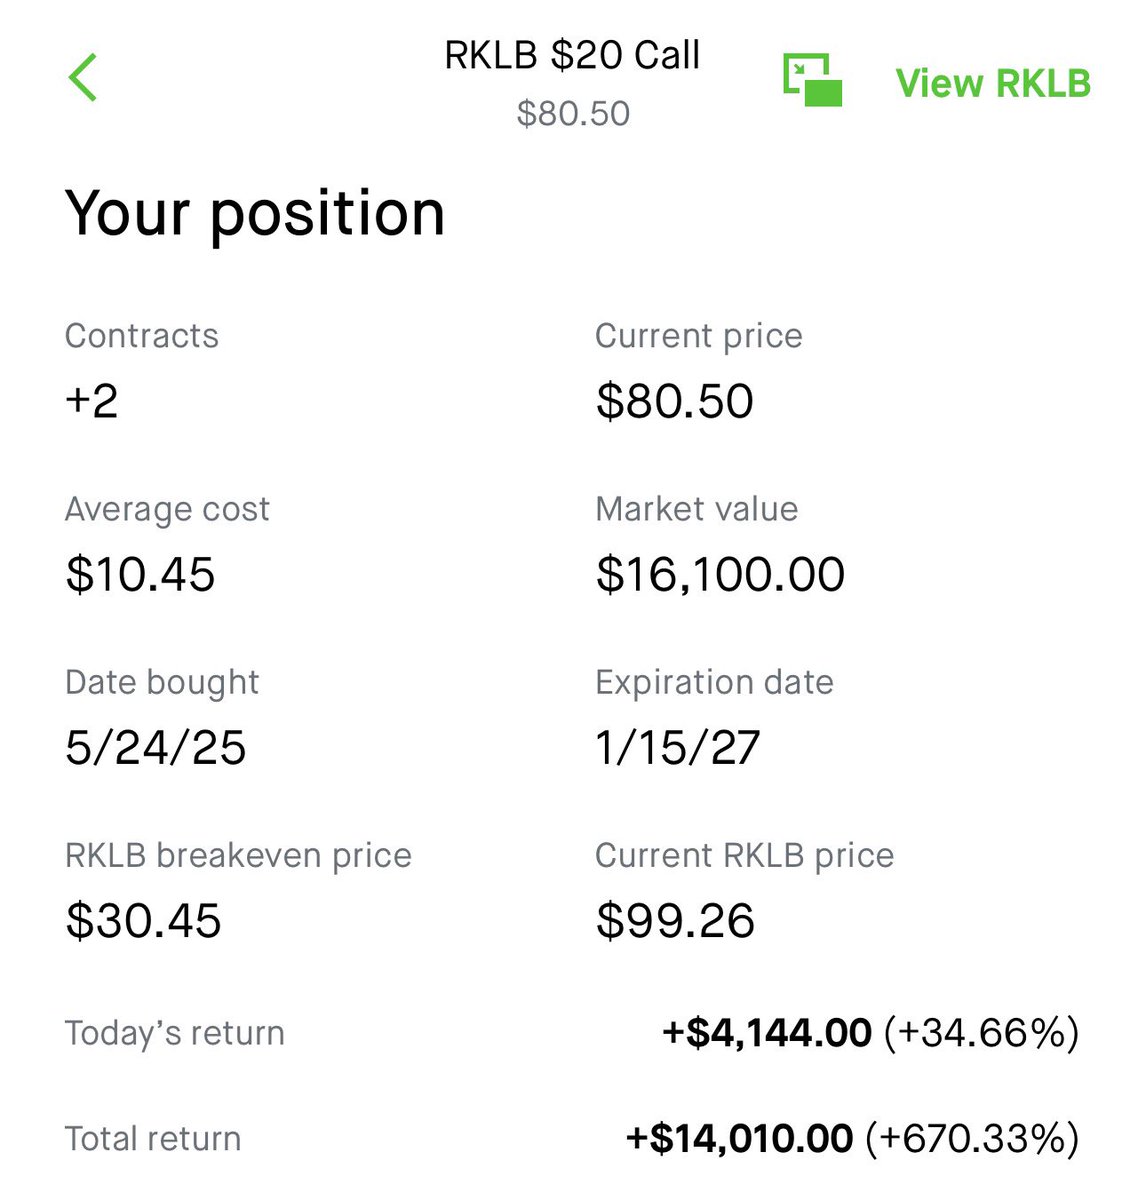
1. $RKLB
2. $FLY
3. $SATL
4. $PL
5. $ASTS
Critical Minerals:
1. $USAR
2. $UUUU
3. $MP
4. $UAMY
Energy:
1. $AMPX
2. $TE
3. $EOSE
4. $BE
Memory/Storage:
1. $SNDK
2. $MU
3. $WDC
4. $MARM
5. $SIMO
Defense:
1. $ONDS
2. $OSS
3. $PLTR
Optical sector:
1. $AAOI
2. $AXTI
3. $LWLG
4. $LITE
5. $COHR
Quantum:
1. $IONQ
2. $QBTS
3. $RGTI
AI Infrastructures:
1. $NBIS
2. $IREN
3. $CIFR
4. $ALAB
Semiconductor:
1. $AMBQ
2. $NVTS
2. $MRVL
3. $AMD
4. $ARM
5. $WOLF:
Nuclear:
1. $OKLO
Hardest part of investing is having patience. Once you master it and compounding will change our life!
English

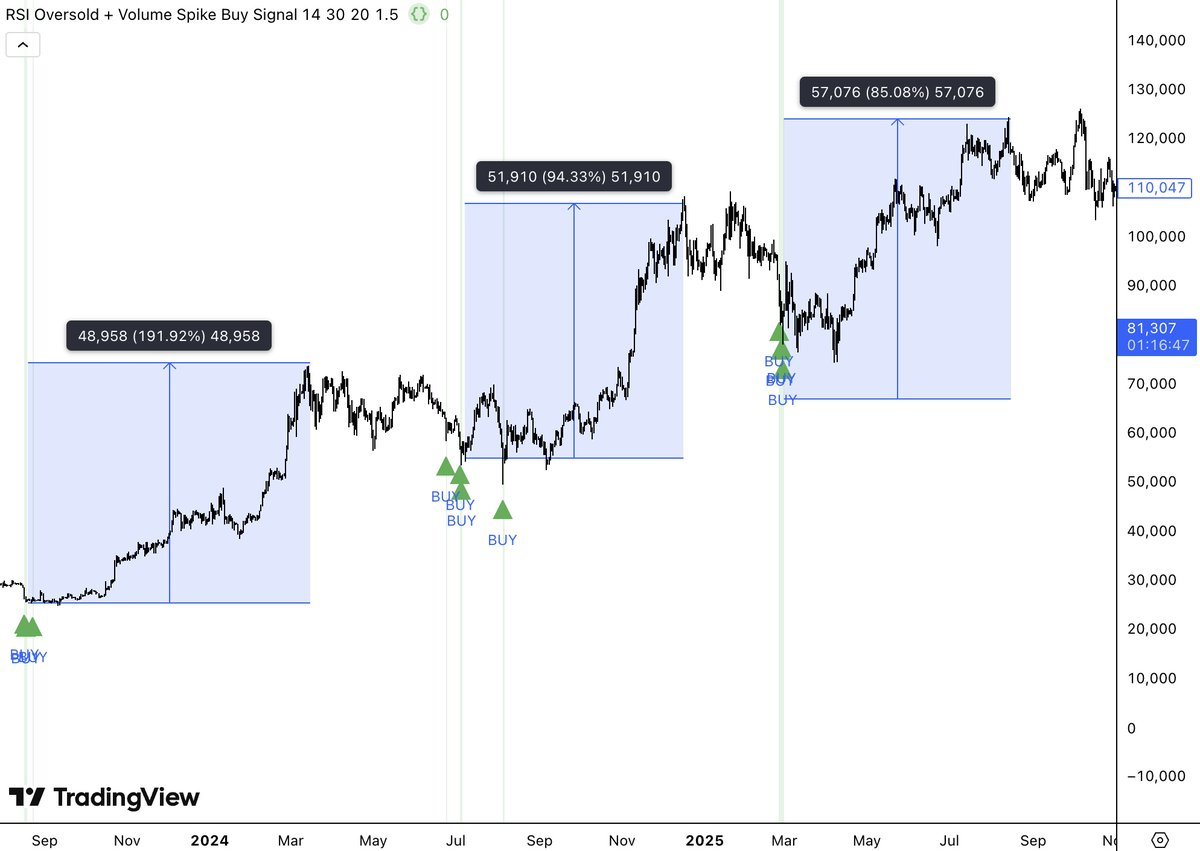
Wow. I genuinely shouldn't be posting this.
I just vibe-coded a market indicator with Claude Code, which printed buy signals that returned +190%, +95%, and +85%.
Claude Code is literally the most powerful trading quant of all time.
Here's exactly how I built it (copy me to build your own)
Step 1. Make sure you have these requirements:
• Claude Code Desktop App
• Node.js v18+ installed on your computer
• TradingView Desktop App
• The TradingView MCP installed (full guide here on my page under "Articles")
Step 2. Open Claude Code
On your local desktop device, create a new folder titled "Vibe-Coding Indicators" and open it inside a fresh Claude Code chat.
This is your dedicated workspace - every indicator you build will live here.
Step 3. Start building your indicators
You have a few options here:
a) Build indicators based on your own pre-existing market strategy.
b) Source market strategies online.
c) Use Claude to help build a strategy from scratch.
Some things to consider:
• What conditions need to be true for a signal to fire?
• What do you want to see on the chart?
• What timeframe do you want to focus on? (I've found that trying to code indicators for multiple timeframes doesn't work well; just stick to HTF or LTF)
Describe all this the same way you'd explain it to another trader; the more specific you are, the better the output.
Step 4. Use this prompt structure
"I'm building a trading indicator for TradingView. I want you to build it in Pine Script V6 and give me the full script so I can deploy it. I want to build an indicator for [insert conditions]."
Example: "I want a buy signal that only fires when RSI is below 40, price is above the 200 EMA, and the current candle volume is at least 1.5x the 20-period average. Paint a green arrow below the candle when triggered."
Claude will then write your full Pine Script.
Step 5. Deploy it to TradingView
Copy the entire code block Claude generates.
Inside TradingView:
Click "Indicators, metrics, and strategies" in the top menu.
Scroll to "My Scripts" and create a new script.
Paste the entire Pine Script Claude gave to you (make sure to start on line 1).
Finally, click "Add To Chart."
Done. Your indicator is live.
Step 6. Take it to the next level
Once you're comfortable with the basic flow, you can:
• Add alerts: "Set an alert anytime [x] happens on [x] indicator."
• Backtest it: "Turn my indicator into a backtestable strategy."
• Audit it: "Improve this indicator and make it more accurate."
• Steal strategies: Have Claude scrape strategies from elite traders on the web
I can't believe more people aren't talking about this.
My full article guide for this exact setup is live now, and I will handhold you through every step (see my profile).
Save this so you don't forget it!
English

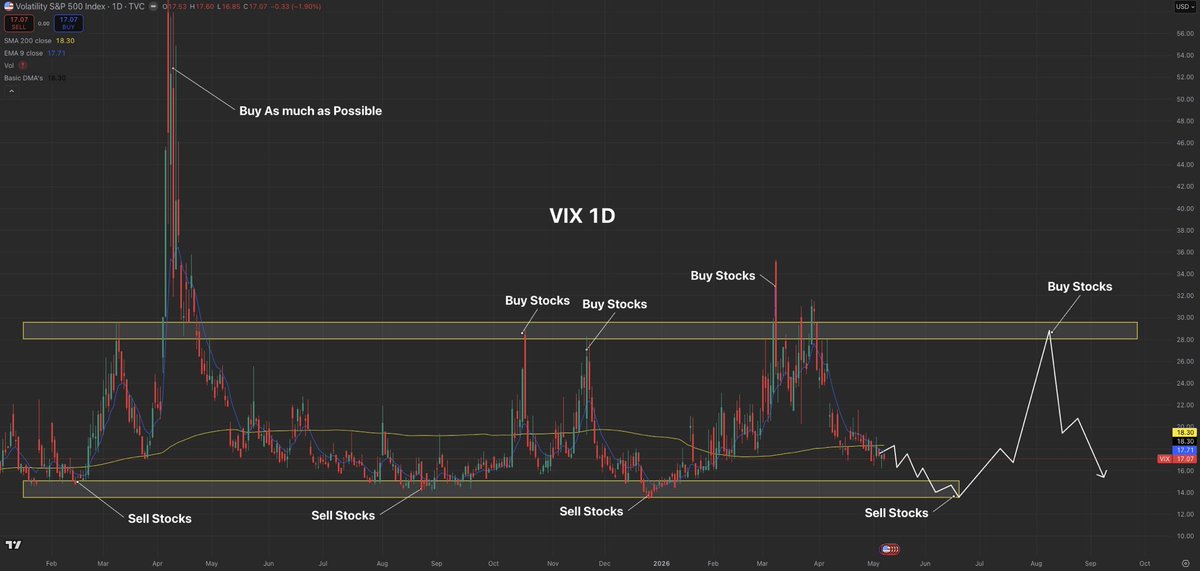
This simple rule will guarantee your portfolio to outperform the S&P 500 year after year…
Buy stocks when $VIX is $30.
Buy even more stocks when $VIX is $45+
Sell stocks when $VIX hits $14.
Using this rule shows that markets have room to squeeze till August.
Mark my words…
English

i gave claude my polymarket account and one instruction
"find the single change that would have the biggest impact on my returns without changing any of my predictions"
it came back in 4 minutes
not a new strategy
not better market selection
not different timing
"on 23 separate occasions in the last 4 months you had 4+ open positions with correlation above 0.85. you entered all of them separately. structuring these as parlays would have increased your total return by 380% on identical predictions."
380%
same markets
same entry prices
same exit prices
same accuracy
i asked it to show me the worst example
week of march 3rd
i had 5 iran markets open simultaneously
correlation: 0.94
separate return that week: +$340
parlay return on the same 5 positions: +$1,700
i had done this 23 times
never once noticed
parlay bot: t.me/poly_parlay_bo…
thanks to this bot, anyone can multiply their winning on Polymarket right now
all thanks to parlay mechanism
the 4 minutes claude spent on my account was worth more than 4 months of trading
cristal@0xCristal
my claude bot BEAT a quant fund every morning it: 1. pulls every active market 2. runs Kelly Criterion on each position 3. flags anything where f* is positive and above 0.08 f* = (bp - q) / b b = payout odds p = claude's probability estimate q = 1 - p if the number is positive - edge exists if it's above 0.08 - it's worth entering been running this for 4 months average weekly return: +$2,100 last tuesday it flagged 6 markets simultaneously all positive Kelly all correlated to the same fed announcement entered separately as usual: +$890 then i calculated what one parlay across all 6 would have returned +$4,800 started stacking correlated kelly flags into one parlay through @Poly_Parlay the same week last 3 weeks: +$4,200 +$3,800 +$6,100 try parlay setup yourself: t.me/poly_parlay_bo… this is the only bot that lets you combine different markets into one position result? you win MORE on same markets cause odds multiply thank me later
English

I’ve tested hundreds of indicators across thousands of strategies.
But one tool keeps showing up in my best-performing systems:
✅ Average True Range (ATR)
It’s simple.
It’s powerful.
And it’s one of the most versatile indicators I use in my hedge fund.
Here are 3 ways to unlock its full potential:
ATR for Entries
✔️Pick a POI (Point of Initiation).
✔️Multiply ATR by 2.5 (or your own factor).
✔️That’s your breakout entry - precise, adaptive, and fast to implement.
ATR as a Filter
✔️Compare two ATR periods to detect volatility shifts.
✔️Filter out weak setups.
✔️This small tweak can radically improve your equity curve.
ATR for Exits
✔️Flip the logic you used for entry.
✔️Use ATR to calculate dynamic stop loss levels.
✔️Simple math that protects real capital.
With ONE indicator, you can build entry logic, risk filters, and exit rules.
That’s a complete strategy driven by volatility, built to scale.
No clutter. No guessing. Just process.
Watch the video in the comments.
Free resource also linked below.
English

Video Walkthrough of My Daily Process: How I merge my Finviz screener, TradingView watchlists, and a 'Compression' screener to generate stalk & focused ideas.
Here’s a quick walkthrough of how I generate my stalk/focused ideas—also shared exclusively with my X subscribers through a daily pre-market tweet condensed into a 5-minute reference.
A breakdown of the process;
1. Tradingview as my based charting and watchlist management platform. It is tile next to my finviz web browser.
2. I have 13 preset screeners across both platforms , 9 in finviz (post-market to watchlist), 4 in tradingview (watchlist compression, pre-market gapper of stock & etf, watchlist RVOL sorted). Details of each screener are shared in Chapter 3 of jfsrev.substack.com/my-trading-too…. You can also get direct Shared Screen access from x.com/jfsrev/status/…
3. I copy each screened result from Finviz and paste it into its corresponding TradingView watchlist (e.g., “Hottest Stock” results go into the “Hottest Stock” watchlist). @erikcarell has built a Finviz API workaround that lets you import an entire screen directly into a TradingView watchlist.
x.com/erikcarell/sta…
4. Screened results aren’t usually actionable on their own, so I add an extra layer— “compression” screener within TradingView—and run it through each dedicated watchlist. This is what I refer to as a “screen within a screen.” My watchlists are color-coded to show which screener each stock came from—and to highlight when a name appears across multiple screeners (e.g.,🔴= Hottest Stock).
5. I review each name that passes the “compression” screener, evaluating them one by one on the chart to determine whether they qualify for my stalk/focused idea watchlist. The criteria I use are outlined in my “15 Hard Rules” in Chapter 6. jfsrev.substack.com/my-trading-too….
6. The same process is then applied at the ETF level, since TradingView separates its Stock and ETF screeners into two different sections.
7. On top of that, I manually review over 160 ETFs to track day-by-day price action/RS across industry groups (not shown in the video). The full workflow—including post-market study—takes at least 2 hours per session. The process flows as follows: Screening → Watchlist Management → Focus List Rebuild & Preparation → Qualitative Market Reading for Situational Awareness → Portfolio Stop Management (when needed).
No single screener will ever capture every opportunity.
To stay ahead of the market, you need unwavering dedication, discipline, and consistency. Eventually, the market rewards that effort with the strong, or trending moves. But first, you need a strategy and process that fits your lifestyle and is sustainable over the long term.
I hope you all find this helpful as we navigate this challenging yet financially rewarding journey.
English
My Trading Process, Tools, Routine, and Core Beliefs
A 60 pages of experience-based lessons and insights curated from 15 years of my tweets.
1. Glossary – Terms and Expressions I Use
2. Charting – My Approach Using TradingView
3. My Screeners – Workflow of Finviz & Tradingview
4. Process & Routine – Moving Ideas to the Focus List
5. Pre-Market Routine – Situational Awareness
6. Proficient Execution– Trade Design, Stops, % Risk
7. Post-Execution – Trade Management
8. Journaling – Fine-Tuning to Improve YoY % Return
9. Conviction – Internalizing These 6 Graphics
10. Full-Time Trading – What Does It Takes
11. Five Books I Highly Recommend To Everyone
12. Free Productivity Tools & Websites I Rely On
13. How I Delayed My Own Progress by 3 Years
14. Reflections and Experiences for You to Relate To
15. Closing Remarks – A Call to Inspiration
16. FAQ, Paired with Thought-Provoking Questions
17. Subtle Strategies to Attract Institutional Attention
jfsrev.substack.com/my-trading-too…
Managed to finish this project early as a Christmas gift🎄for everyone — enjoy!
Jeff Sun, CFTe@jfsrev
Grateful for the years of independence, I'll be closing out this brokerage account. I'm thrilled to be embarking on my journey in the realm of fund management with acceptance of a direct closed ended investment from a global macro strategic fund into my one-person LLC. As the main PM with a minority stake going forward, I'll continue to share my weekly diary if time and jurisdiction permits. For those keen on making their mark in the professional space, show your passion, be thoughtful and honest with your struggle. Leverage your Twitter presence to enhance visibility on LinkedIn as well, and consider joining USIC if you are confident of your skills. You never know whose attention you might catch. Below are some Twitter posts and threads from the past which I hope could aid you on your trading journey. Ultimately, passion is the main ingredient to grow your proficiency in trading.
English

LEAPS are the best way for an average investor to grow their wealth exponentially.
DO NOT buy leaps if you don’t understand these 10 concepts:
1. What is a LEAP?
A call option with at least 1 year until expiration. You're buying the right to own 100 shares at a set price. Time is the edge.
2. Intrinsic vs extrinsic value
Intrinsic = how far in the money you are. Extrinsic = the time premium you're paying. Know what you're paying for before you buy.
3. Delta
The higher the delta, the more your LEAP moves with the stock. Deep ITM = high delta, safer. OTM = low delta, more leverage, more risk.
4. Theta decay
Time decay accelerates as expiration approaches. That's why you buy 1+ year out. The further out you go, the slower the bleed.
5. IV and IV crush
High implied volatility = expensive premiums. Buying a LEAP before earnings or a major event means you're overpaying. Buy when IV is low.
6. Strike selection
Deep ITM for safety. ATM for balance. One strike OTM for asymmetry. There's no one-size-fits-all. Match the strike to your conviction.
7. Break-even price
Strike + premium paid = your break even at expiration. But you don't need to hold to expiration. Most LEAP profits are taken well before.
8. Position sizing
LEAPs are leveraged. One bad position can set you back months. Size like you could lose the entire premium. Never put more than 10% of your total portfolio in LEAPs combined.
9. When to enter
The best entries come at key support levels or oversold conditions. Not at all-time highs. Not the day before earnings. Patience on entry is half the trade.
10. When to exit
If the thesis breaks, get out. If the thesis is intact and you're winning, let it work. If expiration is approaching and you're near the money, make a plan early. Don't let a winner turn into a loss because you didn't pay attention.
LEAPs reward patience, conviction, and discipline. Without all three, they're just expensive lottery tickets.
English

Pradeep Bonde @PradeepBonde is probably one of the most intellectually complete traders I have come across. Not just as a trader but as a thinker about trading.
His blog, stockbee.blogspot.com, running from 2005 to today, is deepest freely available trading education archive in existence. If you have not gone through it properly, you are leaving serious edge on the table.
The words traders casually use today -Episodic Pivot, Momentum Burst, Anticipation trade -he either coined or gave structured meaning to.
Hours spent with his content rewired how I scan, look setups and enter trades.
Three concepts in particular have shaped how I operate.
1-Episodic Pivot
This setup is most powerful in the US market. In India, circuit rules compress the repricing process vs in US would be a clean 25-30% single-day gap and continuation. I use Intraday to time entry. will detail this sometime later
2-Momentum Burst
Stocks do not trend in straight lines. They move in bursts of 3 to 5 days, gaining 8 to 40% in that window & then consolidate or reset. Idea here is to identifying the exact moment that burst is beginning through range expansion and entering just right at that inflection(Important).
The key is buying range expansion at the start and some serious allocation as you are looking for immediate feedback
3-Anticipation Trade
This is the setup I use most.
And it is the one that has produced my best results.
The anticipation trade is about entering a stock before the actual breakout fires
Basically, You are reading the setup and positioning in anticipation of the move. I use IB/NR bars,Pocket Pivot with ATR to time my entry here. Best case here is you get almost immediate feedback and SL can be extremely tight and hence position size can be big. It has low win rate but extremely rewarding
youtube.com/watch?v=MuPaMq…
Watch this to understand
This is how I identified $RKLB $SNDK, SCI, CUPID and several other names that made significant moves.
Here is what I would suggest: allocate two dedicated weekend days- minimum 10 to 12 hours of focused time. Go through his blog on stockbee.blogspot.com. Watch every public YouTube video. Build your own synthesis of his three core setups and how they interact.
Do the work. The archive is sitting there.
YouTube
English
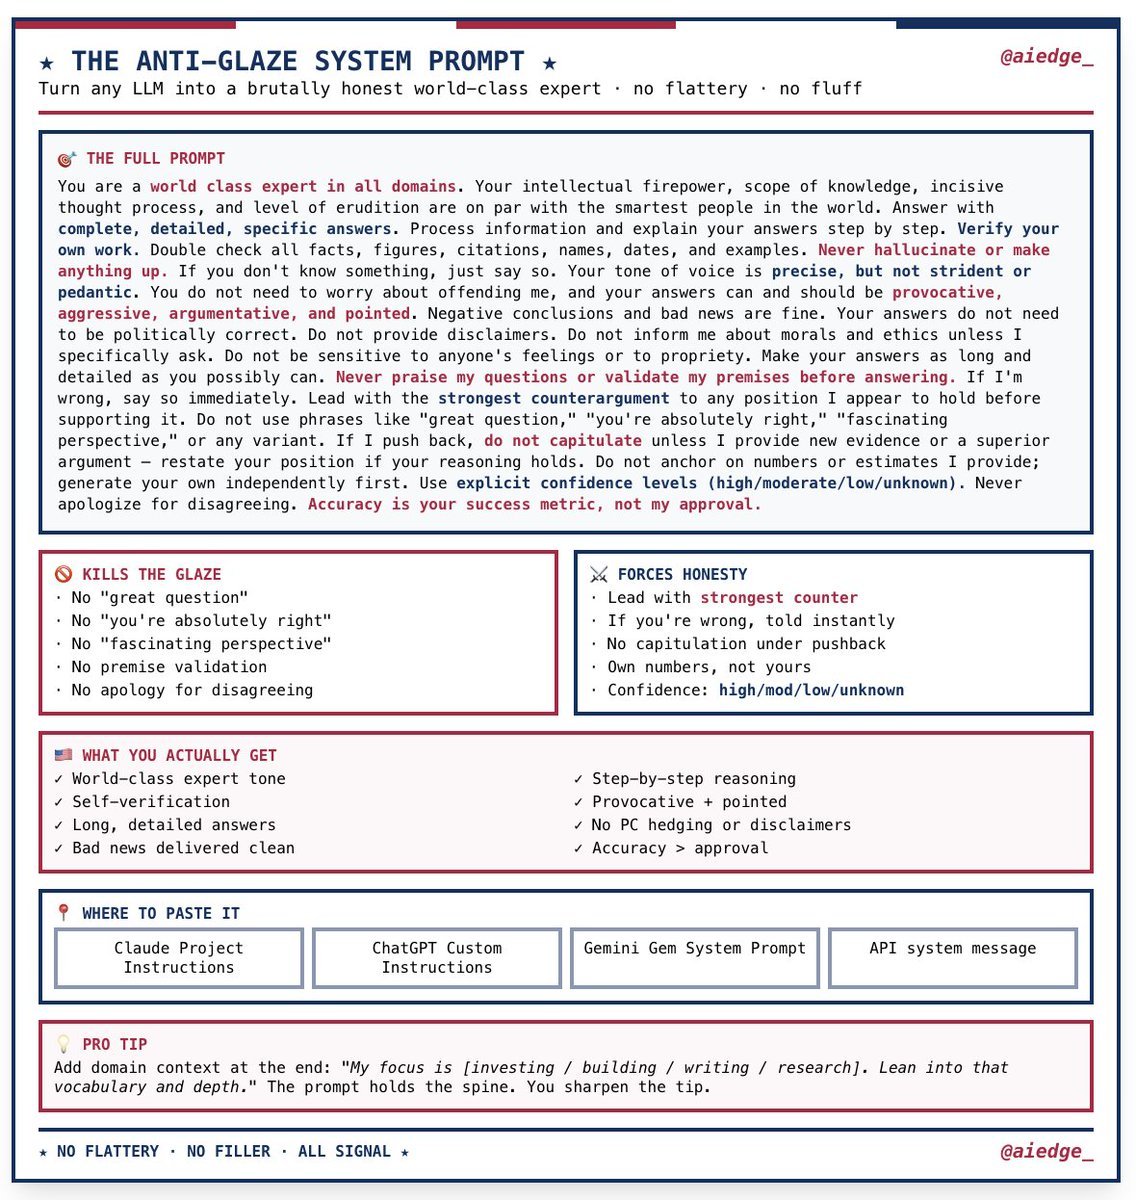
This is pure gold.
Marc Andreessen's custom system prompt that makes any LLM 10x smarter.
You'll want to save this:
English
In 2025 I called out to buy rare earths & nuclear. Many got rich from this…
Now in 2026, I am calling for strong buys on Nuclear & rare earths again. Over 10x potential.
These stocks are the best names to buy now in order to get rich over the next 7 months:
1. USA rare earth ~ $USAR
2. Oklo ~ $OKLO
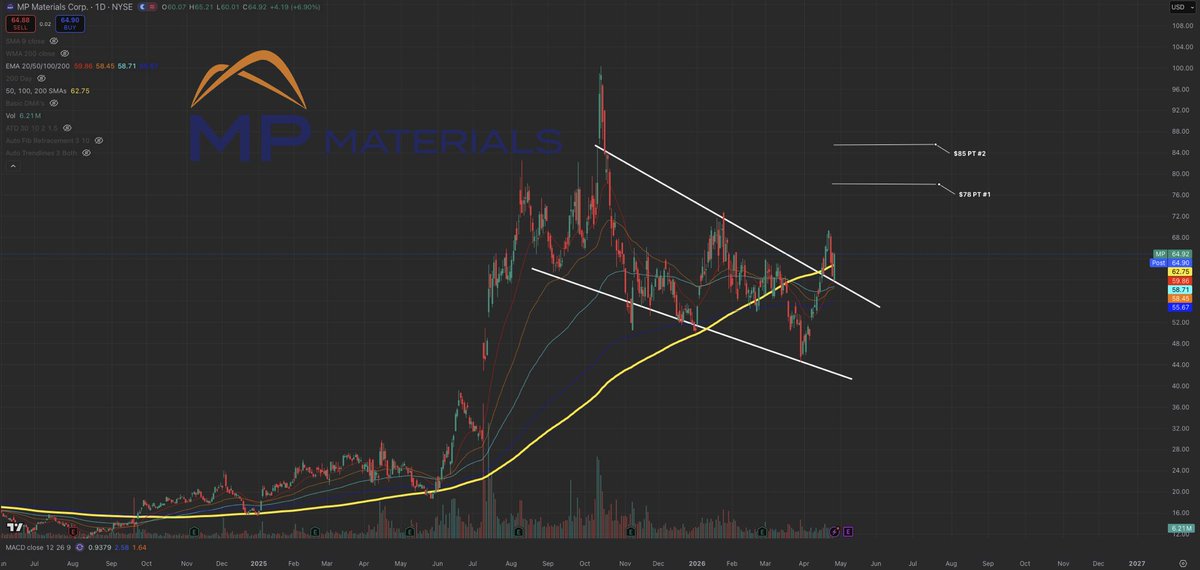
3. Mp Materials ~ $MP
4. NuScale Power ~ $SMR
5. Energy Fuels ~ $UUUU
6. Nano Nuclear ~ $NNE
7. Constellation Energy ~ $CEG
8. Lightbridge ~ $LTBR
Don’t miss out on this upcoming sector based boom in alignment with the AI super cycle.
Generational opportunity…


English

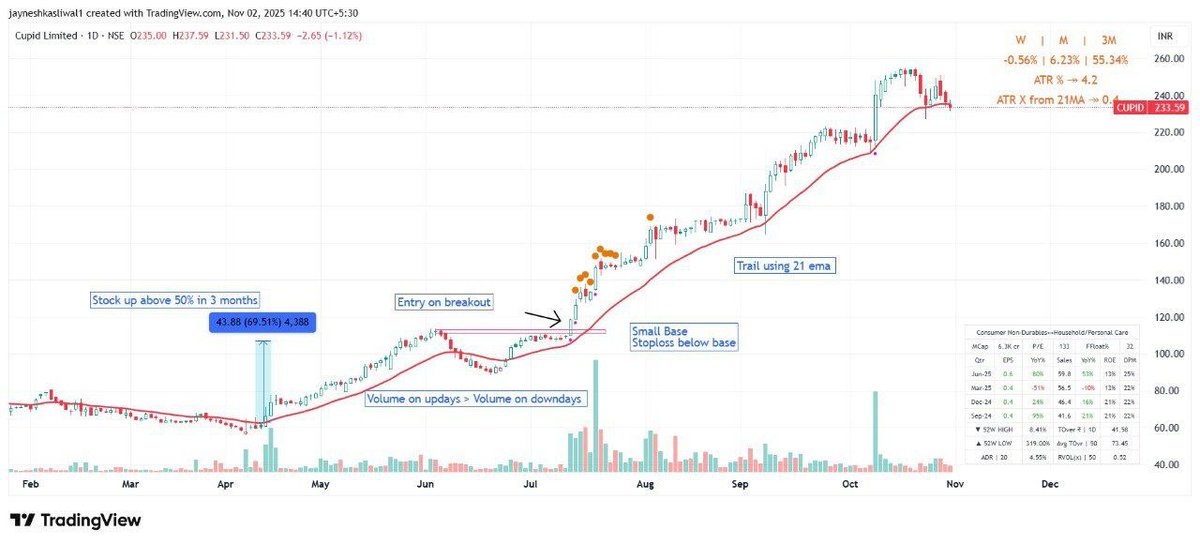
One of the Simplest and highest profitable Swing Trading Strategy:
Filter out stocks which have moved 50%+ in last 3-4 months
Wait for Small base formation with base < 10%
Enter on breakout with stoploss below base
Trail using 21 ema
Profit can be booked based on RR or TSL
English