Franz-Georg Wenner

10.6K posts

Franz-Georg Wenner banner
Franz-Georg Wenner

Franz-Georg Wenner

@FGWenner

Aktien, Indizes, Rohstoffe, Devisen - Tägliche Chartanalysen, Fundamental- und Konjunkturanalysen

FFM Katılım Ocak 2012
165 Takip Edilen2.4K Takipçiler
Franz-Georg Wenner retweetledi
Ryan Detrick, CMT
Ryan Detrick, CMT@RyanDetrick·
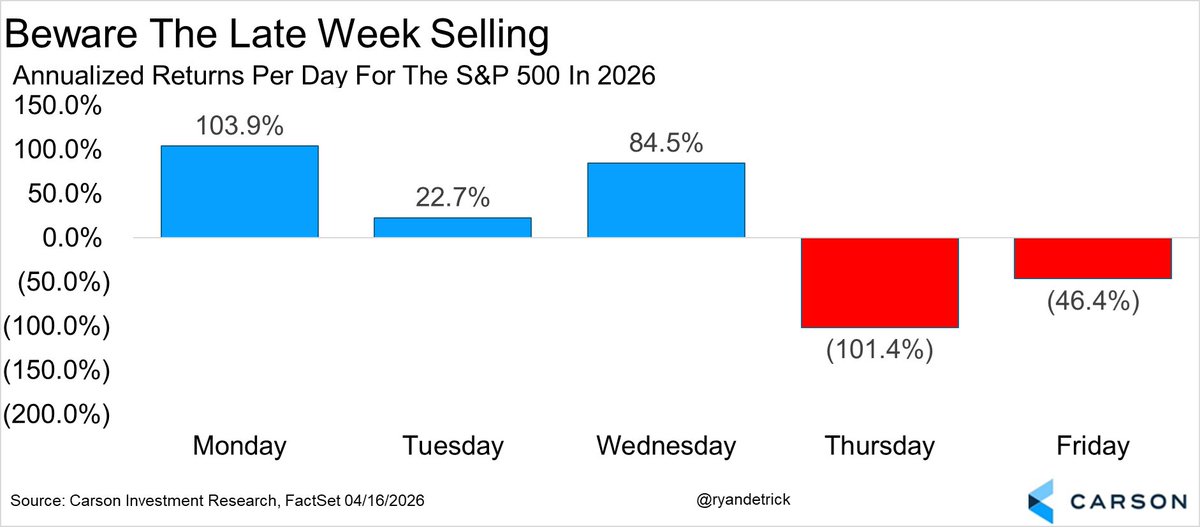
The S&P 500 hasn't been up on Thursday and Friday of the same week in nearly three months. Could it happen today? If so, it would be another clue things have drastically improved, as traders are willing to hold over the weekend.
Ryan Detrick, CMT tweet media
English
9
9
107
7.3K
Franz-Georg Wenner retweetledi
The Kobeissi Letter
The Kobeissi Letter@KobeissiLetter·
Risk appetite among institutional investors is skyrocketing: Institutional investors purchased ~22% more call than put options last week, the largest difference in at least 16 months, according to Citadel. Monday and Tuesday also saw significant institutional call option inflows, now on track for the largest weekly bullish reading since October 2024. As a result, institutional demand for call options is up to the highest level on record. Institutional call option purchases over 5 days ending Tuesday have exceeded the average since January 2025 by +37%. By comparison, during the April 2025 market recovery, the average was surpassed by +25%. Institutional investors are piling into equities.
The Kobeissi Letter tweet media
English
58
125
681
85.9K
Franz-Georg Wenner retweetledi
Ryan Detrick, CMT
Ryan Detrick, CMT@RyanDetrick·
The recent 9.8% rally in 10 days for the S&P 500 was the 20th best 10-day rally in history. Looking at those other signals showed very strong future performance was quite common (didn't work in early 2000s though). Up a median of nearly 21% a year later. 💪💪
Ryan Detrick, CMT tweet mediaRyan Detrick, CMT tweet media
English
10
18
164
18.3K
Franz-Georg Wenner retweetledi
The Market Stats
The Market Stats@TheMarketStats·
$VIX fell more than -40% in the past 13 days Historically, similar declines saw $SPX higher every time, 1 year later Average gain: +15% Max drawdown: -10.2%
The Market Stats tweet media
English
4
45
254
23.1K
Franz-Georg Wenner retweetledi
Bluekurtic Market Insights
$SPX might be on track for its best April ever. S&P 500 is halfway through April, and this is the second best start since 1950. In top 10 starts, rest of April was positive 100% of the time. Even better? Rest of year was also positive 100% of the time with avg gain of 16.7%
Bluekurtic Market Insights tweet media
English
4
20
92
6.5K
Franz-Georg Wenner retweetledi
The Market Stats
The Market Stats@TheMarketStats·
Despite stocks at all time highs, investors are still bearish AAII Bears have stayed above 40% for 6 consecutive weeks Similar bearish sentiment saw $SPX higher every time 3 months later Average gain: +7%
The Market Stats tweet media
English
7
32
170
21.4K
Franz-Georg Wenner retweetledi
Barchart
Barchart@Barchart·
JUST IN 🚨: Nasdaq trades green for 12 straight days, its longest winning streak in nearly 17 years 📈🥳🤑🫂
Barchart tweet media
English
88
401
2.8K
227.5K
Franz-Georg Wenner retweetledi
Ryan Detrick, CMT
Ryan Detrick, CMT@RyanDetrick·
The Nasdaq-100 is up 12 days in a row. This index started in 1985 and only seven other times has it been up this many days in a row. One year later? It was up EVERY. SINGLE. TIME
Ryan Detrick, CMT tweet mediaRyan Detrick, CMT tweet media
English
31
104
662
82.8K
Franz-Georg Wenner retweetledi
Subu Trade
Subu Trade@SubuTrade·
NASDAQ up 12 days in a row! This is historic momentum, and was bullish for both the NASDAQ and $SPX $QQQ $SPY
Subu Trade tweet media
English
29
77
434
31.7K
Franz-Georg Wenner retweetledi
Nautilus Research
Nautilus Research@NautilusCap·
SPX Election cycle seasonal composite.
Nautilus Research tweet media
English
14
158
632
127.4K
Franz-Georg Wenner retweetledi
The Market Stats
The Market Stats@TheMarketStats·
NASDAQ is up 11 consecutive days Similar streaks of strong momentum saw $NDX finish higher 1 year later 100% of the time, with an average gain of +26% The average maximum loss was -8%
The Market Stats tweet media
English
13
107
533
46.8K
Franz-Georg Wenner retweetledi
The Kobeissi Letter
The Kobeissi Letter@KobeissiLetter·
We are witnessing a historic rally: The Nasdaq Composite has finished green for 10 consecutive trading sessions, the longest streak since November 2021. The index has rallied +13.7% over this time span, the biggest recovery since 2022 and the third-largest since 2009. If the streak extends to 11 days, this would mark the longest streak since 2019. The S&P 500 has also been positive in 9 out of the last 10 trading sessions. The market is experiencing one of its best recoveries this century.
The Kobeissi Letter tweet media
English
155
288
1.9K
212.8K
Franz-Georg Wenner retweetledi
Warren Pies
Warren Pies@WarrenPies·
The last 10-days have been unlike any 10-day period in the market since 1950. First, the S&P 500 is up 9.8% in 10-days, which is in the 99.7th percentile of all 10 day returns.
Warren Pies tweet media
English
168
772
5.9K
1.1M
Franz-Georg Wenner retweetledi
Charlie Bilello
Charlie Bilello@charliebilello·
The 38% decline in the $VIX over the last 2 weeks is the 7th biggest volatility crash in history.
Charlie Bilello tweet media
English
36
220
1.2K
192.1K
Franz-Georg Wenner retweetledi
Bluekurtic Market Insights
Bluekurtic Market Insights@Bluekurtic·
For the first time in 2026, S&P 500 gained 2%+ and Nasdaq jumped 3%+ in a single day. These outsized moves are rare in bull markets. Since 2023, just 24 for $SPY and 16 for $QQQ. They tend to cluster in bear markets or late cycle speculation like run up to the dot com bubble.
Bluekurtic Market Insights tweet media
English
2
8
62
3K
Franz-Georg Wenner retweetledi
Ryan Detrick, CMT
Ryan Detrick, CMT@RyanDetrick·
Might not feel like it now, but the first two months of this year were literally one of the least volatile in history. In terms of the range, it was indeed the smallest range EVER. To see a bigger move in March really shouldn't be a big surprise.
Ryan Detrick, CMT tweet media
English
4
12
163
16.1K
Franz-Georg Wenner retweetledi
Bluekurtic Market Insights
Bluekurtic Market Insights@Bluekurtic·
Today, S&P 500 $SPX is set to close negative in first quarter of 2026, a midterm year. Negative Q1s in midterm years have been tough for the rest of the year. Full year was positive 3 of 11 times, and average return was -8.7%. Average price path shows a bottom around day 200.
Bluekurtic Market Insights tweet media
English
1
22
80
7K
Franz-Georg Wenner retweetledi
Ryan Detrick, CMT
Ryan Detrick, CMT@RyanDetrick·
This is no early April Fools' joke, but Thursday is down an annualized 147.6% this year for the S&P 500. Monday is up 108.2% at least, but that isn't making up for Tuesday, Thursday, and Friday.
Ryan Detrick, CMT tweet media
English
13
30
212
43.3K