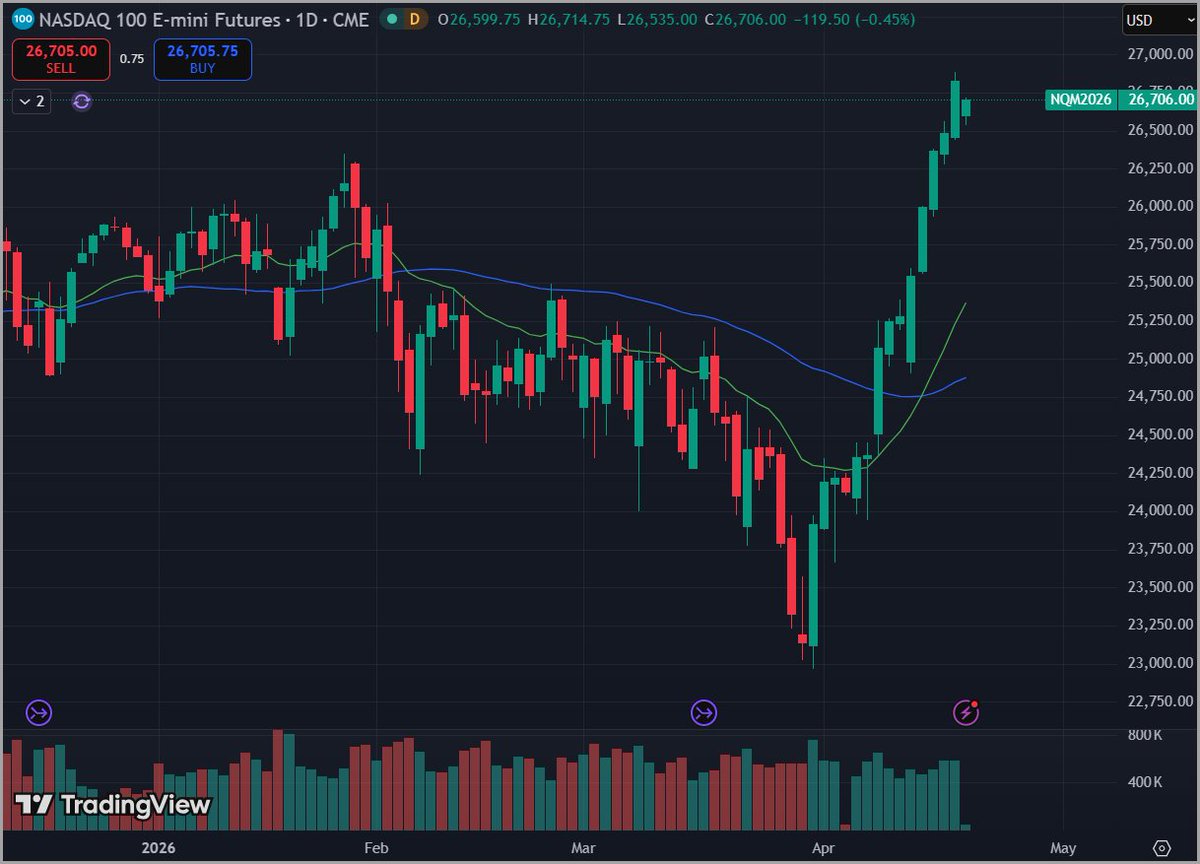
KOR Capital
647 posts

KOR Capital
@kor_capital
Enjoy Volatility Provided That The Security is Going Straight Up 📈
Manhattan, NY Katılım Nisan 2018
1.2K Takip Edilen386 Takipçiler

@dampedspring @Crowded_Mkt_Rpt George Soros famously said: “When I see a bubble forming I rush in to buy.” He thought it was actually quite rational to buy at the early stages of a bubble because of how big they could get in such a short period of time.
English

@Norseman1 As the legendary Sven Henrich/Northman Trader would say we still have a bearish momentum divergence with regards to weekly RSI for the S&P 500 with a lower weekly RSI thus far this week than on previous weekly high on 1/9/26
English

@Norseman1 Amazing that NYSE A-D line is negative over past 50 trading days (decliners leading advancers over past 50 days on NYSE) given that S&P 500 is over 4.8% above its 50 SMA…seems like a major bearish divergence brewing with A/D line although in 2000 that took years to play out.
English

$NYSE has yet to make a new all-time high,… but that doesn’t really matter quite yet because the NYSE A-D Line did which gives it a bullish divergence vs the $NYSE.
This is not Major Top material!! Wasn’t before, and now really is not!

Norseman Market Timing@Norseman1
2025 vs. 2026 Major Tops are a multi-month process. 4+ months is the average. We currently have the opposite situation as 2025. $SPX $NYSE
English

@WalterDeemer Amazing that despite Whaley price thrust and such strong action by the indexes over the past 50 days (S&P 500 over 4.8% above its 50 SMA) that there have been more decliners than advancers (advance/decline line is negative) over the past 50 trading days on the NYSE.
English

@RealSimpleAriel Wild to see NYSE advance/decline line negative over the past 50 trading days while S&P 500 over 4.8% above its 50 day.
English

We just aren't seeing that breadth expansion as I'm sure most of us would have loved to see. $XLI $XLU $XLV $XLP $XLF $XLB $XLC $XLY all slightly underwhelming right now.
Maybe things change after this FOMC and big 4 earnings reports tonight.
TheChartGuys@ChartGuys
@RealSimpleAriel I would have preferred a bit more rotation during this semis consolidation. XLV weekly bear flag. XLF saw a bit. IGV nothing.
English

@IBDinvestors @IBD_JNielsen @AlissaCoram New high list within IBD data tables showing 0 new highs and 0 new lows; looks like data glitch; can you fix as soon as possible? Thank you

English

@DanielTNiles On April 22, 2026 SOX (PHLX Semiconductor Index) closed 40+% above 200 day at same time XLF (Financial ETF) closed below its 200 day. Before this past Wednesday, that has only occurred 57 trading days in history all within the range of December 1999 to early May 2000.
English

Last wk, S&P +0.5% powered by 1) hardware related AI stocks (SOX Index +10% & now up 18 straight trading days +49% over that time), and 2) with the investigation on Powell now over, optimism on Warsh being confirmed, who wants easy money policies.
What was surprising is this strength occurred despite 1) WTI up 13% last week to $94, 2) bond yields also up 7 bps on the 2 & 5yr with the curve flattening with the 30yr only up 2 bps, and 3) the AI displacement names having a tough week due to $NOW (-7% on slowing organic growth and margins) and to a much lesser extent $IBM (-2%) which did not raise CY26 forecasts despite beating Q1 estimates.
As for the five Magnificent 7 names reporting this week, I believe all of them will beat estimates for CQ1. I expect accelerating AI related hyperscaler revs for $MSFT Azure, $AMZN Web Services, and $GOOGL Cloud driven by the surge in Agentic workloads. $AAPL is seeing solid China iPhone sales due to share gains & strong mac Mini sales due to OpenClaw. $META continues to use AI incredibly well to drive ROI through increased engagement and ad monetization.
Google remains my long-term favorite as the only company with the full AI stack (TPU chips since 2016, public cloud, leading LLM in Gemini, Android smartphones for distribution, massive cash flow through ad monetization.)
Having said that, I could see the following issues with guidance for the above companies: 1) close rates impacted at the end of Q1 by the Iran war, 2) the surge in semiconductor prices impacting future margins, 3) rising oil prices raising shipping costs, 4) falling consumer confidence slowing future ad budgets, 5) a pull forward in demand due to anticipated price increases resulting in less 2H growth, and 6) rising AI spend impacting cash flow.
As a reminder, despite stellar CQ4 results reported in January, the five names reporting next week, declined 1% on average in reaction to earnings the next day with three of the five down.
In addition, all the major Central banks meet this week but I see that as largely a non-event to slightly positive. Those with a hiking bias such as the BoE, ECB and BoJ will likely sound a bit more sanguine give the growth fears from higher oil prices despite technically not having a dual mandate and more of a price stability mandate.
Given the 20% increase in the Mag7 stocks since their March 30th bottom driving a 13% increase in the S&P to technically overbought levels, the risk reward after this sharp rally is not great and a shallow correction would not surprise me in the near-term. The longer oil stays in the $90s, the more the odds ramp up for something more severe as the market starts to discount a more stagflationary environment.
But as I have written before, President Trump has the mid-terms coming up which incentivizes him to end the Iran conflict sooner rather than later. Second, the economy of China is one of the hardest hit by higher oil prices. As a result, they will put pressure on their ally Iran to end it as well now that the US has blocked all ships from using the Strait of Hormuz. Both factors should lead to a resolution of the Iran war before too long despite the posturing from both sides for negotiation leverage.
In summary, as I wrote on March 31st, "History may not repeat itself but it often does Rhyme." Despite my concerns of a near-term correction, I do ultimately believe much like after the macro scares in 1997/98 in years 3/4 of the internet buildout, that 2026 will ultimately end much higher than where it is today. The drivers are likely to be 1) Agentic AI ramping and 2) greater easy money policies under the new Fed Chair. Easy money and AI have been the dual drivers of this market since the end of 2022 and I do see more of both as 2026 progresses.
All the best in the week ahead.
English

@WayneWhaley1136 @WalterDeemer On April 22, 2026 SOX (PHLX Semiconductor Index) closed 40% above 200 day at same time XLF (Financial ETF) closed below its 200 day. Before this past Wednesday, that has only occurred 57 trading days in history all within the range of December 1999 to early May 2000.
English

WHEN JANUARY & APRIL AGREE - THE REST OF THE YEAR MAY BE A SIGHT TO SEE
Since 1950, the S&P is 54-22 in the last 8 months of the Year (May-December) for an avg, 8 month, gain of 5.58% with 10% moves 25-7 to the positive.
The month of January was up 1.37% and as of April 25, April is up 9.75% with four trading days in the month remaining.
If January & April are both positive, the last eight months of the year improve to 30-6 for an avg gain of 8.54% with THE 10% MOVES 15-1 to the positive.
This contrast dramatically to those 13 years in which both months were negative, which led to a 4-9 last eight months of the year for an avg loss of 4.12%.
The Bullish Japril Barometer Signal is # 9 on this weeks list of Top Ten reasons to own equites at the moment, a list shared with my Study Subscribers this week. I maintain a similar list of arguments that warrant caution ~ waynewhaley.witterlester@gmail.com

English

@RealSimpleAriel On April 22, 2026 SOX (PHLX Semiconductor Index) closed 40% above 200 day at same time XLF (Financial ETF) closed below its 200 day. Before this past Wednesday, that has only occurred 57 trading days in history all within the range of December 1999 to early May 2000.
English

@RealSimpleAriel The post-market gap has not even gotten us back to 3:30 PM prices on SPY today
English

@PradeepBonde Have you ever seen the number of stocks up 20% plus in 5 days exceed 100 for this many days and still no selloff/consolidation? I think 3 of last 4 days have been 100+ and Friday was 150+ I believe.
English

@Norseman1 I hadn’t seen you focus on the SPX 600 A-D line before this past week. Do you no longer wait for the NYSE A/D line which presently shows a bearish divergence with S&P 500 making new highs and NYSE A/D line not yet hitting new highs?
English

The $SPX 600 made a new #ATH yesterday, 1 day ahead of the $SPX which made it’s today.
The $SPX 600 A-D Line made a new Bull Market high a few days ahead of $SPX 600 price ATH.
Scream at the charts all you want… this is not Bear Market, it’s the opposite! It represents liquidity! It kicks the can to a Major Top out months every high printed and suggests the other A-D Lines will follow shortly!

English

@Peoplewish I’ve been too busy trying to short $CAR all day and covering as it goes back above VWAP.
English

I could understand not being heavily invested two weeks ago or even last week. But at this point, daily charts are breaking out of big bases across the board. If you still cannot build a portfolio and get capital to work in this market, at some point you have to question your strategy or system. Yes, there will still be continuation setups to press as the market keeps moving higher. But unless you have been in a coma for the last two to three weeks, if you are not at least 70% invested by now, something is broken. There's guys out in the middle of no where fully invested with a starlink connection.
English

@RyanDetrick Ha one market had a 35% decline and the current market had less than 10% decline so this is much bigger rip given the limited drawdown
English

@sp3cul8r @CFlanders7 Yes today was the 16th trading day…the under 40% triggered on 3/20/26 and we were unable to reach 61.5% by April 2, 2026. Today (day 16) finished at 61.1% though.
English

Christian Flanders @CFlanders7 set me straight on Zweig Breadth Thrust. The window opened too early on 3/20, so we didn’t get it over a 10 day period. Thx Christian!
Nonetheless, it’s been a huge turn around in breadth. Fast & furious & probably locked out a LOT of big money
English

@sp3cul8r Actually today was the 16th trading day…the under 40% triggered on 3/20/26 and we were unable to reach 61.5% by April 2, 2026. Today (day 16) finished at 61.1% though
English

@TheSwingTraderr Why are previous ATHs not the line in the sand? Why are junk bond ETFs (JNK and HYG) still below their 200 day line?
English

$SPY $680–$685 is the line in the sand.
A higher low from here would suggest a bottom is forming.
A rejection at the 200MA confirms more downside.
This level lines up with key resistance, the JPM collar, monthly options move, and the inverse H&S measured move.
This is the level that decides what comes next.
Now we wait and react.
English

@market_sleuth Nice bounce off the 200 day on the $VIX. If the VIX has anything left it should show itself right now off the 200 day.
English

Absolutely! It’s 41% now (31 to 18). 🔽
Charlie Bilello@charliebilello
The 38% decline in the $VIX over the last 2 weeks is the 7th biggest volatility crash in history.
English


