@realharveymark In this current environment, do you prefer long vol instruments or index puts?
English
larrylegend718
556 posts


Can’t stop, won’t stop

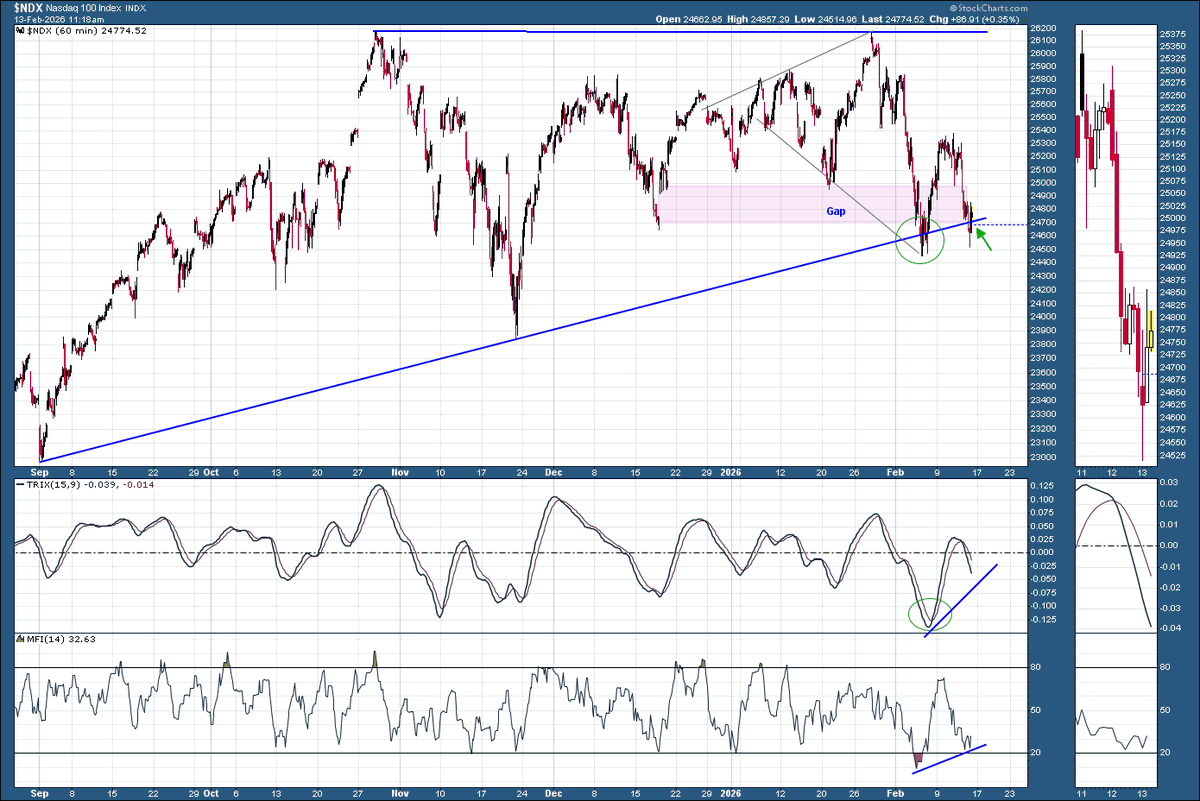
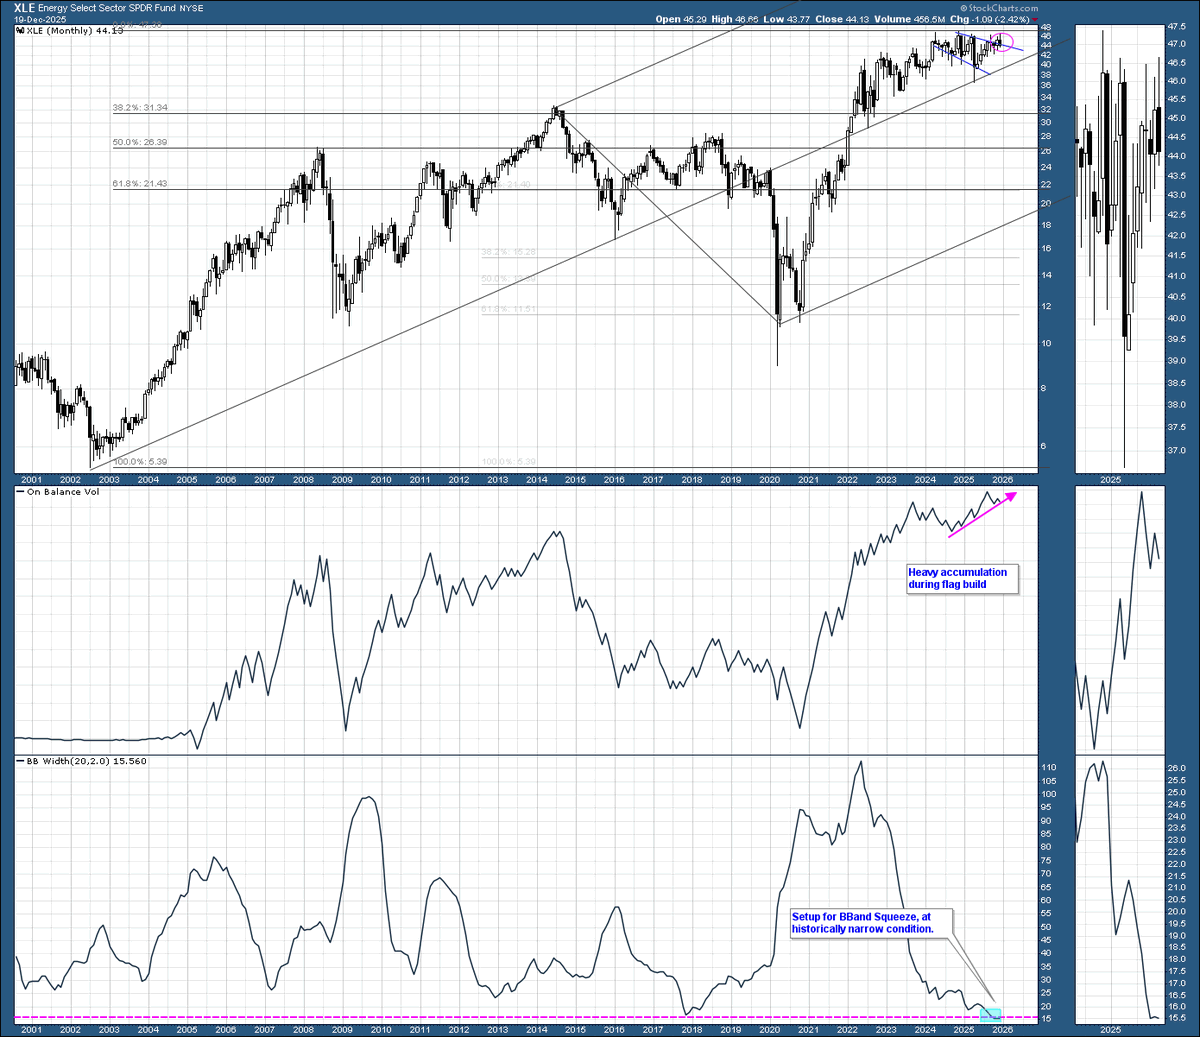
#NASDAQ100 $ndx $qqq Updating my thesis from Feb 9. While shorting worked out fine, this no longer appears to be a 2025 analogue. All signs point to heavy accumulation during consolidation - net bullish. May just need more time, then up!
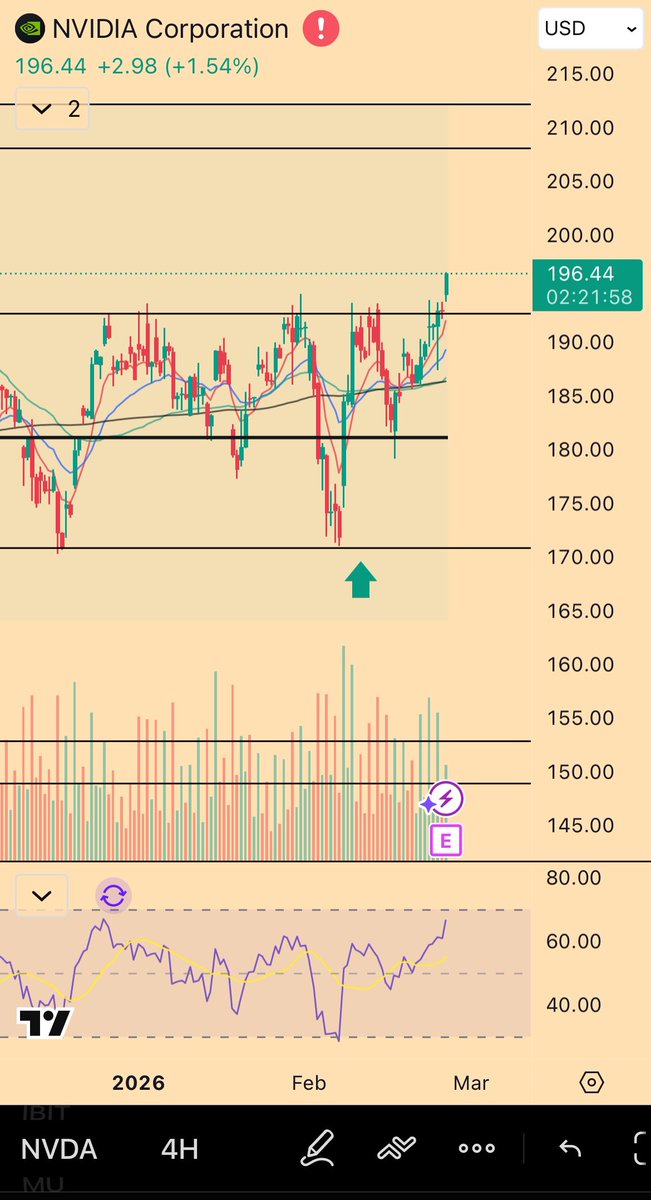
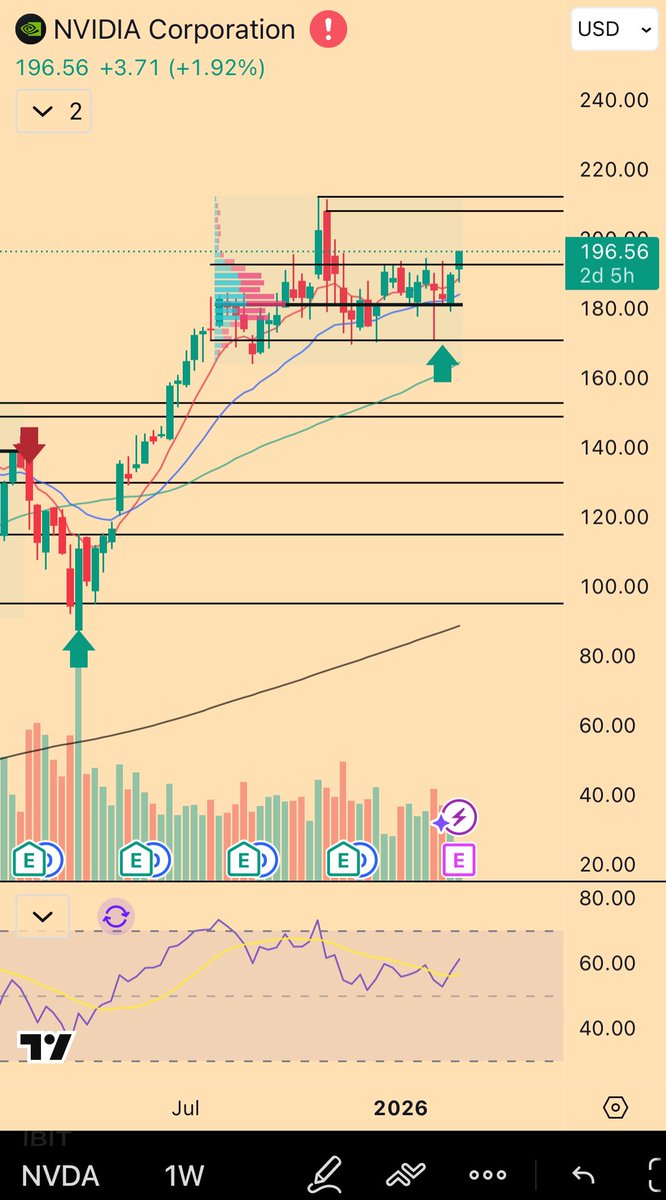
$NVDA NVDA remains interesting here. Past 6 earnings reports have all been sell the news— go back and take a look yourself. Implied move is the lowest it’s been in a while at a hair above 5%. Yet the market has never needed a big beat more than it does now. Chart is set up fairly well. Both from a USD perspective as well as on a MAGS perspective. Personally, I struggle to see how this could turn the indices around sustainably given how it seems every single earnings report has gotten sold this quarter… is a 4% earnings whisper beat really going to change all these macro forces in play? Could this rising tide really lift all boats? Just this inability to rationalize a bull case may indicate it’s the proper hedge for bearish tech positions. Though I admit the most contrarian play here is to short this thing given how well the charts are set up… but I’m not doing it for that very reason. Odds are ofc that Kenny G just makes money off all the options buyers but I’m thinking about it…
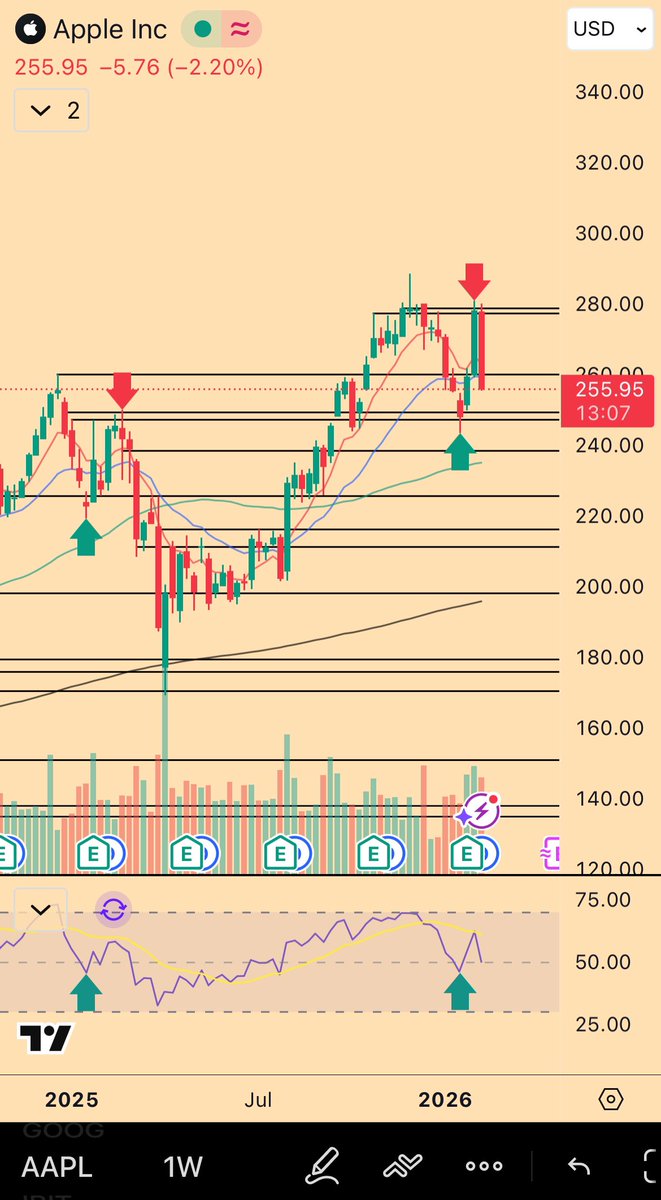
$AAPL How this chart is looking at me rn


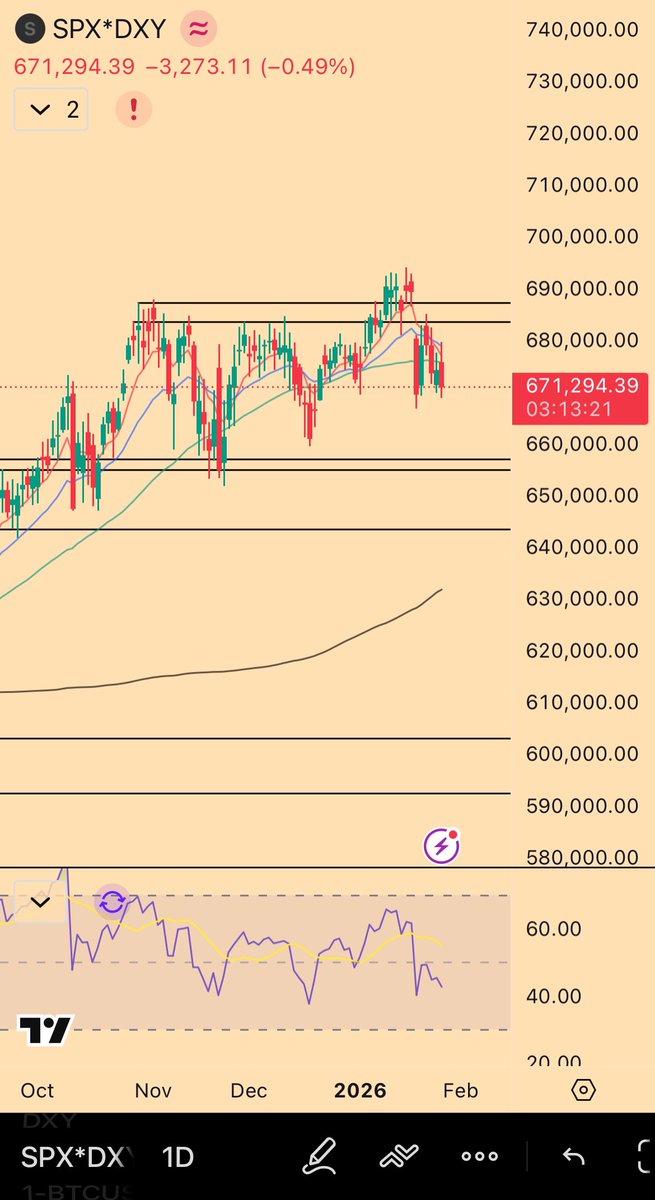
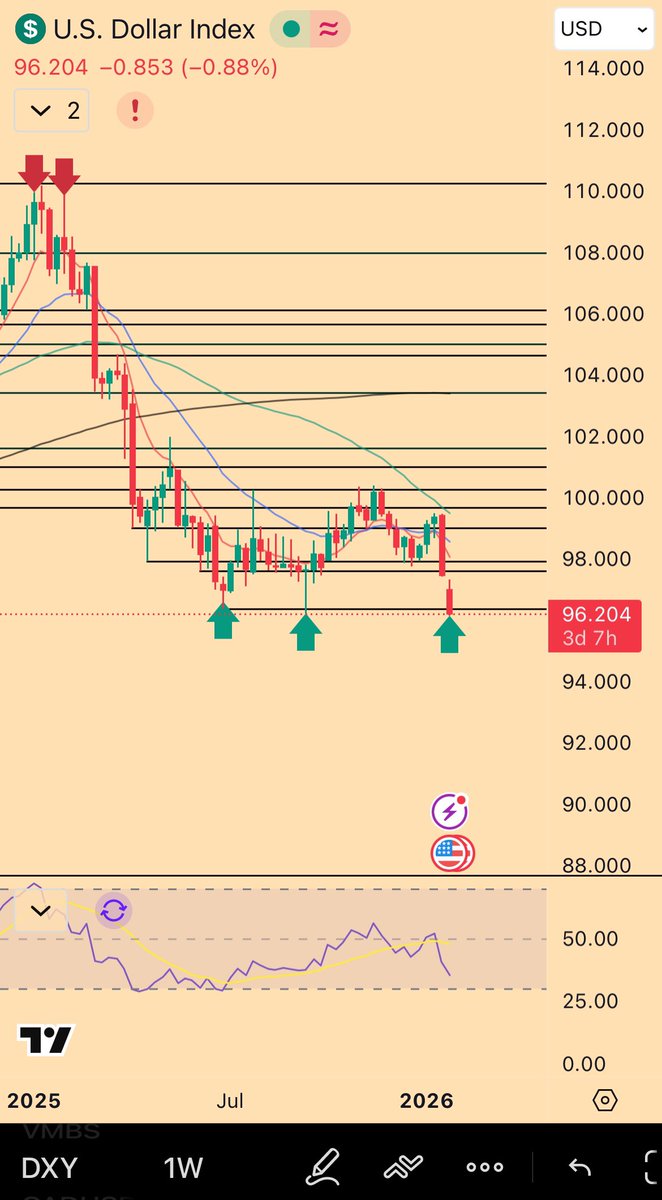

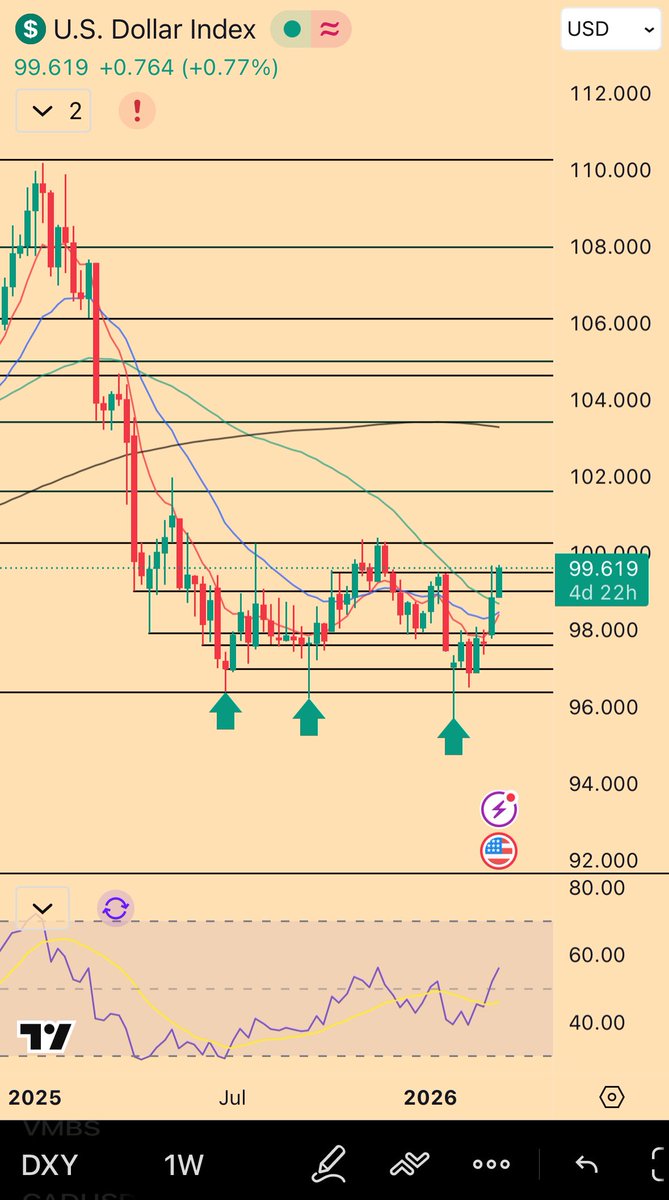
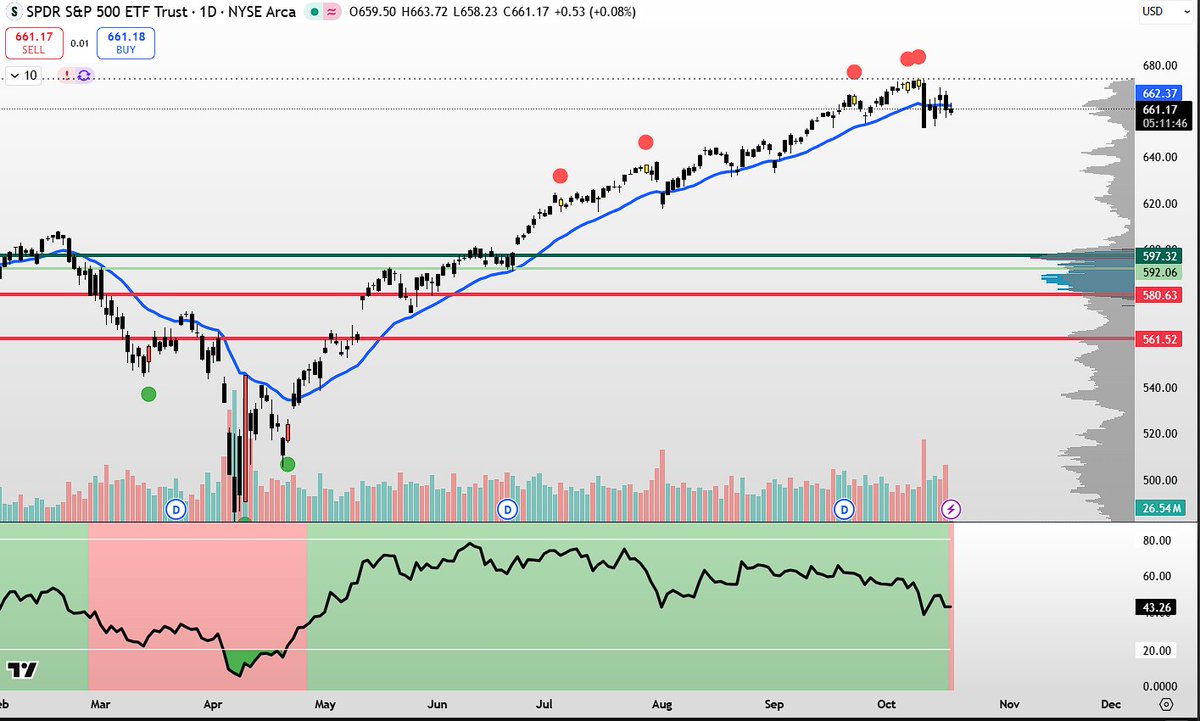
$SPX $DXY This is not a good look… The last thing a US equity bull wants to see is another leg down in the DXY. (this implies capital flows outside of the US)

GDXJ up another 5% today. Precious metals more similar to crypto than people think. As the trend goes on, you should be going down to risk curve (in this case junior miners with unhedged production that haven't pumped). When these assets sell-off, usually a signal to derisk.
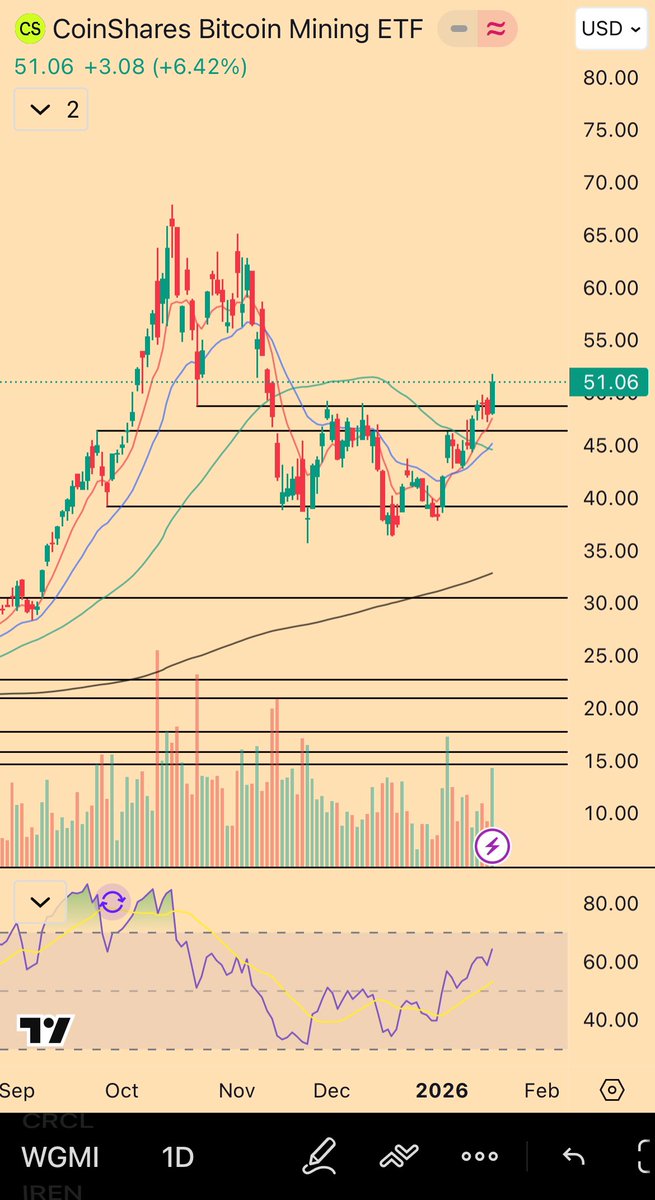

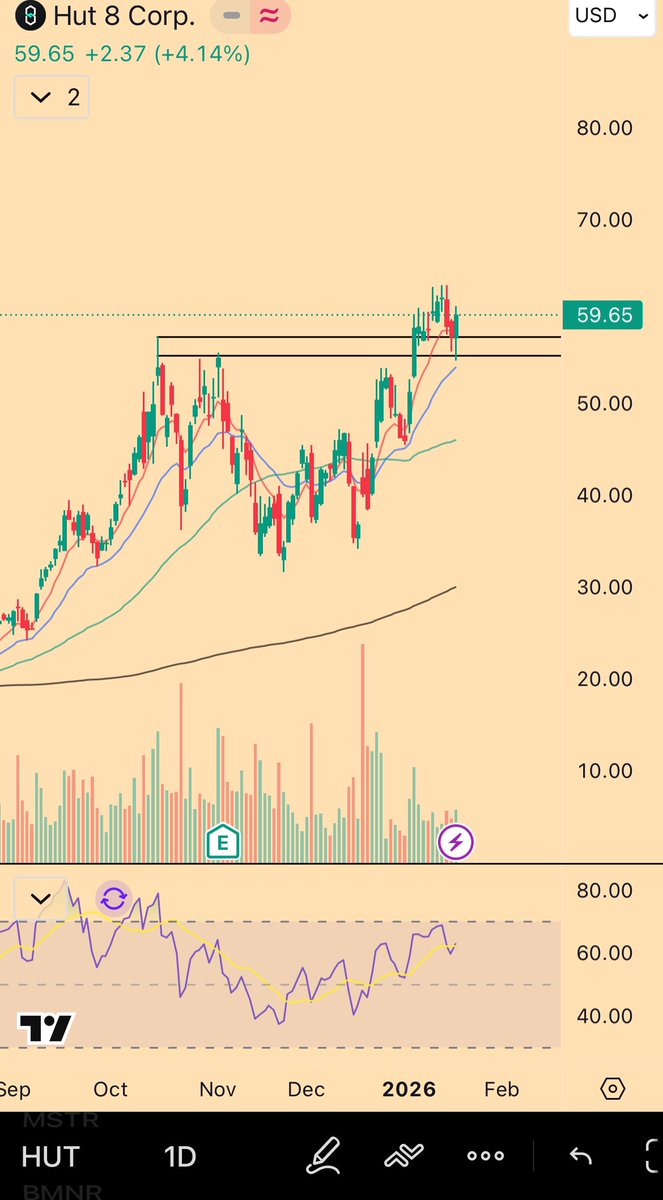
$WGMI $IREN Starting to cook… Kitchen gets hotter if we close above these levels.

$HYPE If the weekly closes green, it would lock in the first weekly bull div in history for this coin.
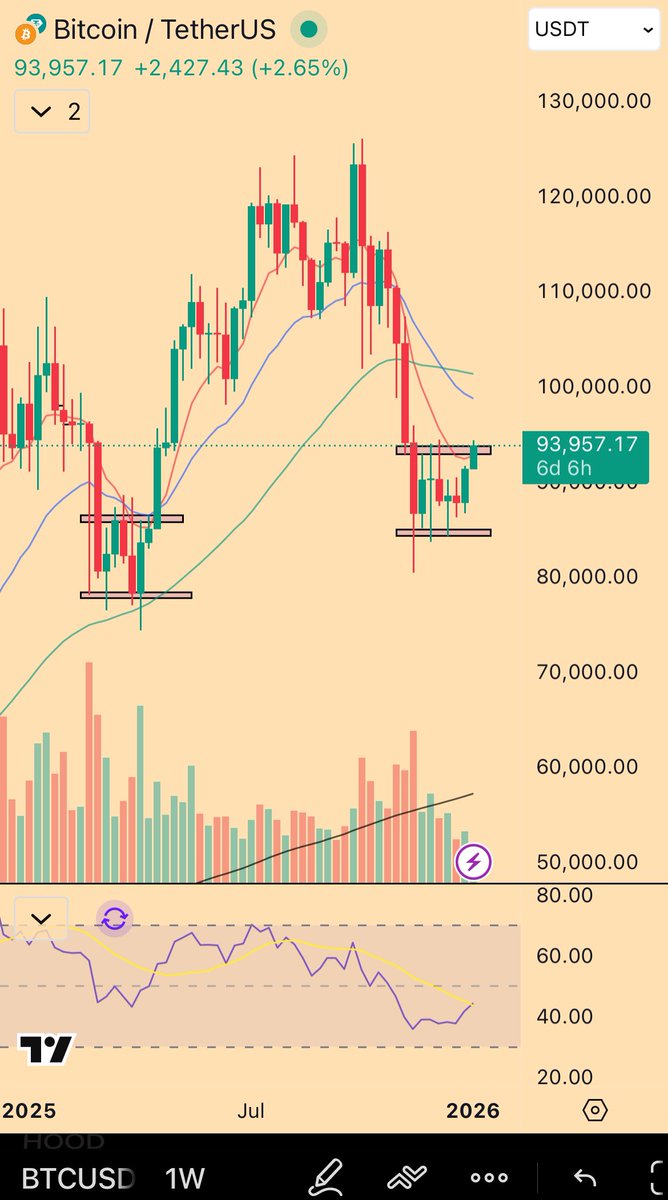
$BTC Believe this is BTC’s shot at putting in a true countertrend rally. Structure is quite similar to March/april 2025 (would ideally see successively lower wicks though, but the candles are quite similar). This would imply the weekly closes somewhere around here, and early into next week we get the final wick down to low 80s / high 70s before a hammer reversal. (I.e. one more Santa = Satan rally meme then Santa arrives right on schedule leaving those in disbelief).) That’s your take a chance moment imo. If 80 fails to hold then prepare for a second leg down (look back at 2022 action for reference).

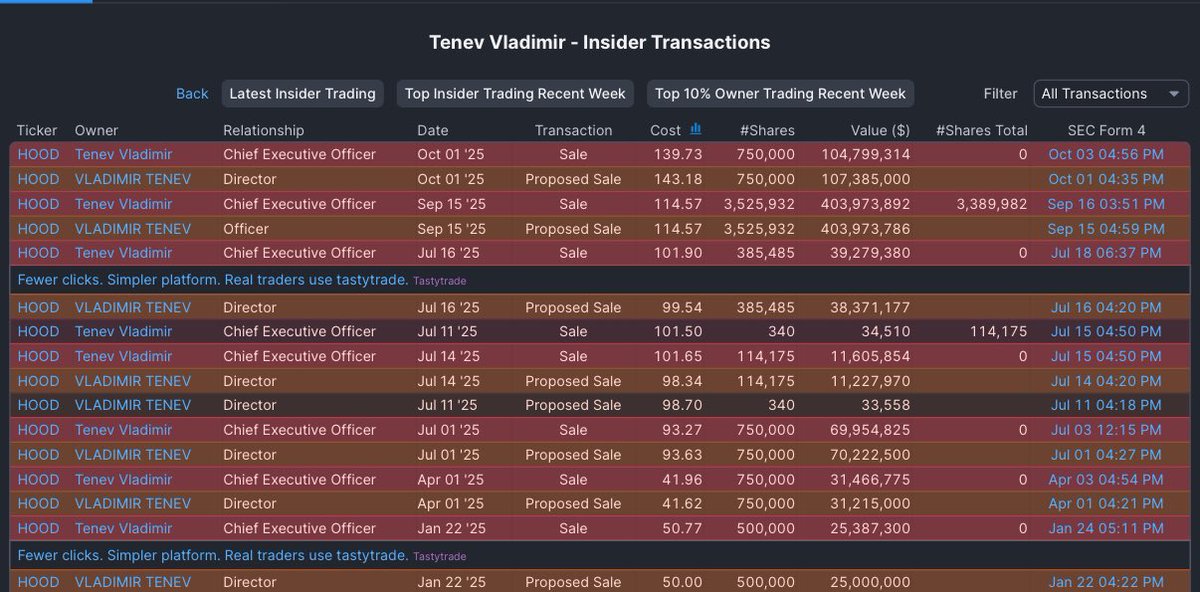

Took some HOOD puts. Its AUM is about $300~B and its market cap is $130b. If you want to bet that the economy slows down it’s the perfect play now that it is trading so close to its AUM SCHW’s AUM is $11.23T and its market cap is $176b