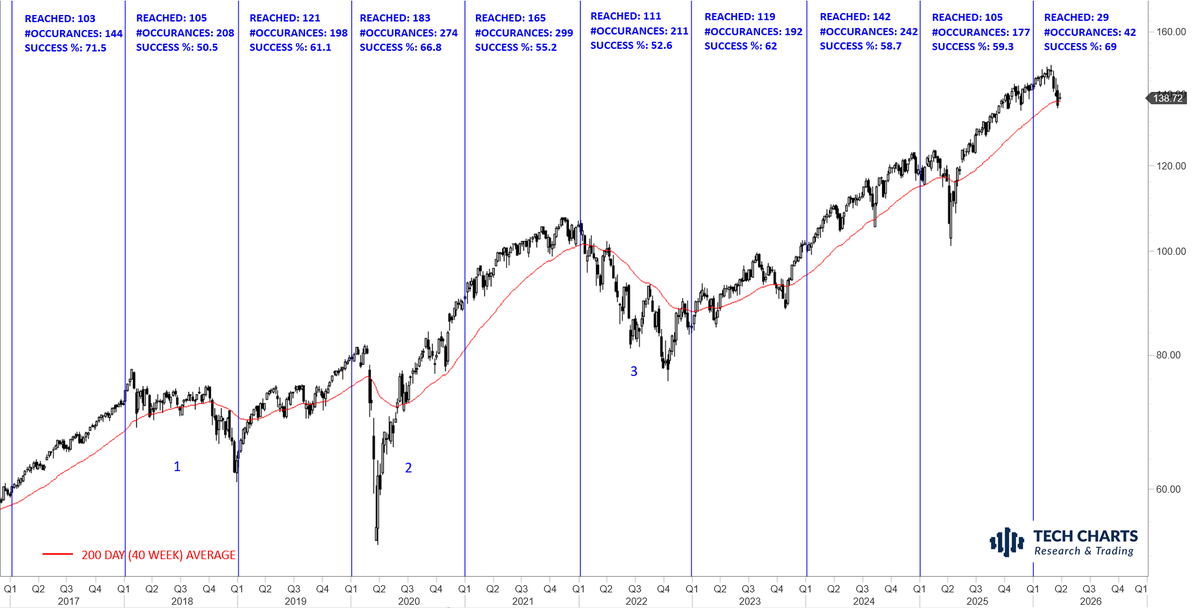
Past 10 years, there has been 3 bear markets.
2018 was choppy sideways
2020 covid related sell-off with a V reversal
2022 was a clear volatile downtrend
1&3 has been challenging in terms of trending nature of breakouts/breakdowns and resulted in weaker pattern success rates
What is waiting us in 2026 as the benchmark tests the 200-day average and can force a change in trend?
I will discuss these, YTD and historical classical chart pattern stats breakdown on Wednesday's #member#webinarblog.techcharts.net/2026/03/21/liv…
One of the things I did well this past year was getting smaller when things weren't working.
Not stopping. Not quitting. Just getting smaller. Half size. Quarter size. Tiny enough that the losses didn't matter but I was still in the game, still reading the tape, still building reps.
Small size is a superpower when you're out of sync. It keeps you engaged without letting the market do real damage. And when the rhythm comes back, and it always does, you're ready to step back in at full size with clean eyes and a full account.
Marathon runners don’t typically peak until their late 30s and early 40s.
Read that again.
You’re not too old. You’re not past your prime. If you started running at 28 or 32 or 35, you might not even be close to your ceiling yet.
Running economy improves over years not weeks. The people posting their fastest times at 40 aren’t genetic outlaws. They just didn’t quit.
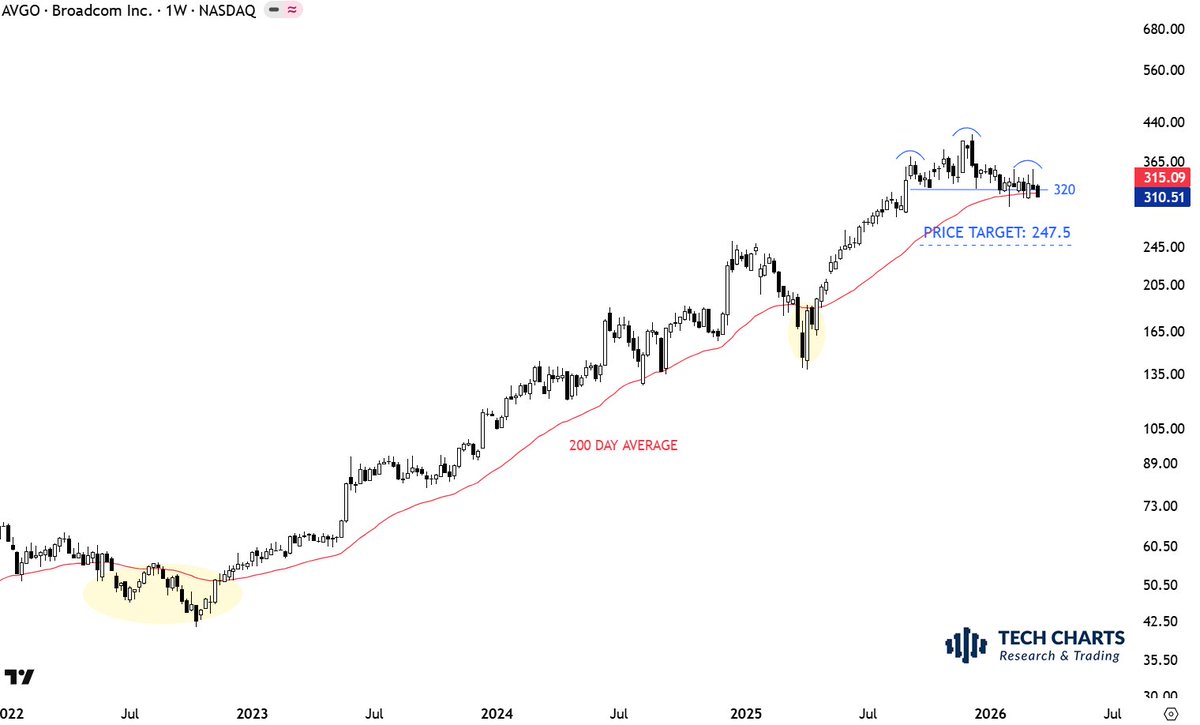
Below 200-day average, embrace for impact.
It can be a quick move with a V reversal or prolonged, several months.
When you are below the 200-dya average, it is best to take defensive action. $AVGO
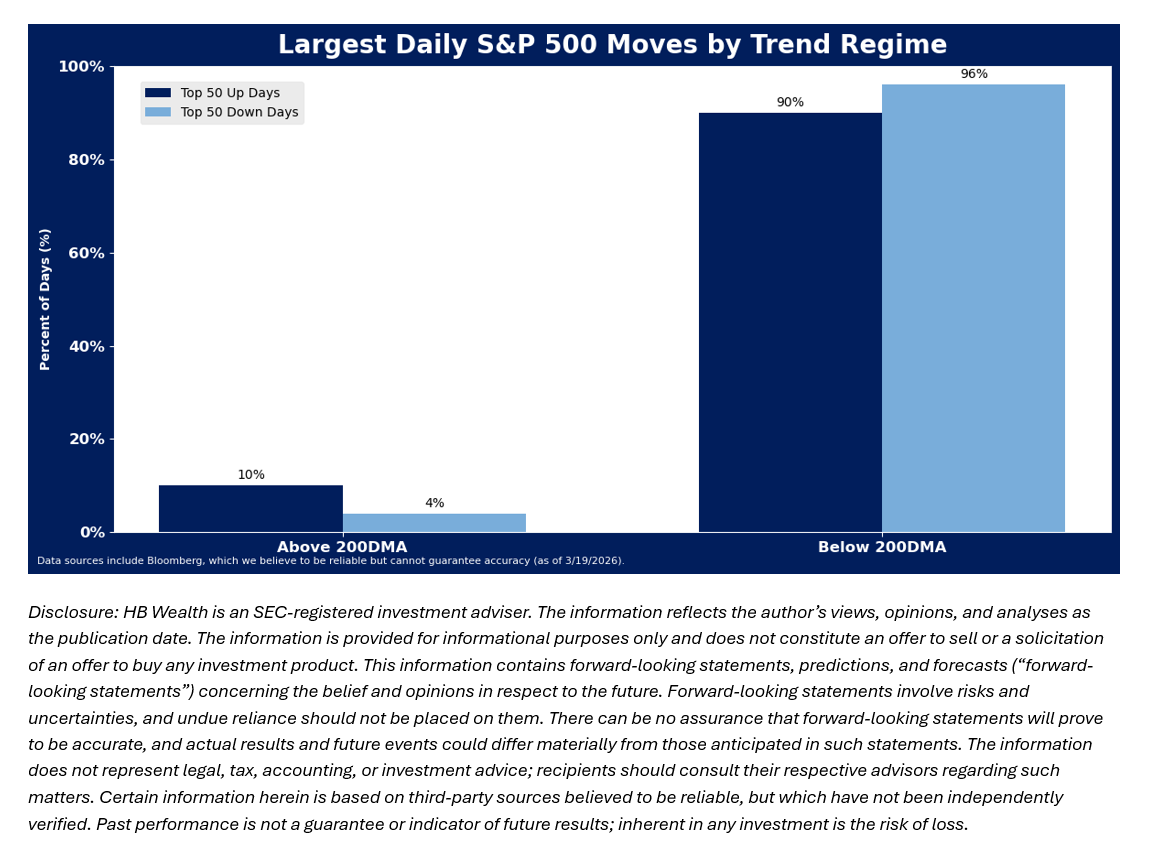
Stocks’ technicals continue to weaken, and for the first time in the post-Liberation Day bull market, U.S. large cap stocks are testing their 200-day moving average. Drops below the moving average have historically triggered more volatile trading. Extreme returns, both positive and negative, cluster during the high volatility periods beneath the 200-day moving average, as economic uncertainty dominates market price action. Since 1990, 45 of the 50 largest daily gains and 48 of the 50 worst losses occurred when the S&P 500 was trading below its 200-day moving average. The VIX averaged 16.9 when the market was above the moving average, but surged to average 27.2 when the index was below the moving average.
the selling has slowed, the markets are oversold, sentiment has turned quite bearish, fear is running high... let's watch for opening selling to turn into buying as a bottom forms...
notice i said "a bottom", not "the bottom", the latter of which won't be evident until after the fact...
The red line is the 200-day exponential moving average. I don't use it as a signaling tool. It is a filtering tool for me.
Meaning: when price is below the 200-day average, I take more short setups thinking that we are in a downtrend and breakdowns are more likely to succeed. #SPX
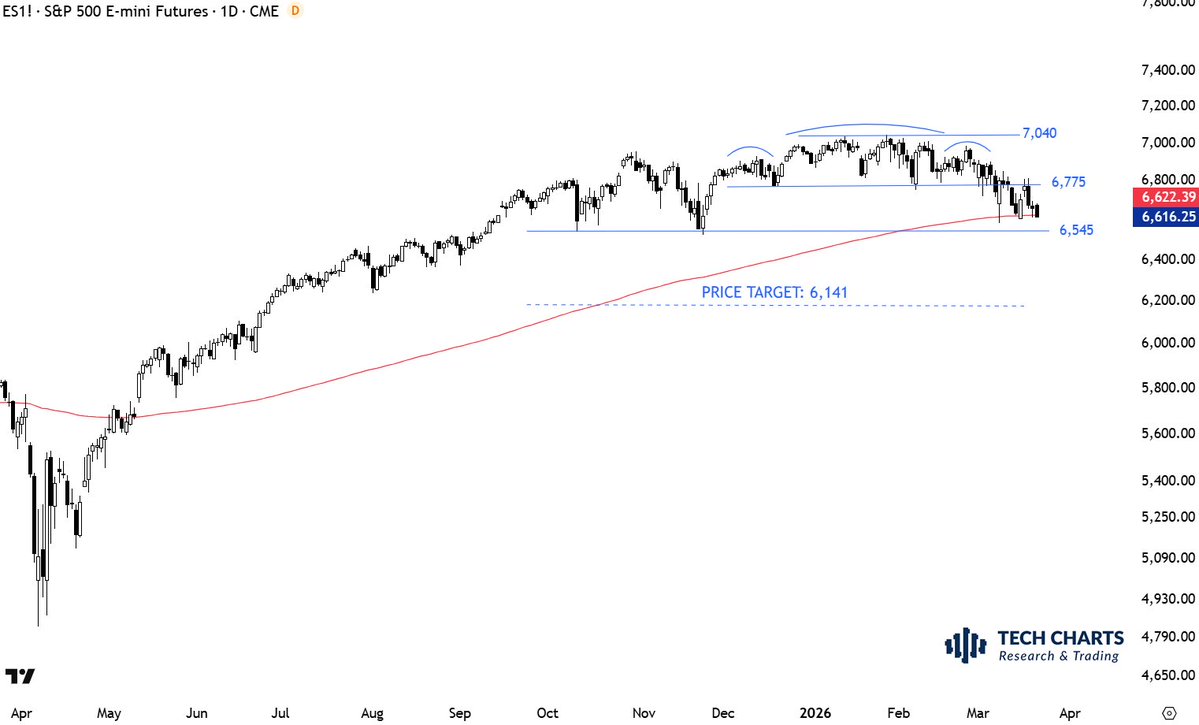
Will look closer later, but this might be the first time in a while the S&P 500 gapped under its 200-day MA without having previously breached it even intraday in the prior months. Interesting.
Looking back on both my professional life and trading journey, my biggest spurts of growth have always started with a painful realization
- acceptance that I simply wasn’t good enough
- acceptance that you can give something everything for months or years and still have little to show for it
- acceptance that progress is nonlinear and often invisible in the moment
Those moments felt like failure in the moment. But in hindsight, they were inflection points, and the start of the next phase of growth.
I can remember each of those moments like it was yesterday. These are the moments that build character. These are the moments that make you who you are. Learn to embrace them.
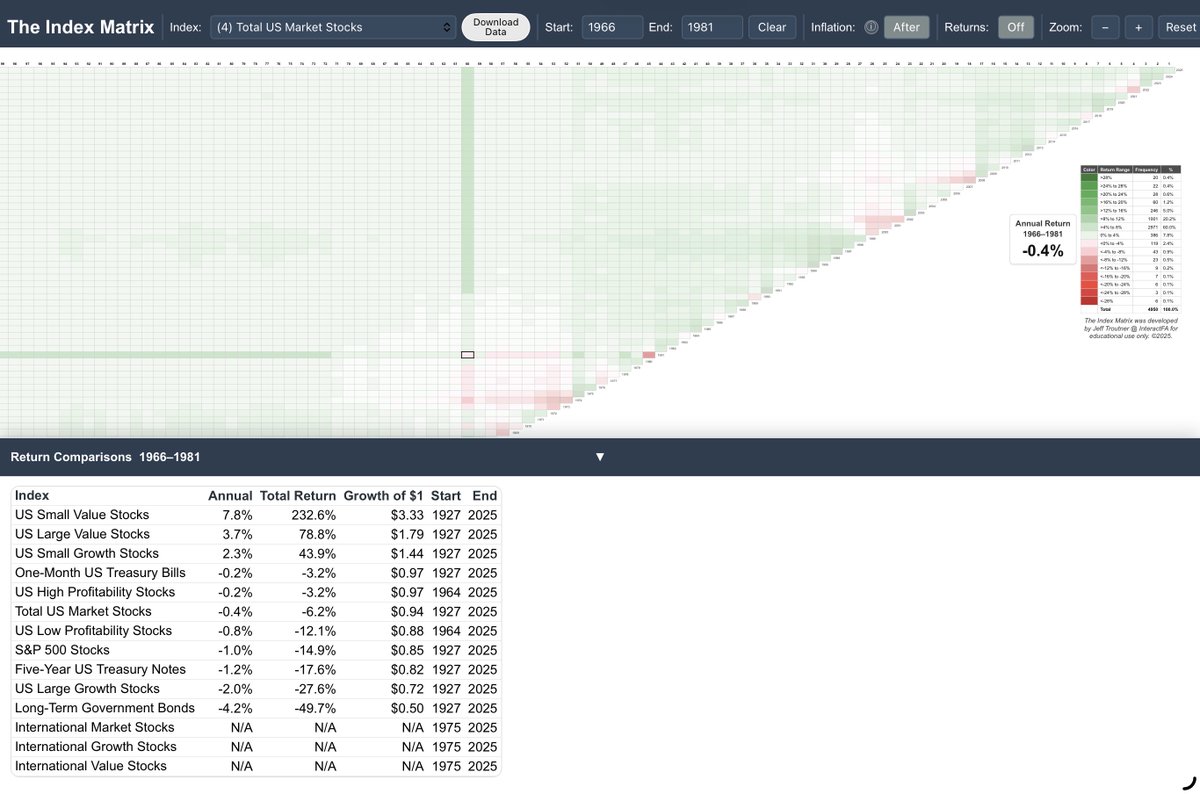
The scariest thing about investing isn’t bear markets.
It’s “lost decades.”
For the 16yrs thru 1981 and the 13yrs thru 2012, the US stock market had no real returns. Cumulative, including dividends. Thats an average of almost a decade and a half.
A portfolio can survive a bad year or two. Not a bad decade or two.
Fortunately the answer is simple: Small Cap Value.
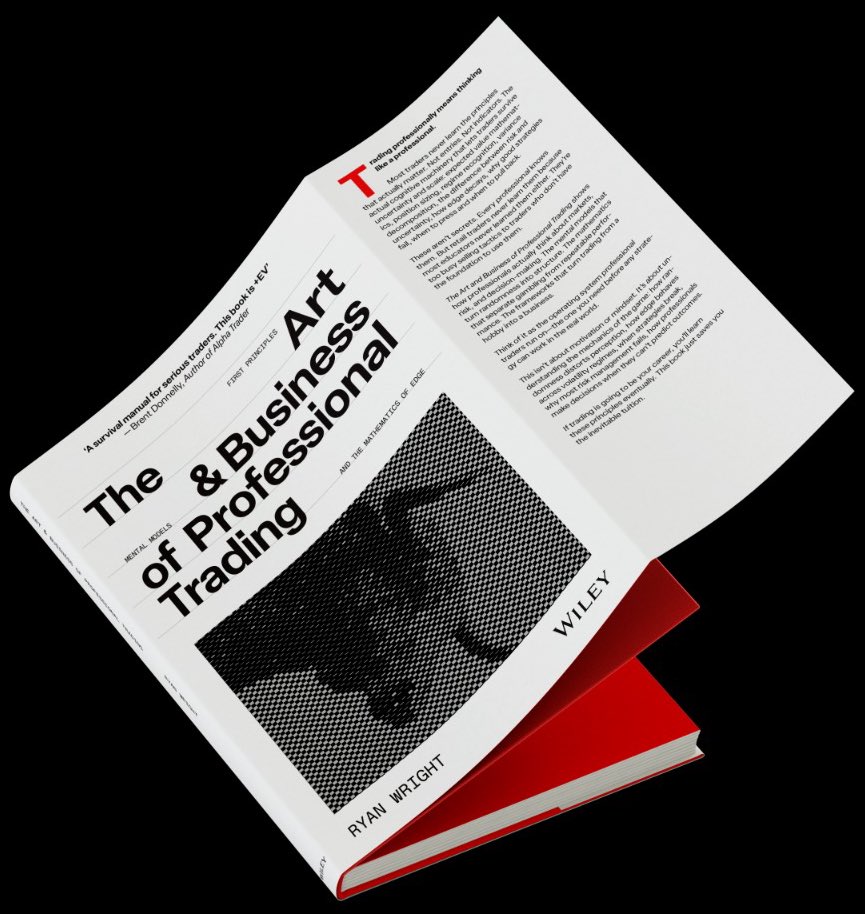
My book went to print today. The Art and Business of Professional Trading (Wiley).
It's not a setup guide. No buy signals, no take profit levels, no "10 rules for consistent profits." It's more like... here's a bunch of stuff we think about at the professional level that nobody really talks about publicly. Psychology, process, how edges actually work, why most people blow up, what the survivors do differently.
People who've read it early seem to like it. If you're into Alpha Trader, Fooled by Randomness, The Laws of Trading, this is in that family.
In bookstores April 30. You can preorder through Wiley or find it on Amazon, wherever you buy books. Link below.
A 2-hour marathon = a 4:35 mile… 26 times in a row. 🤯
I jumped on the treadmill to compare:
⏱️ 2-Hour Marathon: 4:35/mile (13.1 MPH)
⏱️ 3-Hour Marathon: 6:52/mile (8.7 MPH)
⏱️ 4-Hour Marathon: 9:10/mile (6.6 MPH)
⏱️ 5-Hour Marathon: 11:27/mile (5.2 MPH)
The change in running mechanics is wild.