@james_xond When people started spending all their time on apps like this and only reading bad news.
English
Mike Lucyk
3.6K posts
@mlucyk
Back-up Orioles shortstop 1982-1998.


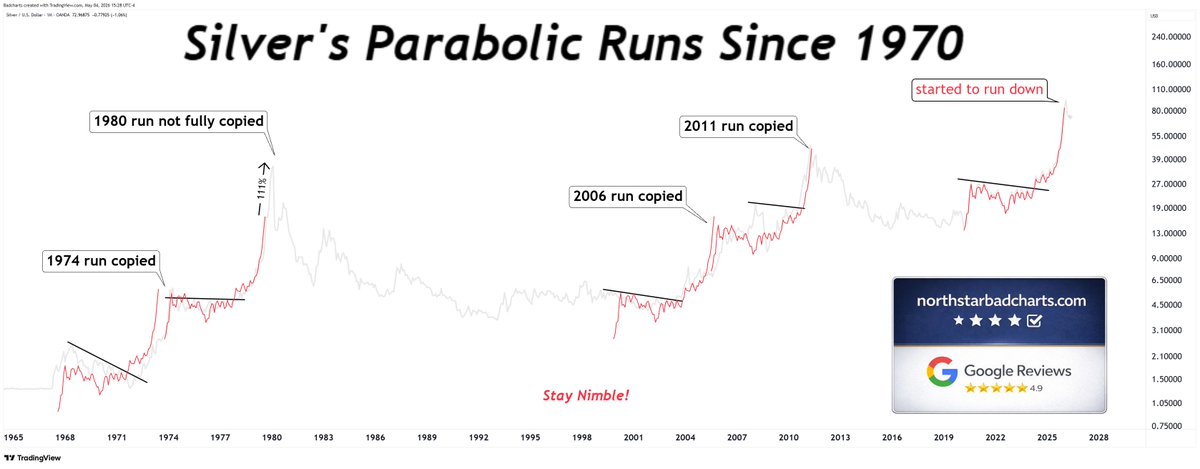


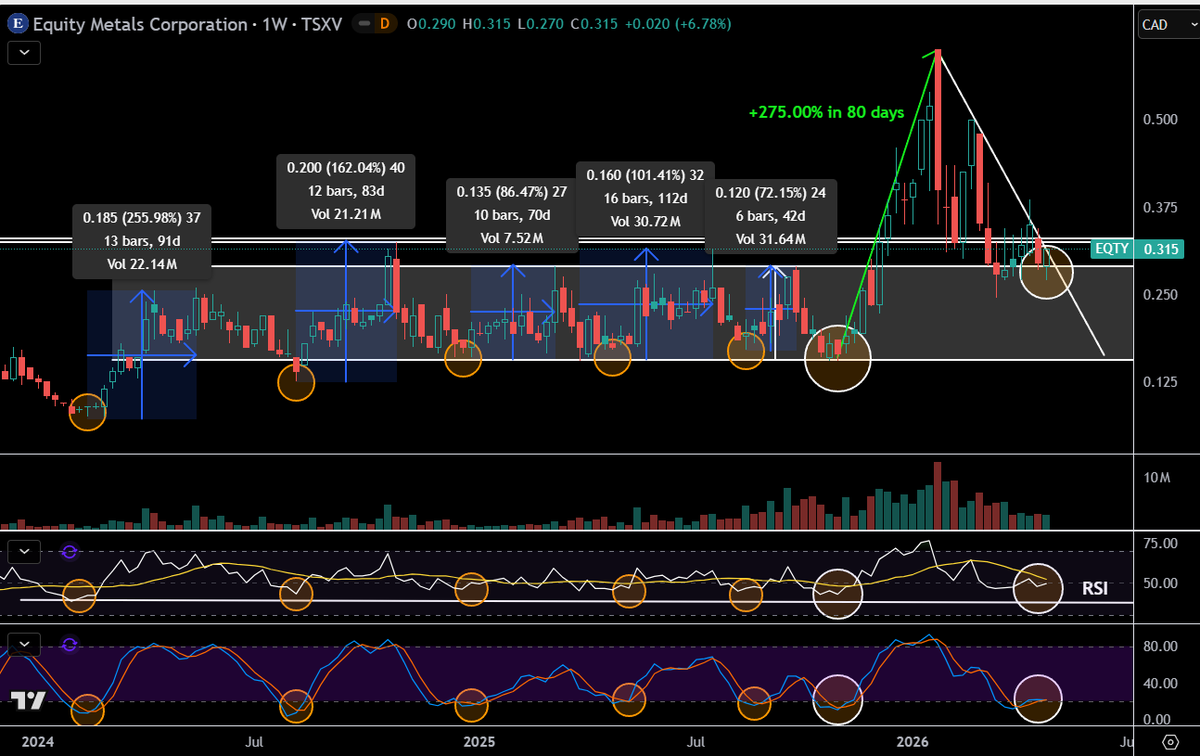
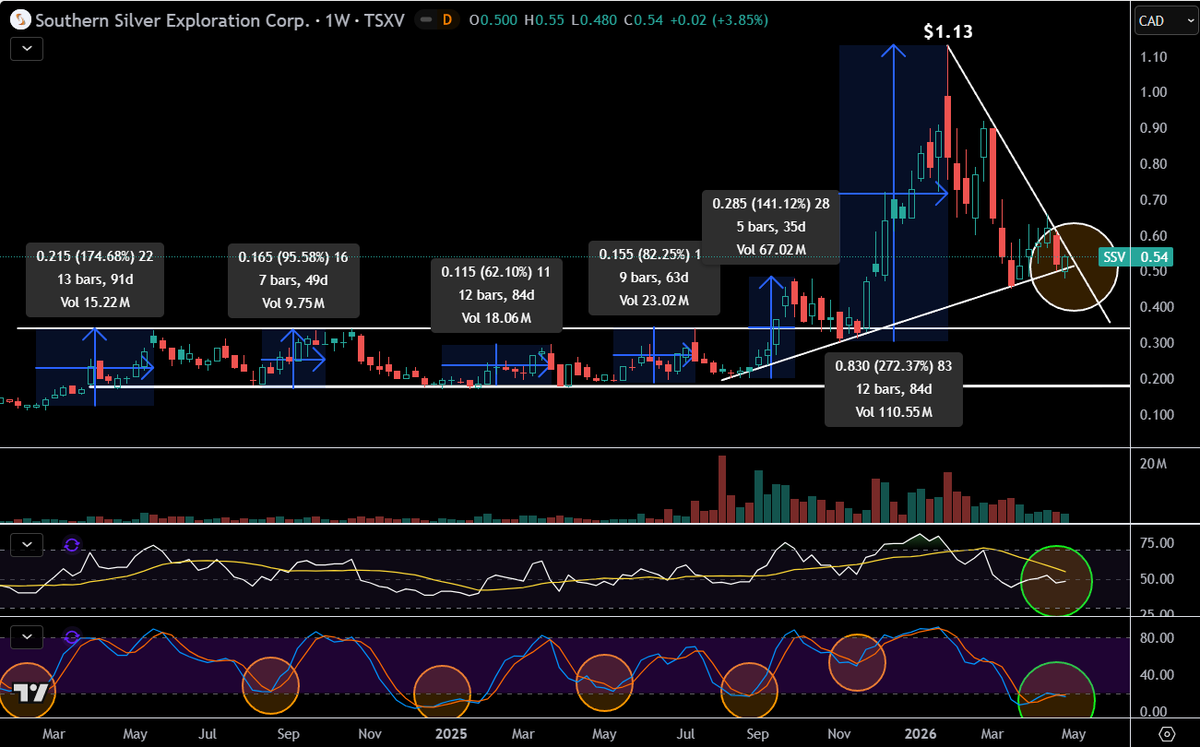
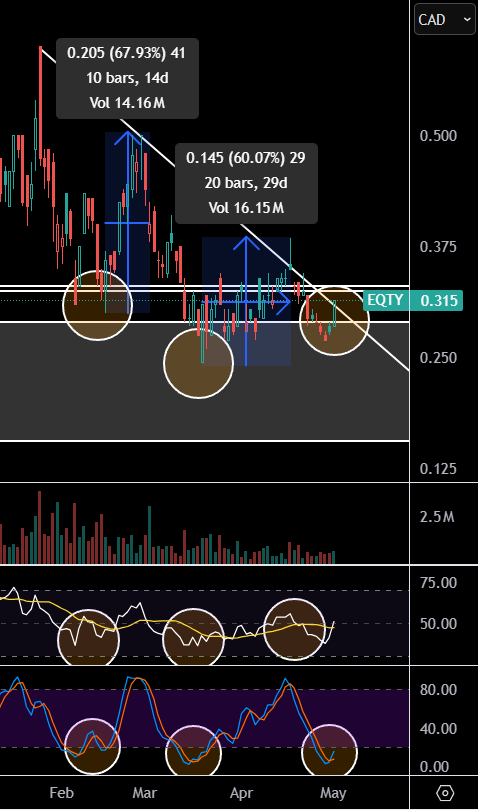
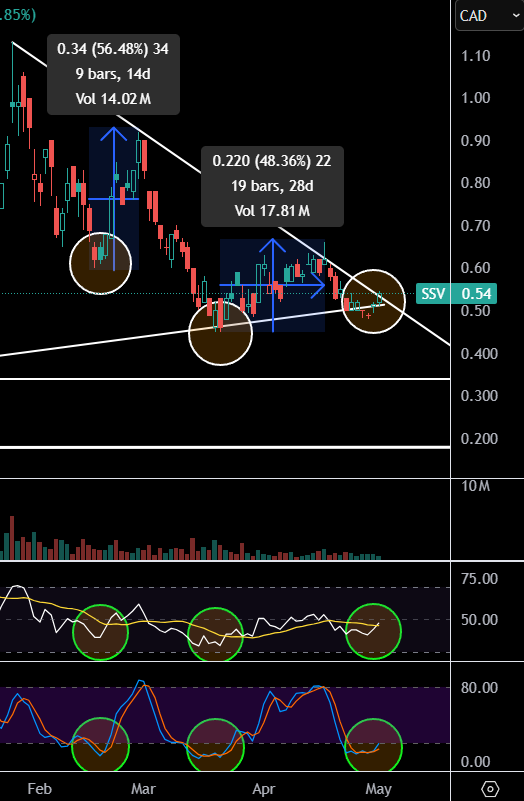
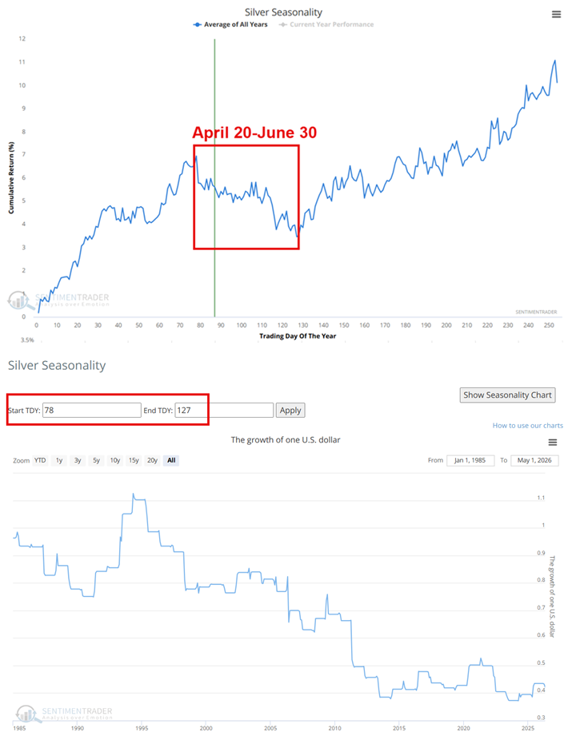
The majority looks fantastic to me. Combine that with the weekly view, where indicators are at rock bottom and a new weekly cycle is about to start, and it suggests significant upside ahead. Here are some examples: Chart #1: $EQTY.v - Equity Metals Corp This pattern and indicator have been 100% accurate since the #Silver move began in February 2024. +255.98% in 91 days +162.04% in 83 days +86.47% in 70 days +101.41% in 112 days +72.15% in 42 days +275.00% in 80 days Average gain: +158.84% Average time: 79.7 days The stock is on the verge of breaking its downtrend line aswell as dropping a long awaited updated MRE that should serve as extra fundamental fuel for upside. As they most likely have grown their resource with 100% since the last MRE. Easy buy right now, and looks great on the chart. ------------------------------------------------------- Chart #2: $SSV.v - Southern Silver Epxloration This pattern and indicator have aswell been 100% accurate since the #Silver move began in February 2024. +174.68% in 91 days +95.58% in 49 days +62.10% in 84 days +82.25% in 63 days +141.12% in 35 days +272.37% in 84 days Average gain: +138.02% Average time: 67.7 days The stock is just as EQTY on the verge of breaking out from its downtrend here. Which it will most likely next week already, if USA aint attacking Iran. Fantstic entry level and a fantastic company. One of the top 10 best silver projects globally. SSV is a no-brainer buy here and doesnt look terrible on the chart and both the daily and weekly indicators are at rock bottom and load up zones for #EASY #MONEY. ----------------------------------------------------- Chart #3 and Chart #4 shows their daily zoomed in. Note: Basically all my miners look similar on the charts and with the indicators. And both the daily and the weekly indicators tells more about direction than any lines drawn do. (IMO) The pattern speaks for itself. The only thing that can stop the #miners from going higher here are a restart of the #Iran war. Sadly, if the #Iran situation starts again, the chart gurus who been bearish will come out and brag they called it and that it was easy to spot in the charts... In reality they have just been "saved by the bell". PS: Im not refering to you here @badcharts1 - And a sidenote to followers: Patrick Karim is a legend in the mining sector and been a big voice and contribution to our community for many years together with @NorthstarCharts. (So im not bashing here!) Repost if you own $EQTY and $SSV, they are super good buys around current levels, and any further weakness should be considered a gift.

Many gold and silver miners charts look TERRIBLE on the daily time frame.


$SAM.to - Starcore international Haywood had a hidden sell at $0.69 that just got blown out with a fast 1.5x daily average volume. Good buy for the day still. Great fundamental company aswell, @Silver__Santa told me 2-3 months ago that SAM was better then AGMR, I don't think so ;), but a good buy nevertheless 😜 See you #HIGHER coming 2-3 weeks