English
Edmundo Ponce
1.6K posts


California is trying to pass a bill that would criminalize investigative journalism with misdemeanors, $10,000 fines, imprisonment, and content takedown. The proposed bill is titled AB 2624 and was made after I exposed mass fraud by immigrant groups in America. Under AB 2624, government-funded entities like the Somali “Learing” Daycare centers would be protected from being exposed if they operated inside California. The enemy truly is within. When our politicians would rather protect fraudsters and illegal migrants, it’s time for us to stand up or face mass oppression from the traitors who “rule” over us.


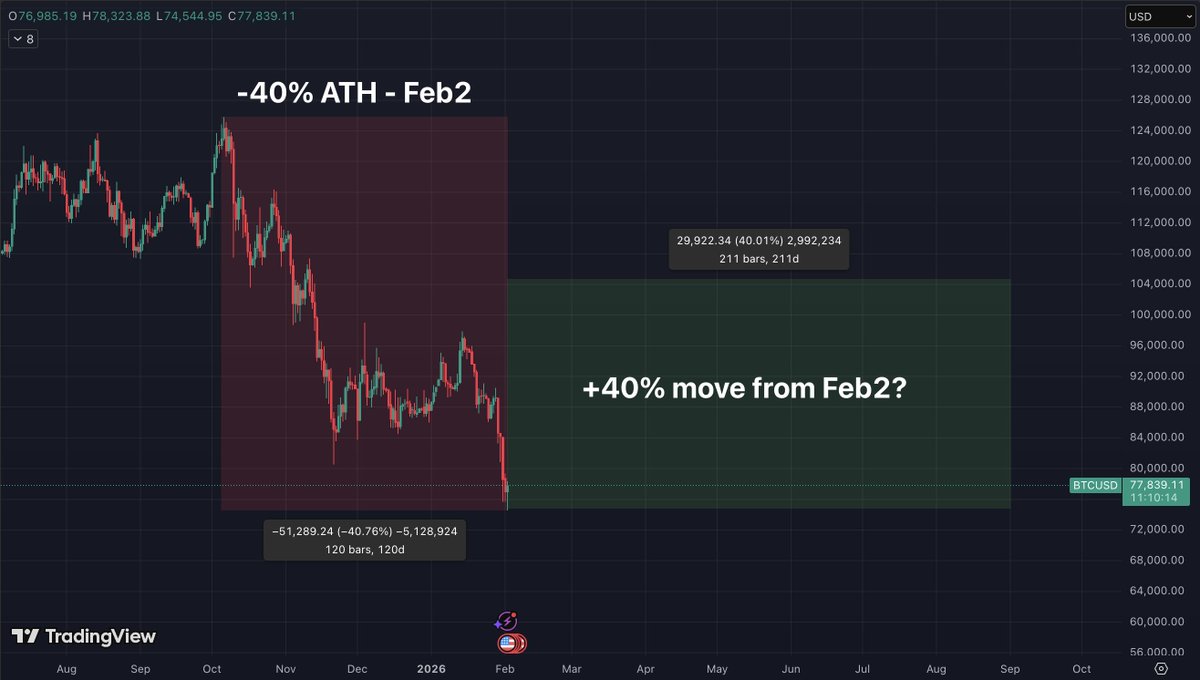
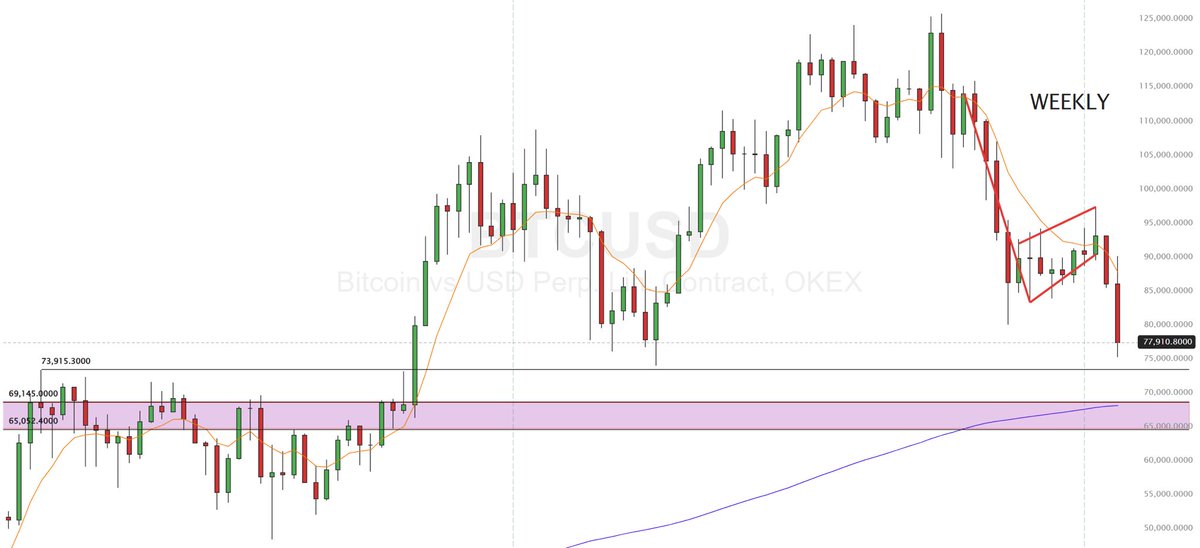
Update: This is the biggest update I have ever made but I hope I made it clear with good logic so you wouldn't get bored and lost. It took me a lot of weeks to do it and I hope you enjoy it. It's raw TA presenting the data and my expectations for the market in the next few months. This update, I will combine price and time on the chart to show you the data and to plan for the more likely scenario in the coming months. PS: Dates can have variations of multiple days maybe even weeks especially on the Higher time frames. 1st analysis: The Yearly Cycle: I am gonna start with the biggest cycle which is the yearly. You can see how we are in extreme risk before the next pivot around 2nd of February. That phase got left translated with distributive PA when I outlined this back in the beginning of October. Historically if we look into the previous cycle, we can see almost the same fractal/pattern, we had a -50% on dump before that same pivot on the same harmonic. That pivot led to a +40% swing so a dead cat bounce and didn't lead to a new ATH. PS: Another period of risk would be between April 2026 and September 2026. Based on this Yearly cycle, we can extract the data that BTC can dump around 50% from the ATH until the next pivot around 2 February for a +40% move. 2nd Analysis: The monthly cycle: This cycle points to a pivot around 22 December. The severity of the dump and pump is determined by the context. How bullish/bearish the context is. As per data, into these monthly pivots, you normally see the biggest crashes because those harmonics are pivotal forces that attract price into that time period and the biggest pumps depending on how bullish the context is (4year cycle timing). For the dumps into those monthly pivots, we have: -56%, -77% and -34%. (-56% was late in the cycle and -77% was bear market time. -34% was shallow because it's during the middle of the bull market). For the pumps: 140%, 375% and 158% (also depends where we are in the cycle) Based on the Monthly cycle, we can extract the data that BTC can dump between 34% and 77% from the ATH until the next pivot around 22 December. 3rd Analysis: The weekly cycle: This cycle points to a pivot around 19 November. The severity of the dump and pump is determined by the context. How bullish/bearish the context is. As per data, into these weekly pivots, you normally see big crashes because those harmonics are pivotal forces that attract price into that time period and big pumps depending on how bullish the context is (4year cycle timing). For the dumps into those weekly pivots, we have: -20%, -20%, -34% and -32%. (shallow pull backs, we were still in a good bull market environment). For the pumps: 99%, 96%, 95%, 127% and 69% (The latest expansion/swing from the pivot is the weakest, it makes sense because we are getting late into the cycle). Based on the Weekly Cycle, we can extract the data that BTC can dump between -20% and -34% from the ATH until the next pivot around 19 November. Conclusion: If we combine all 3 analysis, we can conclude that BTC can dump anywhere between -20% and -77% by next pivot between 19 November and 2 February. This is too wide, we can refine better: -> For price: It's when all the harmonics sync up together we get the biggest crashes and pivots (like a magnet). The bigger harmonics carry much more weight, so it would be ridiculous if BTC only dumps 20 to 34%. Logically it should be more than that but smaller than 77% because we aren't in deep bear market yet as per the yearly cycle. So logically, the dump could be anywhere between 34% and 55%. -> For time: It's when all the harmonics sync up together we get the biggest crashes and pivots (like a magnet). The bigger harmonics carry much more weight, so 19 November is too early for the pivot to be set when you have monthly and yearly pushing it into late December or even early February. So logically, we should get the pivot somewhere in January give or take. Based on this and the key levels I have shared on BTC (89K (locally), 72k, 45k and 28k (72k, 44k and 28k being HTF optimal levels)): 1) 90k (-30%) in January 2) 72k (-43%) in January PS: The late November weekly pivot can deliver a dead cat bounce before finding the real bottom in January. Imo, 90k can come in November and 72k in January. Also, will BTC do a new ATH during the next pivot? Based on the first analysis, last cycle, that same harmonic delivered a 40% move on BTC without a new ATH. Imo not enough data to conclude if BTC can be able to do a new ATH before the period of risk (between May2026-September2026). For now the data and probability suggests not.