
" $TOYO is a US-onshoring solar manufacturer with a Houston facility worth more than the entire current valuation " - @BabyBaconFat
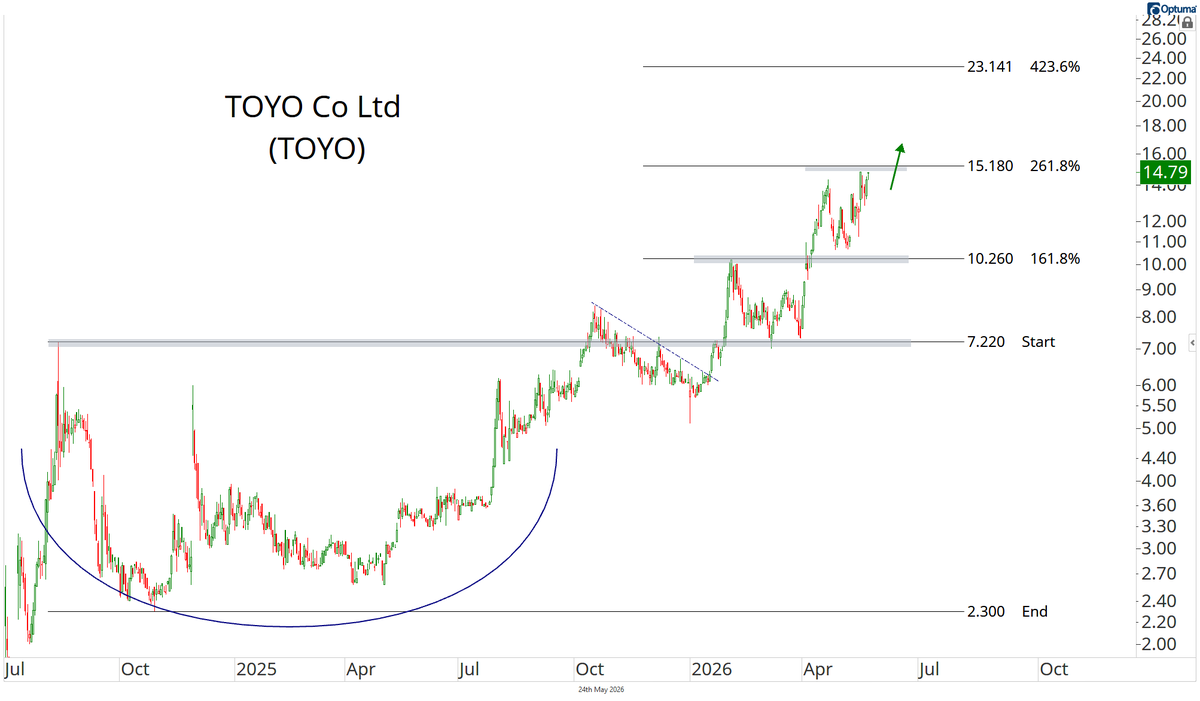
I see a micro-cap solar name emerging from deep base printing a clean series of higher highs and higher lows.
Textbook bullish structure. Above $15, risk favors the bulls.
Gabriel@BabyBaconFat
I am long $TOYO. I argue it is easily worth $2B just on it's Houston facility and section 45X credits. It makes $80M in annual tax credits today on a $558M mkt cap, and the market isn't pricing any growth. Check out my in depth analysis below: open.substack.com/pub/gabrielcor…
English