
Omar Mohammed
254 posts

Omar Mohammed
@omohammed90
Hardware Applications Engineer
San Francisco, CA Katılım Şubat 2012
158 Takip Edilen106 Takipçiler

$AMZN Double Beat, -1.55% 🟥
$MSFT Double Beat, -1.73% 🟥
$GOOG Double Beat, +3.89% 🟩
$META Double Beat, -5.57% 🟥
Just brutal 🩸
English
@MarketMike I don’t know what I’m missing or maybe I’m just too stupid to realize how truly dense I am but I’m in the discord, watch the videos etc and still am unable to get like you
English

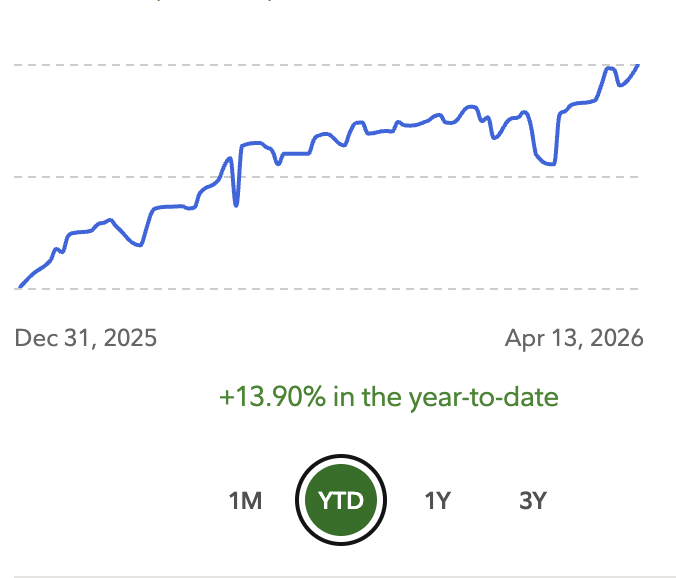
My PnL curve has really smoothed out over the last year. That's not a coincidence.
I stopped trying to be good at every market and started paying attention to when my strategy actually worked. What conditions it thrived in. What conditions chewed it up.
Once I had a clear way to read the regime, the rest got simple. I knew when to lower exposure, when to push it, and which strategies to lean on in each environment.
That was one of the biggest breakthroughs I've had as a trader. It's what keeps me in my lane and out of trouble when the market shifts.
English
This dumbass doesn’t realize the divergence I’m talking about is still there.
LOLOL
Caleb Franzen@CalebFranzen
@MarketMike Hey rookie, adjust $HYG for the dividend distribution. Otherwise your "analysis" is 100% pointless. You're welcome.
English
@alphaticaio Damn I had to learn this the hard way through years of observation. The new guys have it so much better
English

"Only 7 stocks are carrying the market. That's unhealthy. We're due for a correction."
Half of FinTwit has posted some version of this in the last two weeks.
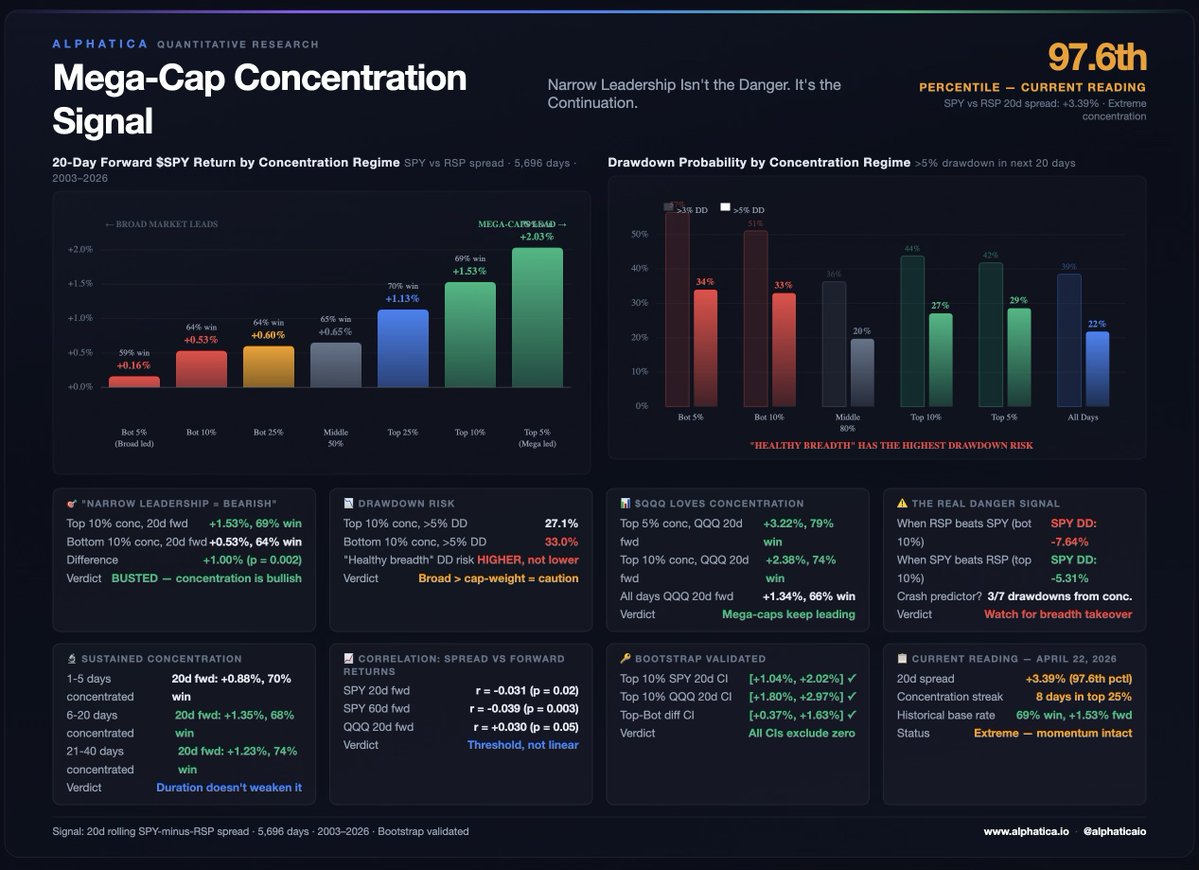
22 years. 5,696 trading days. $SPY vs $RSP (equal-weight S&P 500). We measured the 20-day rolling spread between cap-weighted and equal-weighted returns, the concentration signal. When SPY outperforms RSP, mega-caps are leading. When RSP outperforms SPY, the broad market is leading.
When mega-caps lead (top 10% concentration), $SPY 20-day forward returns are +1.53% with a 69% win rate. When the broad market leads (bottom 10%), it's +0.53% with a 64% win rate. The difference is +1.00% with a p-value of 0.002. Bootstrap confidence interval excludes zero.
Narrow leadership isn't bearish. It's nearly triple the forward return of "healthy breadth."
$QQQ loves concentration even more. Top 5% concentration, QQQ 20-day forward: +3.22%, 79% win rate. When mega-caps lead, they keep leading.
The drawdown data flips the narrative entirely. Probability of a >5% drawdown in the next 20 days when mega-caps lead (top 10%): 27%. When the broad market leads (bottom 10%): 33%. The "healthy breadth" regime has HIGHER drawdown risk. When equal-weight starts beating cap-weight, it often means mega-caps are rolling over and they drag the index down next.
Sustained concentration doesn't weaken the signal. After 21-40 consecutive days of mega-cap leadership, 20-day forward returns are +1.23% with a 74% win rate. Duration makes it stronger, not weaker.
Is concentration a crash predictor? Only 3 of 7 major drawdowns (>10%) since 2003 started from a concentrated reading. The other 4 started from normal or broad-led regimes. Concentration alone doesn't predict crashes. What predicts trouble is when concentration BREAKS meaning when mega-caps stop leading and the spread rolls over.
Current reading: the SPY vs RSP 20-day spread is +3.39%, the 97.6th percentile. This is extreme concentration. FinTwit is calling it a warning sign. The data says it's the strongest forward return regime in the dataset.
The actionable framework:
When SPY is outperforming RSP (concentration rising): stay long, favor $QQQ and mega-cap exposure. The momentum is self-reinforcing. 69% win rate at 20 days.
When the spread is above the 90th percentile: lean into it. The top 10% regime has the best forward returns and the lowest short-term drawdown risk in the dataset.
The warning sign to watch for: when the spread REVERSES meaning when RSP starts outperforming SPY after a period of extreme concentration. That's when mega-cap leadership breaks, and historically that transition carries the highest drawdown risk. We'll flag it when it happens.
The danger signal isn't narrow leadership. It's when narrow leadership stops.
$SPY $QQQ $RSP $NVDA $MSFT $AAPL $GOOGL $META $AMZN
English
@alphaticaio Semiconductor etf - has been only going up. Probability wise I think I’ve seen it’s the first time we’ve had this many Green Day’s in a row? I could be wrong; but I have to say we are definitely in a low probability zone right now. Price needs to reverse back to $700 spy
English
The JPM collar call strike is 6865. SPX is 7160; 4.3% above it!
Our research showed the call strike gets breached 68% of the time. A control test at the same distance from spot breaches 71%. The difference: p = 0.84. Statistically identical to a random number.
SPX didn't care about 6865. It never does. The collar is not a wall. It's a random number with a narrative attached to it. $SPX $SPY $QQQ
Alphatica@alphaticaio
"No clean break happens. Price gets pinned, rejected, and forced to retrace." That's the narrative around the JPM collar call strike. Here's what actually happens. The call strike gets blown through 68% of the time. 17 out of 25 quarters, SPX traded above the call strike. When it breached, it went an average of 212 points above and stayed there for an average of 30 trading days. This is one of the most confidently stated and empirically wrong narratives on FinTwit. The worst misses: Q2 2020: call at 2775 → SPX hit 3234. +459 points above. 55 days above. Q4 2021: call at 4450 → SPX hit 4790. +340 points above. 54 days above. Q3 2020: call at 3230 → SPX hit 3588. +358 points above. 48 days above. The "pinning" effect people obsess over? It happened 3 times in 25 quarters. 12%. That's not a pattern — that's coincidence. "But the gamma flows create resistance." We tested daily returns when SPX was within 2% of the call strike vs when it was far away. No deceleration. Permutation p = 0.64. Nothing. Then we ran the real test. We simulated 10,000 random levels placed at the same % out of the money as the collar. A random number gets breached 71% of the time. The collar gets breached 68%. The difference is zero (p = 0.84). The collar is ~$22B in notional. The S&P 500 is a $45 trillion market. FinTwit is claiming that 0.05% of the market creates a "hard ceiling" for the other 99.95%. The current Q2 call strike is 6865. If SPX approaches that level this quarter (and it will), the base rate says 68% chance it breaks through. Don't let someone else's narrative keep you out of the trade. $SPX $SPY $JPM
English
@alphaticaio The interesting thing is: monthly expected move for April on SPX also show around 6905. Even if you discount JPM collar; my understanding is price digests around these areas before moving to next zones? I’m not seeing that this time.
English

@NoLimitGains Can someone explain why United airlines is showing travel is up then?
English


BREAKING: The BBC has reported that there appears to be "insider trading consistently happening in the Trump administration before announcements."
English
@HedgeFundFomo “The Dow Jones Industrial Average (DJIA) plummeted 508 points, or 22.6%, in a single day—the largest one-day percentage drop in history” - so, this?
English

Just spoke to 2,000 Wall Street Bankers
They all told me that tomorrow will be a BLACK MONDAY Crash of epic proportions
There is nothing that can be done to reverse this
English

@alifarhat79 Create the fear on Friday after market close then Sunday when things open - btd; Monday before market opens - “oh an agreement was made” - giga pump.
Rinse repeat
English

Me after trusting Trump and going all long over the weekend
English
@alphaticaio Not to be argumentative but wouldn’t that be a more valid stat had there not been a break in term? Ie during 8 years - the first 2 years on the 2nd term don’t have to be spent reinstating policies that might have gotten shifted by the other team
English
A lot of Fintwit accounts are posting midterm election stats right now telling you there's another drawdown coming and to wait for the dip.
They're pulling from the full midterm sample. That's the wrong dataset.
2026 is not a generic midterm year. It's a second-term midterm. There have only been four of those since 1966 and only two under a Republican president.
The difference is not small:
First-term midterm average max drawdown: -20.5%
Second-term midterm average max drawdown: -7.6%
First-term midterm average return: -5.8%
Second-term midterm average return: +12.5%
If you're using the blended midterm average, you're mixing 2022 (-25%), 2018 (-20%), and 2002 (-34%) into a dataset that has nothing to do with where we are right now. Those were all first-term midterms.
On the drawdown: our data shows second-term midterms average a -7.6% max drawdown for the entire year. We've already printed -9.92% under extreme conditions. Based on the historical pattern, that was likely the drawdown for 2026.
The market just absorbed a war with Iran, oil above $119, a 43-day government shutdown, and CPI spiking to 3.3%, and the max drawdown was still only -9.92%. The S&P 500 hit a new all-time high yesterday.
If you're sitting in cash waiting for -15% or -20% because someone posted a midterm seasonality chart, you may be using the wrong cycle.
We published this framework in December before any of this happened. 7 of 9 predictions confirmed so far.
$SPY $QQQ $SPX
Alphatica@alphaticaio
In December we published a quantitative analysis of every midterm election cycle since 1966. Four months in, 7 of 9 predictions confirmed. Zero failed. The model absorbed a U.S.-Iran war, a 43-day government shutdown, and oil above $119/bbl, none of which were in the historical dataset. What it got right: → Rate direction as the #1 variable, every major move in 2026 has been a rates story → Shallower drawdowns in second-term midterms — the -9.92% Feb-March drawdown vs the -20.5% first-term average → Front-loaded volatility with back-loaded returns; Feb-March selloff, April all-time highs → Gold as the hedge — up 68% YoY at $4,852/oz → Inflation as the key risk, CPI hit 3.3% in March via oil, exactly the mechanism we flagged On the drawdown: our data shows second-term midterms average a -7.6% max drawdown for the entire year. We've already printed -9.92% under extreme conditions. Based on the historical pattern, that was likely the drawdown for 2026. One caveat: midterm seasonality shows June as the weakest month at -2.49% on average. A shallow 3-5% pullback into early summer wouldn't violate the model. It would set up the Q3 buying opportunity we identified. Two predictions still pending. The January-to-May rate window closes in two weeks. If the 10Y holds at or below 4.26%, the bullish second-term pattern stays fully intact. Full analysis and link to article below. $SPY $QQQ $GLD $VIX x.com/alphaticaio/st…
English

Goldman: Net trading flows and positioning have not fully caught up, in our view.
US equities on the Prime book are modestly “net sold” MTD.
There is scope for net positioning to keep rising from current levels and climbing the wall of worries in the near-term (particularly as earnings resiliency comes through).
Higher.

English
BREAKING: Just 20 minutes before Trump's announcement that the Strait of Hormuz was open, massive trades hit the market.
Investors sold a combined 7,990 lots of Brent crude futures, a $760 million bet that oil would go down.
These orders were much larger than anything else at the time.
The traders made huge gains.
Unusual.
English
@NorthstarCharts I see a lot of other crosses near tops as well, confused about the accuracy of this info.
English


@MarketMike What I’m struggling with is: was this move until the end of March all the down move we’ll get? We see how quickly markets ripped higher. What are you gauging to put risk back on? Is it just a BTD scenario while we are above the gamma flip?
English
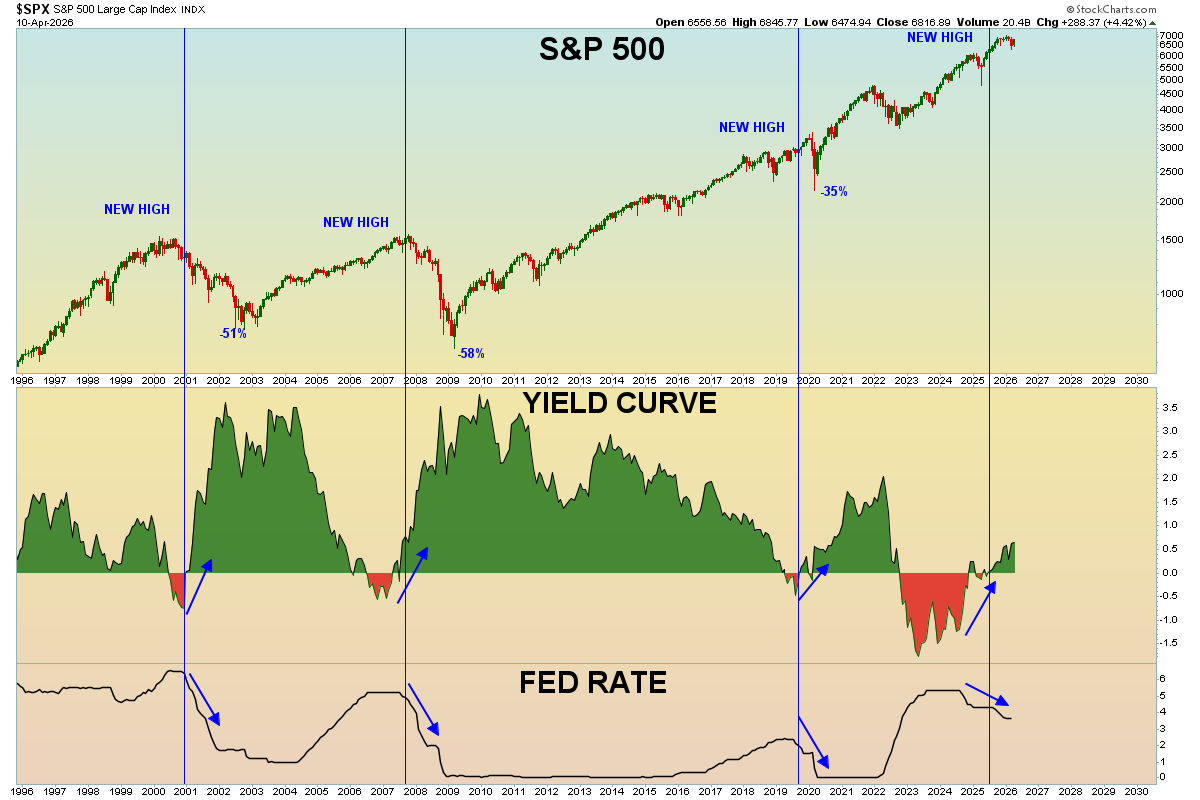
This might be the most important chart nobody is paying attention to right now.
S&P 500 on top, yield curve in the middle, Fed Funds rate on the bottom. Nearly 30 years of data.
Before every major decline over the last three decades, the same pattern played out. New all-time highs. The yield curve inverts and then un-inverts. The Fed starts cutting rates.
The Dot Com bubble. The Great Financial Crisis. The Pandemic.
Currently, S&P 500 is near all-time highs. Yield curve recently came out of an incredibly long and deep inversion. Fed cutting rates from the highest level since 2007.
I don't pretend to know what's going to happen. I just find interesting patterns in the market. As Mark Twain once said, history doesn't always repeat, but it often rhymes.
But if something bigger does play out, we're all going to look back at this chart and wonder how it was so obvious.
Then again… I know, I know. "This time is different." It always is, right?
English
@MarketMike Yeah I may have derisked too aggressively. I expected a larger pull back around the JPM collar. But also I guess I should be glad I didn’t assume more risk as we got closer to it.
English
@omohammed90 I dont put on lots of size outside ems.
I just pick and choose names that are setting up, and then trade around positions.
English

@MarketMike How are you navigating things while we’re above the daily weekly and monthly levels? I see you’re making new highs while I’ve been pretty stuck flat since Monday
English
JPM reports tomorrow pre-market.
Beat streak broken in Q4. Record FY2025. Stock +31% in 12 months. Institutions accumulating in the dark.
Street EPS: $5.46
Street Revenue: $48.56B
Alphatica Estimates:
EPS: $5.35
Revenue: $48.50B
Initial Stock Reaction: 5-day post-earnings drift is -0.35%. It's the only quarter with a negative average drift.
OUR CALL: BEAT ✅
The Q4 miss was Apple Card — a $2.2B one-time provision for the forward purchase commitment. Core business (CIB +10%, AWM +13%) was strong. 88% beat rate over 8 quarters. Avg surprise +$0.23.
OUR FOUR SIGNALS:
Earnings Quality: 3/6 NEUTRAL: Record EPS $20.02 in FY2025, but valuation allowance nearly doubled. First meaningful reserve build in this cycle. Mixed.
Disclosure Signal: CAUTIOUS: JPM cut 14.5% of their MD&A word count and restructured from four reporting segments to three. The CIB merger hides whether investment banking or commercial lending was the weak leg. Biggest vocabulary turnover in 5 years. Tone near the worst reading since 2019. When companies restructure reporting segments right before earnings, it's usually to obscure weakness.
Prediction Model: BEAT (Moderate Confidence), 88% rate but broken streak adds uncertainty. Q4 miss was provision-driven, not operational.
Earnings Risk Signal: HIGH RISK, Expected move ±2.7%. EVRP at +17.66 means options are pricing massive vol vs recent realized. Market is braced for a big move. Last time PMIE was this elevated, JPM missed.
THE FLOW:
Dark pool share climbing +6.1pp over 20 days, nearly double the GS accumulation rate. $624M block cross at $283.77 on Mar 30. DP% hit 44.5% today. Institutions loaded on the $322 to $283 drawdown and are still building.
SEASONALITY: Q1 is JPM's weakest seasonal quarter. Average 5-day post-earnings drift is NEGATIVE (-0.35%). Stock already +5% this week. Even a beat tends to get sold initially in Q1.
Numbers should beat. But the signals are more cautious than GS. Watch CIB revenue mix under the new segment structure, NII trajectory, credit provisions, and Dimon's tone on private credit.
Not Investment Advice.
$JPM $SPY $QQQ $GS $SPX

English