
Lucky Peanut
24 posts

Would have been a generational YTD if you focused on photonics + memory anon.
Every top sector long from $EWY leaps to $AAOI is up multiple hundreds of percent.
I’ve always said Photonics + Memory was the best thematically.
Now there’s subtle architecture changes:
On photonics: pluggables -> CPO
On memory: hbm3e -> hbm4
The same two supercycles.
Different upstream bottlenecks and beneficiaries.

English
@ParadisLabs @X awesome work and huge fan here. thanks for all your contributions to X!
English

You guys are f*cking awesome.
32k followers in 6 weeks is pretty insane?
Let me emphasise:
I will donate 100% of the money I ever make on @X. And I will personally match that amount from my own funds.
The charities I donate to are focused on:
1. Youth homelessness in London
2. Child welfare & protection
3. Men's mental health & su*cide prevention
I'm doing this as a fun side hobby to help as many people as I can become better investors/traders.
Also, I'm truly very sorry if I can't get back to your messages/replies/DM in a timely manner.
I'm currently balancing X with a super intense job in Finance (I'm very privileged that I'm even able to say that).
Synthesizing high quality research for X takes a lot of time. It would be easy to pour out garbage, Claude-generated posts daily!
I welcome you guys to keep messaging me until I reply though. Love interacting and learning from you all :)
I just wanna be useful!
(And no, unfortunately I'm not hiring atm lol. But thank you for the inbound open applications!)
English

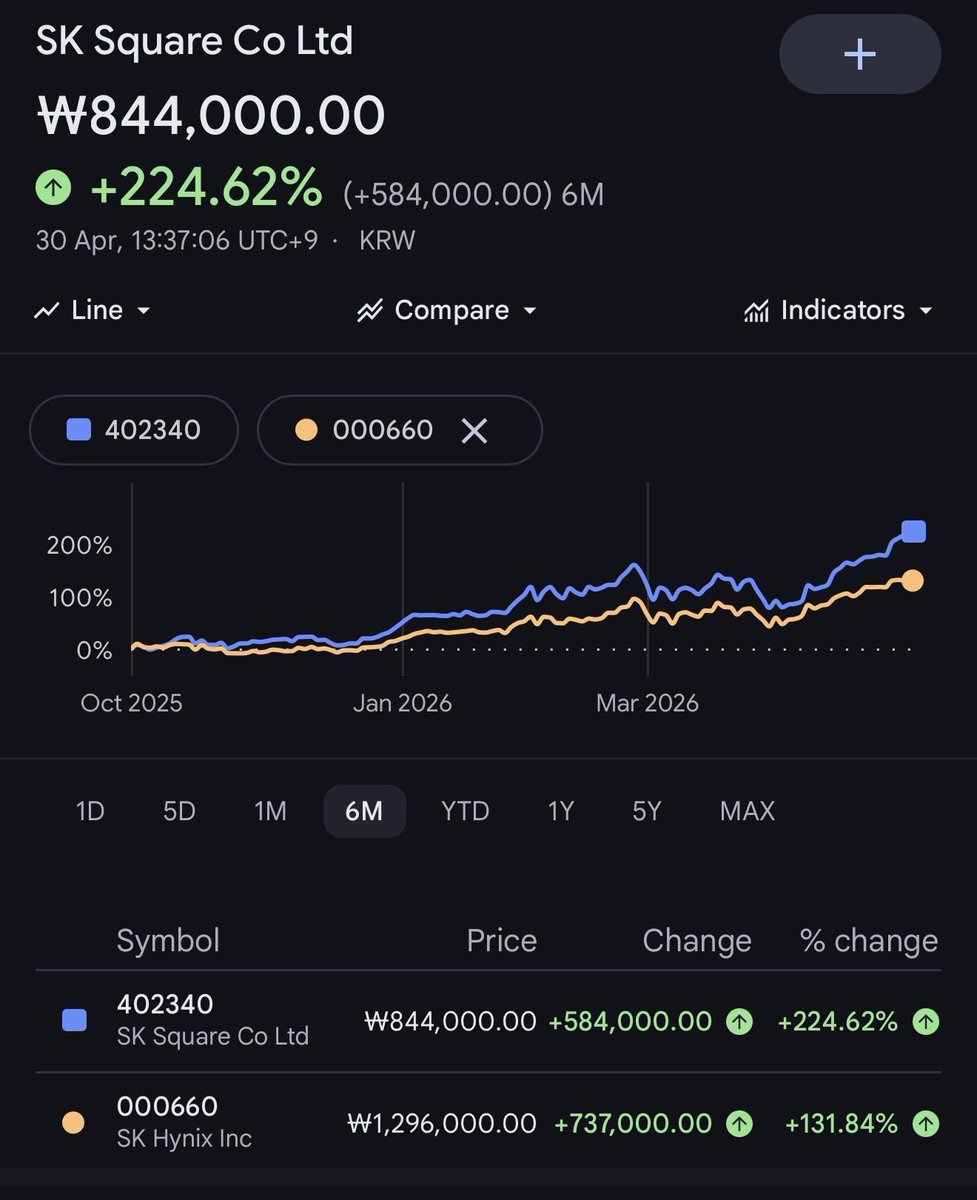
@peanutcat123 because it's trading at a massive discount to the value of its sk hynix shares' value
English
I started a fat new 30% (!!) position in
SK Square (KRX 402340).
Why this stock and why now?
Will make a very detailed post later why I think this is an insane opportunity.
English

i made my first big money in the early weed days/ wasn't quick enough to get out when it stopped working and gave it all back
minted near retirement money in the spac craze, but it took me too long to realize the show was over and ended giving most of it back /
Luckily was able to make some back full port shorting $EMBK and $DCFC both 5B+ companies now literal zeros
dance at the party but always be aware of signs for when the music stops
English
everyone has a sweet spot a style they invest/trade in whether its looking for value or momentum long bias or short / tech or bio tech etc -- but there is a optimal way it's hard but it's possible and that is simply to trade the mkt when sectors have momentum you can cry about valuations or get in tuned with the market, when the market is getting cautious you can short / if deep value isn't working stop making it try to/ if it go all in / mkt goes through trends the best way is to stay in tuned to what the mkt wants and where its headed /
English
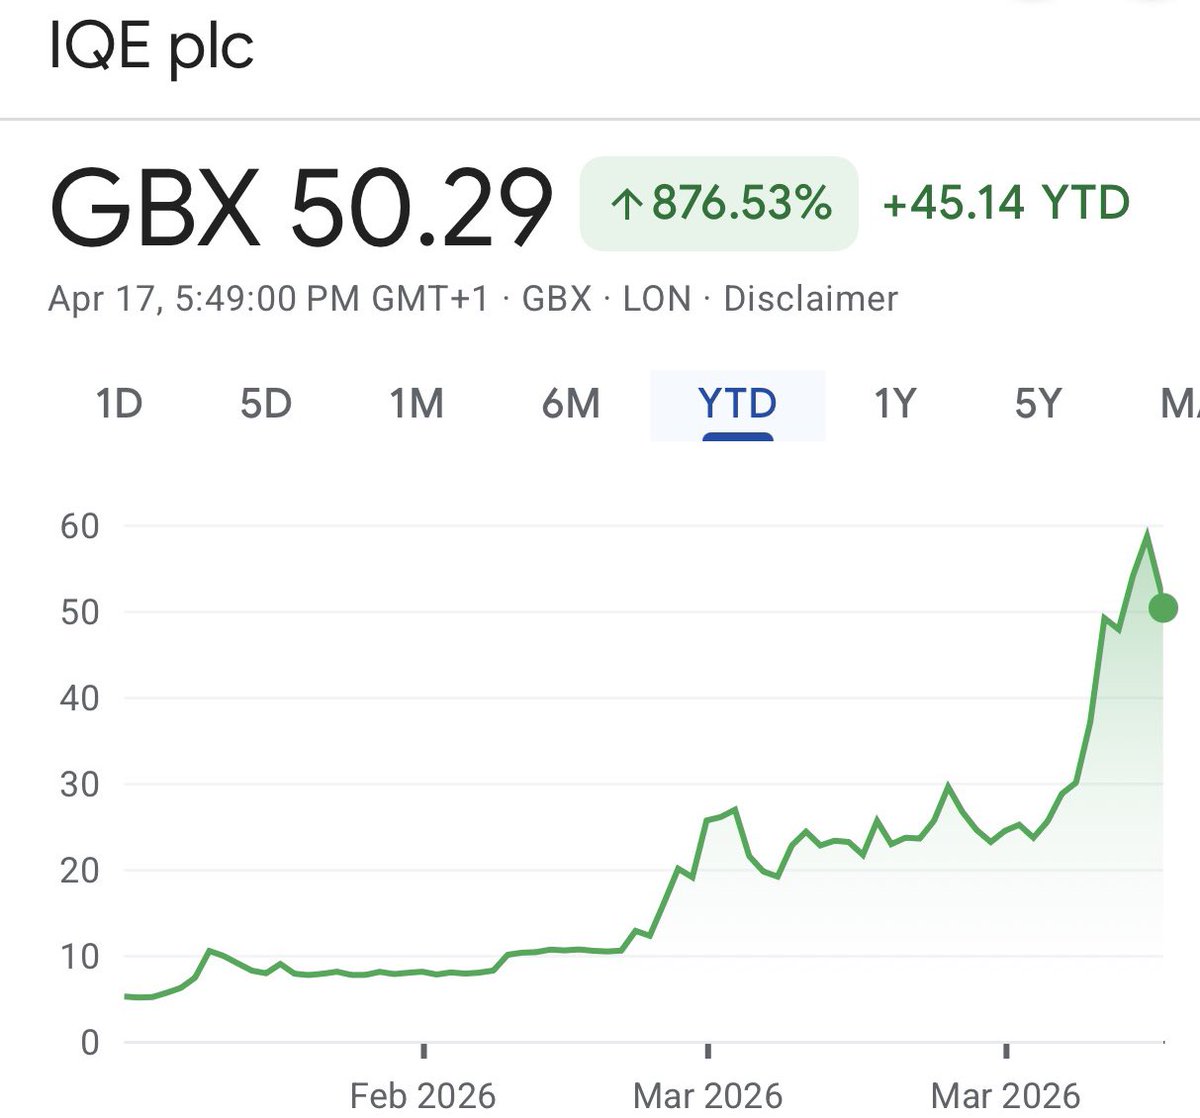
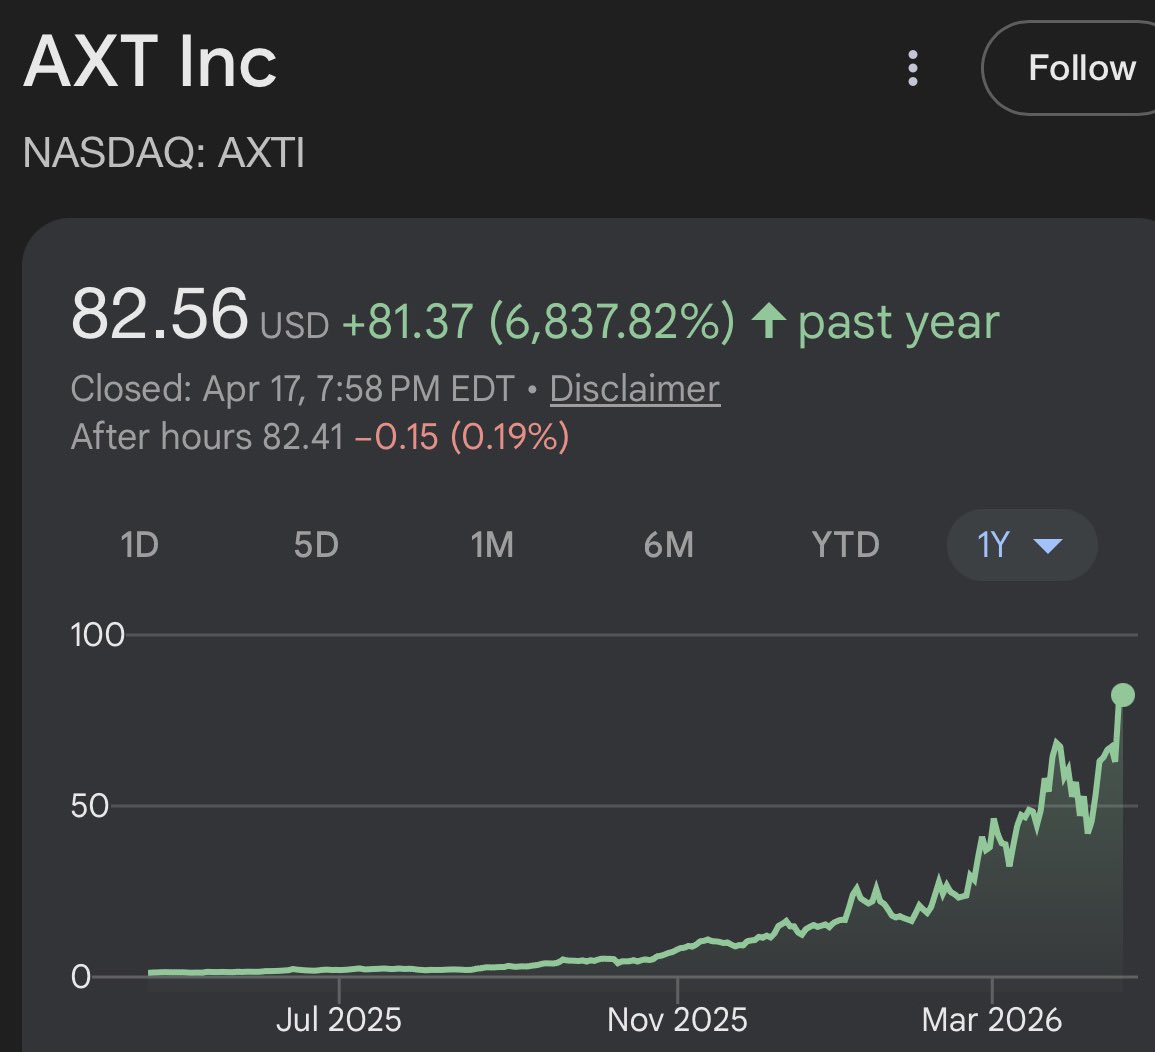
@aleabitoreddit how do you decide when to sell a position like AXTI or IQE in this case?
English
It’s still funny that there’s so many:
“If you invested $10K into ____ you would have ____ today!”
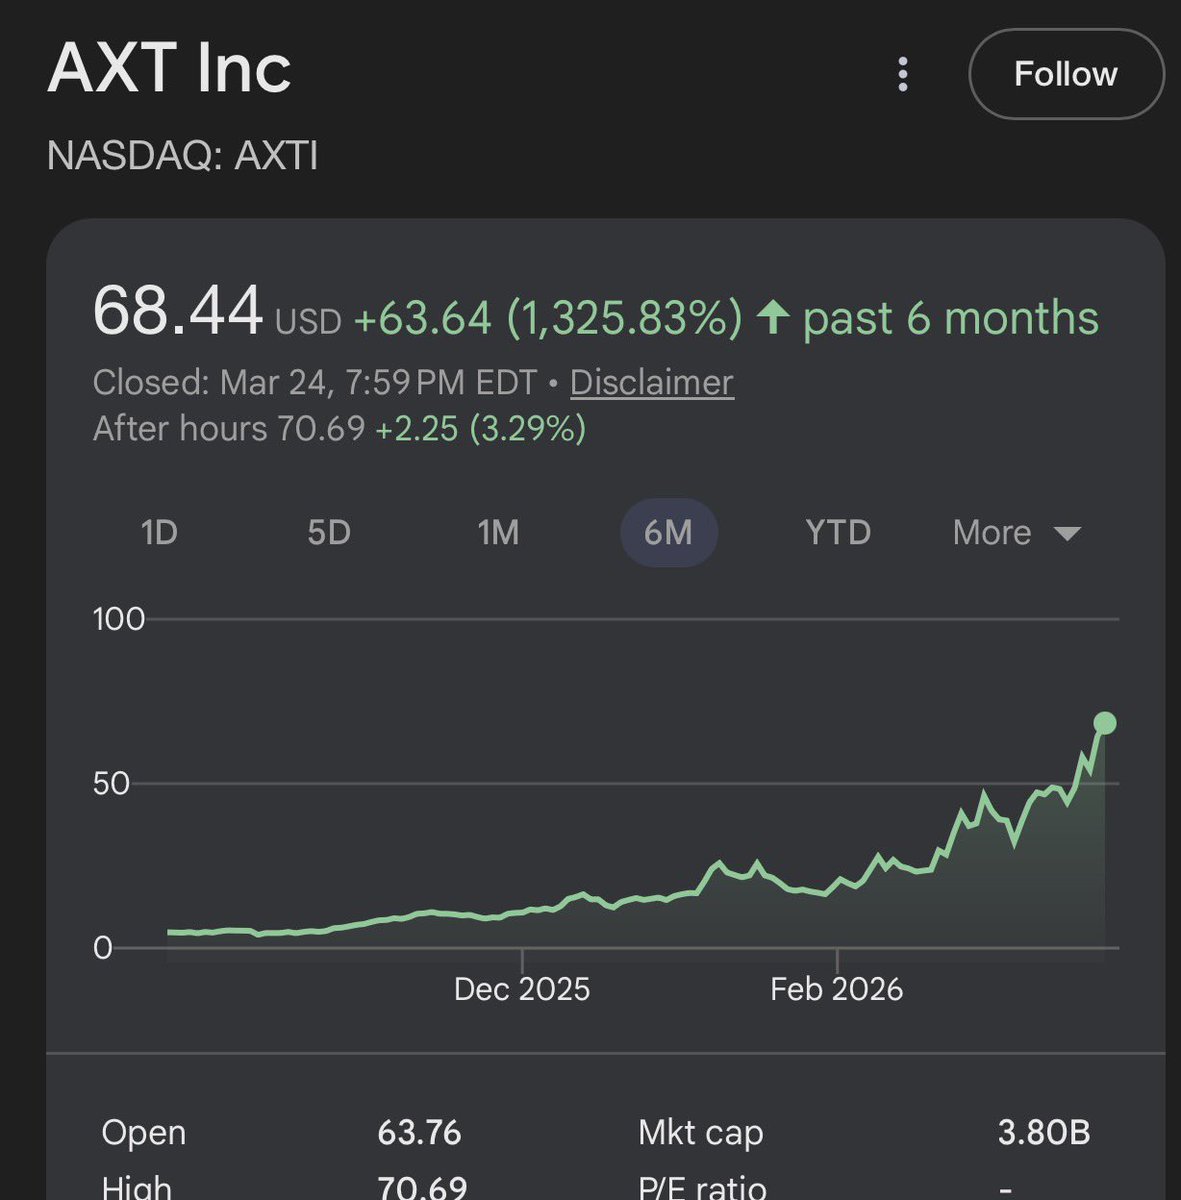
Then they’re all the stocks I was the original thesis poster on from $AXTI to $IQE.
Wait 6 months and you’ll probably see the same thing with $SIVE and my other bottleneck thesis posts.
English
@aleabitoreddit thank you so much for all the work you do. sending love from Taiwan!!!!!!!!
English
Glad to hear it!
I've went long and wrote thesis posts on about out 15 different stocks that hit 100-1000%+ YTD?
1. $AXTI
2. $AAOI
3. $SIVEF
4. $LITE
5. $IQE
6. $AEHR
7. $CRCL
8. $EWY
9. Unimicron
10. Nitto Boseki
11. $OSS
12. $GDRZF
13. $RPI
14. $SOI
15. $ALRIB
Not including others like $TSEM that are about to hit triple digit returns too in a month.
The amount of hate people like myself get for posting free ideas over the internet is pretty insane TBH.
Starting to make sense why people just set up $20,000 paywalls and sell info to Western institutions instead of helping out salty retail investors (especially over in Europe).
But helps me keep motivated to keep posting with these positive comments.
Jason@Nangjayson
@aleabitoreddit I basically skipped over the March Iran-war market drop while staying heavily exposed to stocks, and still ended up gaining thanks to your picks. Portfolio is up 3x YTD and I’m just some random retail guy from Canada, so I can only imagine how many others you’ve helped. Thank you
English
@Kaizen_Investor Congrats!!!! All the best to u and ur family
English

Guys, I became a father yesterday.
The birth was not what we hoped for as my wife lost a lot of blood and went through emergency cesarean section.
She stayed very composed while she laid our future in the hand of science and doctors we never met. Apparently, a mother knows what she has to do.
My wife and son are in great condition now.
Incredible grateful for all the doctors and nurses who helped during surgery.
English
In Singapore for the week for meetings.
Any gym/restaurant recommendations?
Looking forward to meeting a few of you who have reached out also!

English
@michaelsikand 3) how do we not know tungsten price increases already happening/might happen in the future have not already been reflected in the current stock prices already?
English

The most asymmetric Iran War trade isn't oil, plastic, or fertilizer.
It's Tungsten.
And the upside is explosive whether the war ends or not.
APT (the key tungsten raw material) was $320 in early 2025. Today it's approaching $3,000. Nearly 10x in 13 months.
It's because China imposed export controls on 41 tungsten product codes. Exports dropped to zero. And for the first time ever, China became a net IMPORTER.
The country controlling 79% of global production can't supply itself...
Meanwhile the US and Israel have burned through unprecedented volumes of munitions across the Middle East, and NATO stockpiles are already depleted from years of supplying Ukraine.
The Iran war is exacerbating an already historic supply crunch.
Tungsten is in every artillery shell, tank penetrator, missile counterweight, gyroscope, and radiation shield NATO builds. When fired at 1,700 m/s, it doesn't come back. Zero recycling. Gone forever. Rheinmetall is scaling to 1.1M shells/year. Russia burned 4.5M rounds in 2024 alone.
Only TWO western producers exist at scale. $ALM trades at $6B MC. $EQR.AX trades at $1B MC.
Yet $EQR.AX produced nearly 3x more tungsten last quarter than $ALM. It sits on 11.27M mtu worth $24.8B against a $1B market cap.
It's the lowest cost western producer. Two operating mines. First positive cashflow already hit.
Me and @KawzInvests just dropped our Tungsten deep dive on Substack. It's the most comprehensive deep dive into the tightest critical mineral market since Lithium in 2021.
S/o @BULLOFBRITAIN for being one of the first to call this insane trade.
It's a lottery ticket but the odds aren't random.

English
@michaelsikand 2) war in Iran might end very soon based on trumps comments today. This might put a dent in tungsten prices/demand and cut some of the premium that we are seeing with $EQR and $ALM prices
English
@michaelsikand Few points to your thesis: 1) china is a net importer of tungsten because they are artificially keeping supply of tungsten low, not because there is some crazy demand spike in china alone
English
@BULLOFBRITAIN The demand surge is driven mostly by the Iran war and it continuing. What visibility do u have to this continuing. If this war deescaltes enough wouldn’t that be a huge headwind to your thesis?
English

People keep looking at my Tungsten tweets like i'm a fucking schizo. It's only a matter of time before I reach goat status when $EQR.AX and $VNP.TO finally hit
Happy sailing
English
@aleabitoreddit You are a master of stocks and a master of literature
English
I keep this all over X:
Stop trying to model bottlenecks with traditional metrics like P/S or P/E…
For $AXTI:
It’s like you found a restroom after eating 20 Tacos with Pinto Beans from Taco Bell.
You’re out of the toilet paper… but it’s urgent.
A random guy next to you offers you toilet paper for $20.
But the toilet paper raw cost is $1 from Amazon.
But because there’s no supply, and you need that Toilet Paper:
You’re happy to pay $20.
That’s $AXTI with the InP substrate + feedstock supply chain and hyperscalers.

English
@aleabitoreddit I saw in your previous comment your trading strategy is to concentrate stocks around macro events. how do you determine which macro events to follow?
English
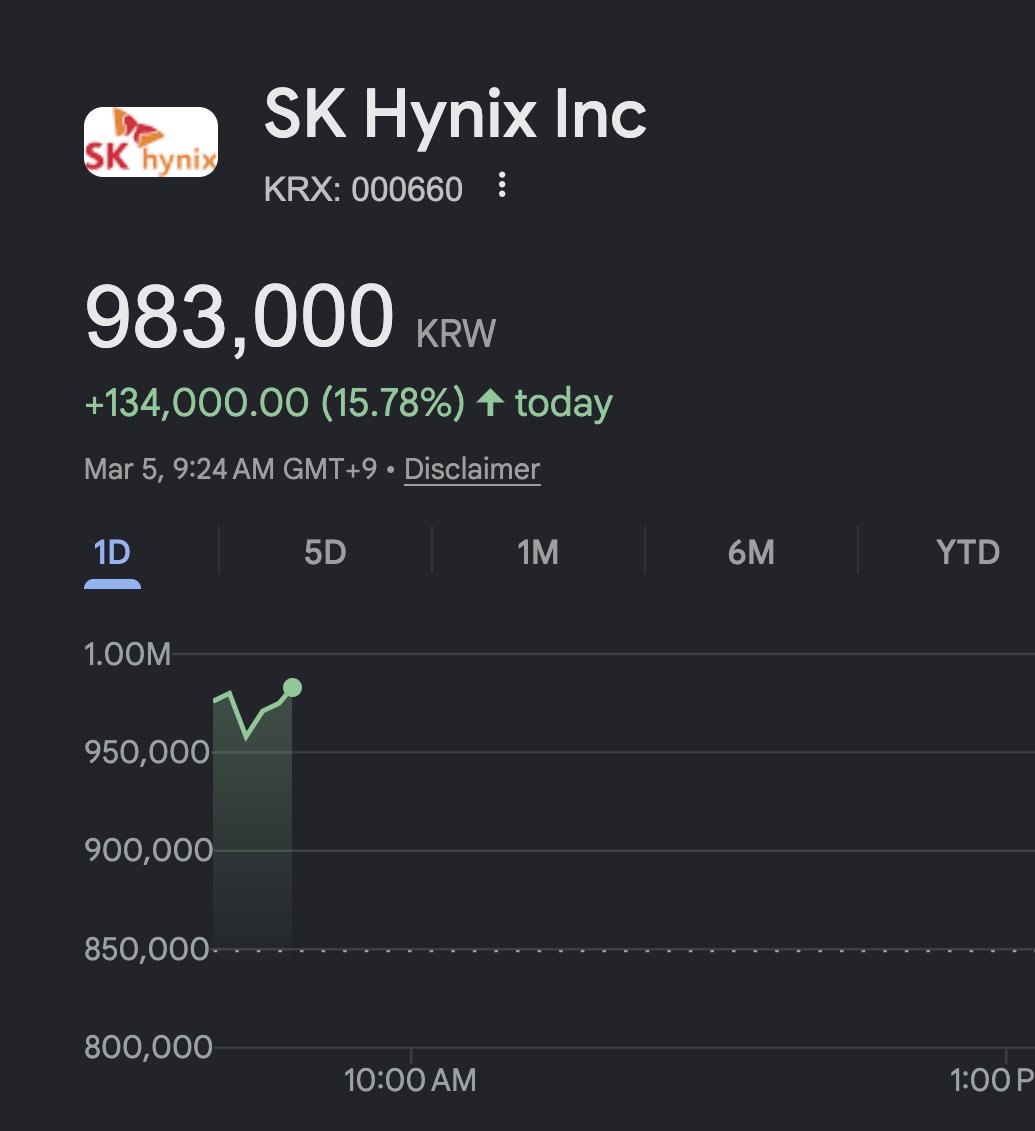
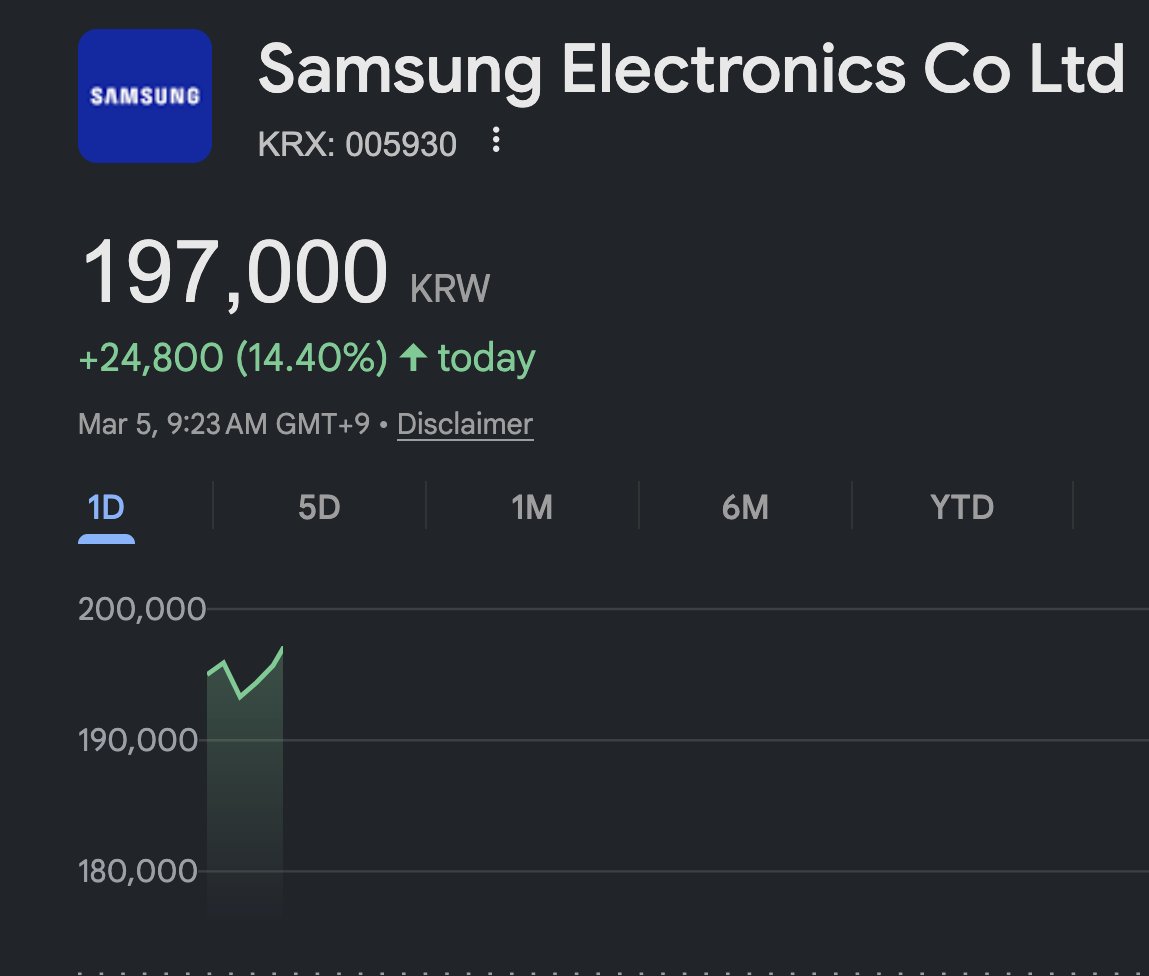
The KOSPI South Korean index is now back up: 11.6%
All the South Korean chart TA'ers calling for an $EWY drop are now suddenly deleting all their doomposts.
SK Hynix up: 15.78%
Samsung up: 14.4%
Turns out a War in Iran does not randomly halt the AI buildout.
Serenity@aleabitoreddit
Feels like everyone is doom-posting KOSPI saying: > “Look at the chart, it can’t keep going up like this!” > Memory is a black hole for demand ( $SNDK taking 3Y preorders ) > $EWY is basically just two stocks, Samsung and SK Hynix, not a representation of the Korean economy > Like saying Taiwan Index is a bubble because the index that tracks $TSM and Mediatek goes up. > Memory demand/AI doesn’t just disappear because of a War in Iran, but it does get more expensive. > Increased energy from crude/LNG get passed down to hyperscalers, not eaten up in opex. It’s looks to be fear selling and deleveraging (3x ETFs and 10x likely got wiped out today) rather than materially operational (slight bearish headwind, but not enough for -30%). SK Hynix futures is now trading in the high $300B MC-low $400B range. If MS and updated analyst projections are even slightly right, SK Hynix’s operating profits for example would be ~$300B. They’ll be sitting on too much money by 2028 as a cushion if memory prices drops. (and not even considering demand becomes structural). Looks to be another DeepSeek-Nvidia type fear selling situation, especially as nand/dram prices get hiked again recently. More of a question of timing the bottom. It’s times like these logic matter more than irrational headline selling.
English
@aleabitoreddit If IV is already above 17.5% for $XLU, are there alternative ways to play the power trade?
English
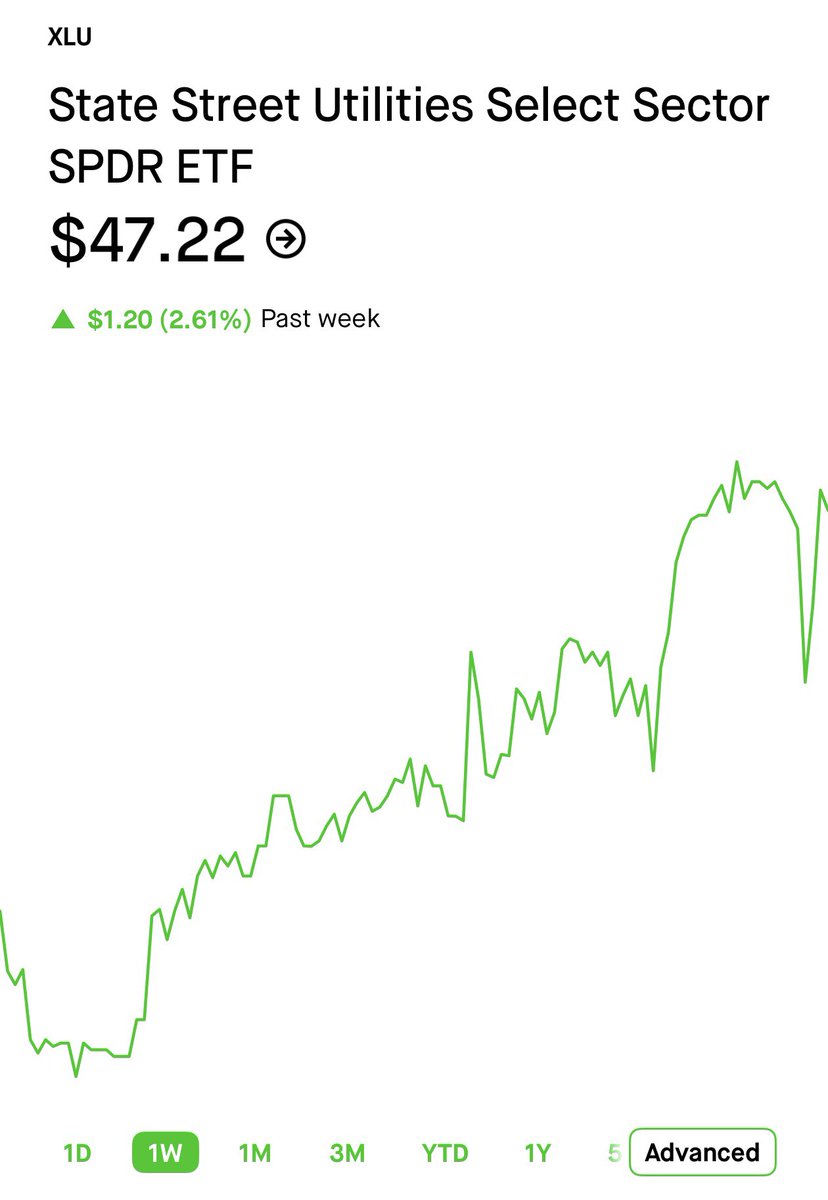
Don’t think people realize how big this move on one of the
Slowest. Moving. Sectors.
In the world is.
2.56% in a week on $XLU.
Especially if IV is 14%.
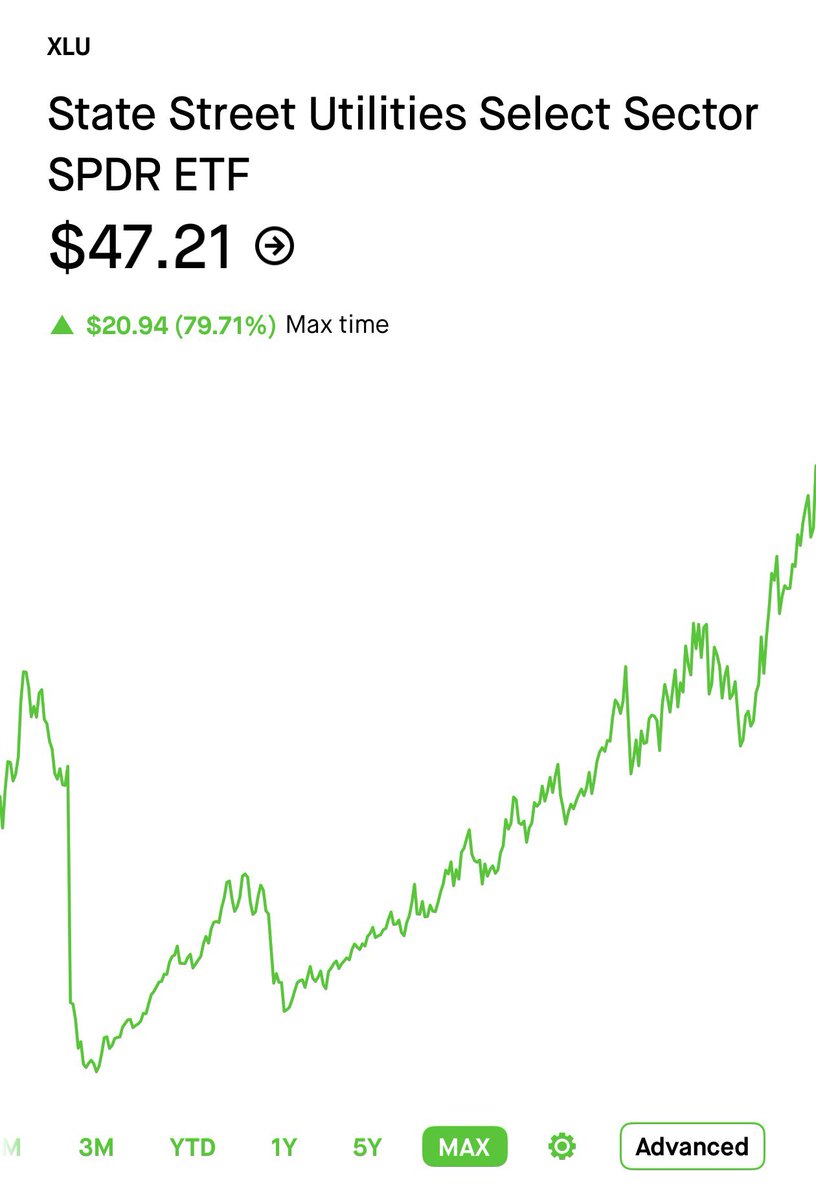
All time return since year 2000 is 79.73% for the boring power/grid sector (not including dividends).
Option values are easily up double digits or triple digits.
That being said if IV is elevated (eg. above 17.5%) probably stay away.
My thesis was this was the once in a lifetime rerating on the most boring sector in the world due to rate cuts, AI inference usage, and grid/power modernization.
Hopefully this is the start my thesis playing out.
Serenity@aleabitoreddit
If I had to turn $100k -> $1M in 1 year. It would be: $XLU OTM 2 year leaps 2026 is the first time in modern history markets have: - falling interest rates - AI inference + buildout There's a potential ~40% for XLU (1000%+ OTM), from mapping. Here's my macro thesis: 1. Rate Cuts When the Fed cuts rates without a recession, utility debt becomes cheaper, and institutional rotates low-yielding cash to for utility dividends. This causes immediate valuation multiple expansion: 1995: The S&P Utilities sector returned +31.3% in 1995 and another +12.1% in 1996 - ~47% cumulative return 2019 Mid-Cycle Cut: Result: XLU generated a +25.9% total return in that single year Standard soft-landing rate-cut cycle naturally maps to a 25% to 30% baseline return. And we're entering a new rate cut cycle in 2026. 2. The Infrastructure Supercycle Capex Infra CapEx gives the sector compounding earnings growth. Following the early 2000s, utilities entered a massive CapEx cycle to modernize aging grid infrastructure. Because they were constantly spending and expanding their guaranteed rate base, XLU returned +23.5% in 2004, +16.3% in 2005, +20.8% in 2006, and +18.4% in 2007. However this time: The $800B+ AI buildout of 2026 makes the 2004 grid modernization look like pennies. So you have Valuation Multiple Expansion (+15% to +20%), from rate cuts from #1. EPS growth (+18% to +20%) from #2 from capex spend historically. Just from a history lesson. But 2026 is the most unique moment in history from AI usage. Just from my own model projections as all former estimates are likely wrong from extreme AI ramp (eg. DOE/LBNL projections): Hyperscaler CapEx Inflows (Spend) - (Amazon, Microsoft, Meta, Google, Oracle) into DCs est: 2024: $220 Billion 2025: $350 Billion 2026: $550 Billion 2027: $800 Billion 2028: $1.2 Trillion (Growth: +445% over 4 years) U.S. Data Center Power Usage: 2024: 190 TWh 2025: 280 TWh 2026: 430 TWh 2027: 650 TWh 2028: 980 TWh (Growth: +415% over 4 years) % of Total U.S. Electricity Consumed by AI: 2024: 4.5% of the U.S. grid 2025: 6.6% 2026: 8.2-10.2% 2027: 13.4-15.4% 2028: 21.3-23.3% Lawrence Berkeley National Laboratory and the Department of Energy seem off by AI usage (they're projecting ~12% by 2028) Physical Grid Capacity Demand: 2024: 18 GW 2025: 35 GW 2026: 65 GW 2027: 105 GW 2028: 160 GW Basically you can just see 2026 into 2028 being the inflection point whereas 2024-2025 where slower years on the ramp up. Then there's the "Desperation Premium" for independent companies. Because grid capacity is sold out, tech giants are paying massive premiums to utilities to cut the line. eg. PJM Interconnection (Virginia "Data Center Alley"), capacity prices spiked from $28.92 per MW-day in 2024 to an unfathomable $329.17 per MW-day for 2026/2027. $VST or Constellation are a large weighting in the ETF as independent power producers. Across the board, you can see the extreme ramp from 2026 (now) into 2028 compared to previous years, alongside extreme capex going into building the infrastructure. 2026 is the first time in modern market history that every single thing is firing at the same time for the boring grid/power sector with AI as the biggest tailwind. And as Elon quotes it: "Billions of dollars of the most advanced hardware. Sitting dark. Not because the chips won't work. Because there's not enough electricity to run on them". Again 2026 is an absolute historical anomaly due to AI and MMs have priced in historical IV (extremely flat ~14%-16%) for OTM calls. We're seeing an explosion in AI inference (beyond previous measurements) as well as training (per OpenAI report today). So the most boring sector on earth (power/grid), might just be the start of a major rally due to hyperscaler/gov spend into grid improvements -> extreme power consumption from AI inference/training -> rate cuts and others. This is just my personal thesis, options come with risk and magnifies downside too. These are also my own projections, no certainty if they will exceed or be lower than them. But basically: 2026 is an absolute historical anomaly. New bottleneck in the US is power. There's extreme demand from AI, extreme capex, rate cuts: $XLU looks like the best trade for exposure. Time will tell if this is right or not.
English

@CharlieYouakim @sezzleinc @Tesla @elonmusk @CharlieYouakim sezzle has become my largest position. excited for next earnings!!! sezzle to the moon!!!!
English

Feeling really good about @sezzleinc MODs numbers (784k). Same ballpark as @Tesla FSD subs! @elonmusk we are coming!
Sawyer Merritt@SawyerMerritt
NEWS: For the first time, Tesla has revealed how many people are subscribed or have purchased FSD (Supervised). Active FSD Subscriptions: • 2025: 1.1 million • 2024: 800K • 2023: 600K • 2022: 500K • 2021: 400K
English
@tickerplus do you have a different view of website traffic data by individual website you can share?
English

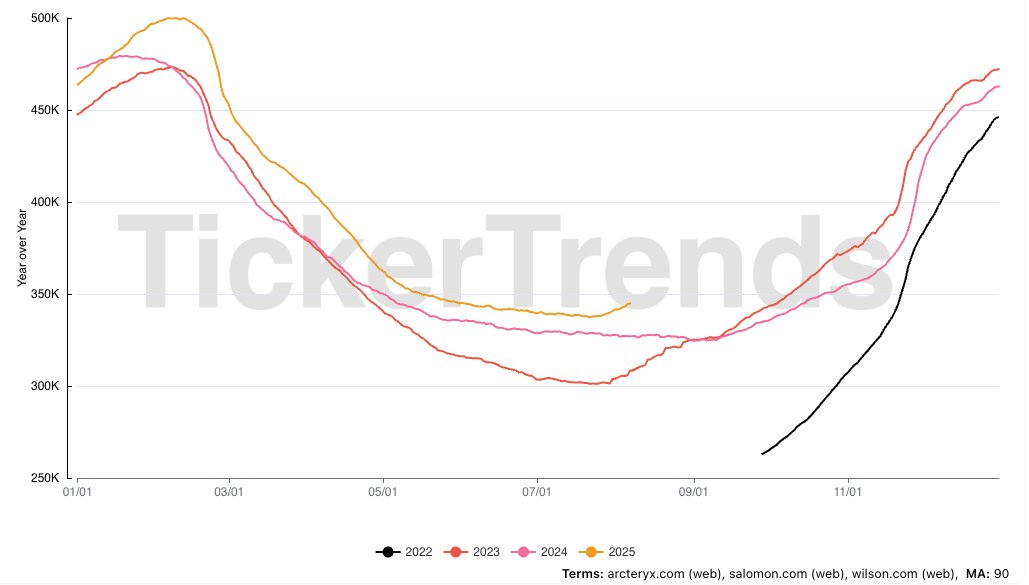
🗻 $AS Stacked YoY view of arcteryx.com , salomon.com , wilson.com aggregate website traffic
Available on TickerTrends.io
English