Matt Mills

1.9K posts

Matt Mills

Matt Mills

@statmills

Data Scientist at Intuit/Mailchimp. I like to share random musings on R, Stats, and College Football

Atlanta, GA Katılım Haziran 2010
379 Takip Edilen405 Takipçiler
Sabitlenmiş Tweet
Matt Mills
Matt Mills@statmills·
I've uploaded some CFB Data for open source use github.com/mattmills49/CF… 10 years of Team recruit rankings Draft Picks Schedule and Results
English
0
3
23
0
Matt Mills
Matt Mills@statmills·
@CFB_Data I noticed that the recruit player API is missing a decent chunk of each GT signing class that is listed on 247, and mostly with recruits who aren't given a national rank. Same with GSU. Is this a known issue? I'm happy to provide an example script and output
English
1
0
0
165
CFBNumbers
CFBNumbers@CFBNumbers·
QBs on my point rating system + their 2026 passing strength of schedule. Idea being QBs on the right side + lower on the graph have been more successful + have a softer SOS and could make some noise this year (Brad Jackson/Devon Dampier hello!)
CFBNumbers tweet media
English
6
1
37
10.5K
Matt Mills
Matt Mills@statmills·
@statsowar I’m curious how much importance/value those variables have compared to overall team or unit quality metrics? Is it additive or is it necessary more for stylistic or use case reasons?
English
0
0
0
30
parker fleming
parker fleming@statsowar·
@statmills I have some matchup/style specific controls/interactions in a model. I'm mostly moving towards player eval and away from team eval so i don't know how deep I'll run down that rabbit hole but happy to share notes/discuss
English
1
0
0
361
parker fleming
parker fleming@statsowar·
Working on some team style evaluation: one of the biggest edges in recruiting is understanding how players plug into your scheme. This shows teams on two dimensions (gap vs zone, heavy pers vs spread), with the clusters on full suite of style variables in colors. Teams closer together are more similar on the two main style classifiers, teams in the same color hull are more similar across the entire menu of variables.
parker fleming tweet media
English
9
15
106
72K
Matt Mills
Matt Mills@statmills·
@atlurbanist @Boenau My understanding is the biggest at risk group from drivers are pedestrians and cyclists outside of the car; I would bet Waymo is much safer for this group than a normal Uber. The aggressive driver on the highway is not taking a Waymo instead. Still a huge win.
English
1
0
1
27
Darin Givens
Darin Givens@atlurbanist·
@Boenau Honest question (I genuinely don't know the answer): are Waymos significantly replacing trips made by deadlier human drivers, or are they adding trips to the road -- while the same number of deadlier drivers still exists alongside them?
Atlanta, GA 🇺🇸 English
4
0
3
442
Andy Boenau
Andy Boenau@Boenau·
According to Waymo's published data, their technology is preventing injuries & deaths. If that's true, then we safety advocates should be welcoming AV technology. If Waymo is lying or manipulating data, then by all means people should be exposing that. Instead the analysis of skeptics boils down to "the authors of the Waymo safety report work for Waymo." FFS, are we going to toss out reports about how bike lanes improve safety because they were written by people who ride bikes? Are we going to toss out the decongestion pricing reports because they were written by the transit employees who want transit to succeed? I hope not! Here's what we've recently been told by Waymo: ✅ 170.7 million rider-only miles driven without a human driver (equivalent to roughly 200 human lifetimes of driving). ✅ 92% fewer serious injury or worse crashes compared to human drivers in the same cities and conditions (0.02 incidents per million miles vs. 0.22 for humans; 35 fewer such crashes). ✅ 83% fewer airbag-deployment crashes in any vehicle (230 fewer crashes). ✅ 82% fewer injury-causing crashes overall (544 fewer crashes). ✅ 92% fewer pedestrian injury crashes compared to human benchmarks. ✅ 85% fewer cyclist injury crashes. ✅ 81% fewer motorcycle injury crashes. ✅ No fatalities caused by the Waymo Driver across these 170.7 million driverless miles. ✅ At current scale (over 4 million miles per week), Waymo prevents 1 serious injury crash every 8 days. If people find the data has been manipulated or false, then it'll be widely reported because let's face it, many people are hoping AV companies fail. But at the moment, a bunch of otherwise very good traffic safety advocates come out looking like people who only approve of solutions that aren't shaped like a car. That type of approach is going to set back Vision Zero advocacy in places across the country that are on the fence about allowing autonomous vehicle operations. Waymo does have a profit motive. So do corporations who build homes, distribute food, host concerts, publish books, and make medicine. Not all of them are the same and some are downright awful. Be a skeptic. Consider motives and incentives. What's interesting about Waymo is that they have a financial incentive in being the absolute safest form of motorized vehicle on the street. They'll lose business if their software is just as dangerous as an average human driver. But that in no way means streets must be overtaken by motor vehicles (theirs or any other brand). What do we want? 92% fewer pedestrian injury crashes compared to humans? 85% fewer cyclist injury crashes? Then come up with a way to let AVs into cities across the country.
English
17
7
66
3.9K
Matt Mills
Matt Mills@statmills·
@stevehou How so? This is just a scarce physical good with very high status signaling having a ton of demand. NYC isn’t even an AI town with tons of VC money flowing in to that industry like SF.
English
0
0
1
62
Matt Mills
Matt Mills@statmills·
@HowEPhil This is one of the arguments I wish people made more. More people means more tax payers and more customers for small businesses. Spreading our fixed costs over more people would actually lower the cost of city services per person
English
2
1
9
398
Matt Mills
Matt Mills@statmills·
@atlurbanist As multiple other commenters have pointed out this article is total BS. If you get upset when someone shares out of context, misleading, BS about how transit makes the city worse then why don’t you put the same effort in to educating yourself on this topic?
English
0
0
1
205
Darin Givens
Darin Givens@atlurbanist·
Georgia grapples with drought, but its data centers are using millions of gallons of water. One in Fayetteville used 30 million gallons without initially paying for it, while lowering water pressure for residents. politico.com/news/2026/05/0…
English
6
117
283
65K
Matt Mills
Matt Mills@statmills·
@analyticsaurabh The shortest players are not the best these days; Jokic, LeBron, Giannis, Wemby, KD, etc... Take your pick, but you are starting with someone 6'9" or higher. And really only Steph Curry has been in contention for a short player being the best recently.
English
1
0
1
78
Matt Mills
Matt Mills@statmills·
@bburkeESPN Thanks for being open and sharing these detailed of results. Did y'all explore monotonic constraints on the features? I'm not sure if some of these PDP make 100% sense; should it ever be better to bench less, all else equal?
English
0
0
0
28
Brian Burke
Brian Burke@bburkeESPN·
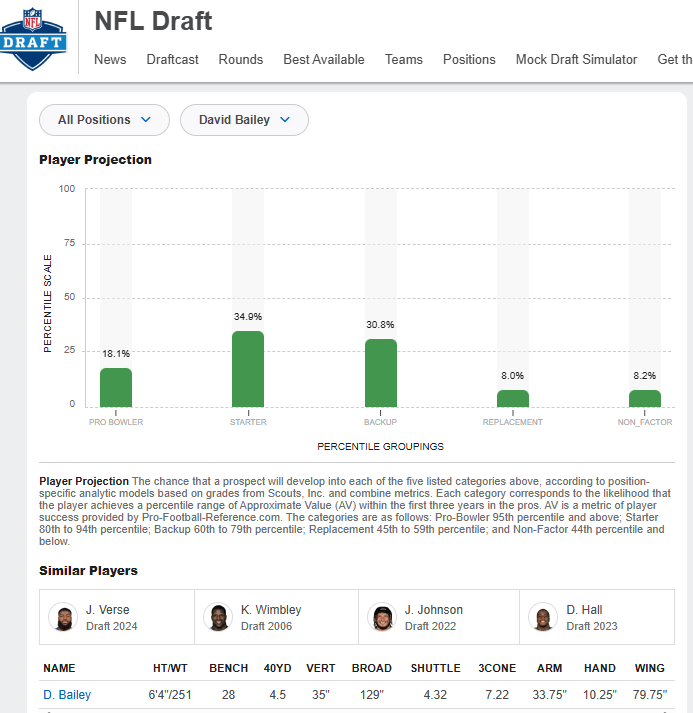
The scouting grade dominates the model, but there is still clear signal from the Combine metrics despite some modest noise. Here are partial dependence plots for RBs even after factoring in the grade. Faster, stronger, bigger --> good.
Brian Burke tweet media
English
1
1
3
1.7K
Brian Burke
Brian Burke@bburkeESPN·
We've published the 2026 draft projections. This year features a much improved model. The projections are based on prospect grades via Scouts Inc plus combine metrics. espn.com/nfl/draft/proj…
Brian Burke tweet media
English
6
14
74
49.5K
Matt Mills
Matt Mills@statmills·
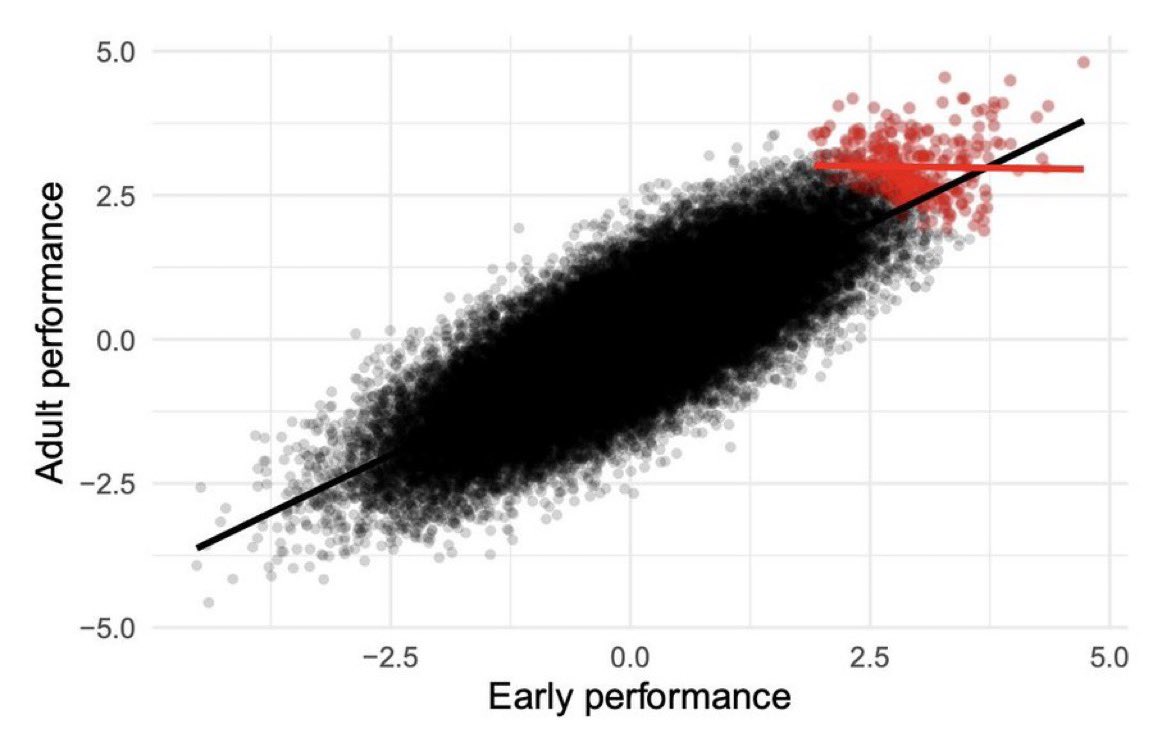
You can extend Gradient Boosting to fit many more models than just target predictions. My blog post from earlier this week walks through how you can fit the coefficients of smoothing splines with Gradient Boosting statmills.com/2026-04-06-gra…
Matt Mills@statmills

I have a new blog post out today that I'm really excited about. I walk through how you can use Gradient Boosting to fit entire vectors of parameters for each observation, not just a single prediction.

English
0
0
0
73
Matt Mills
Matt Mills@statmills·
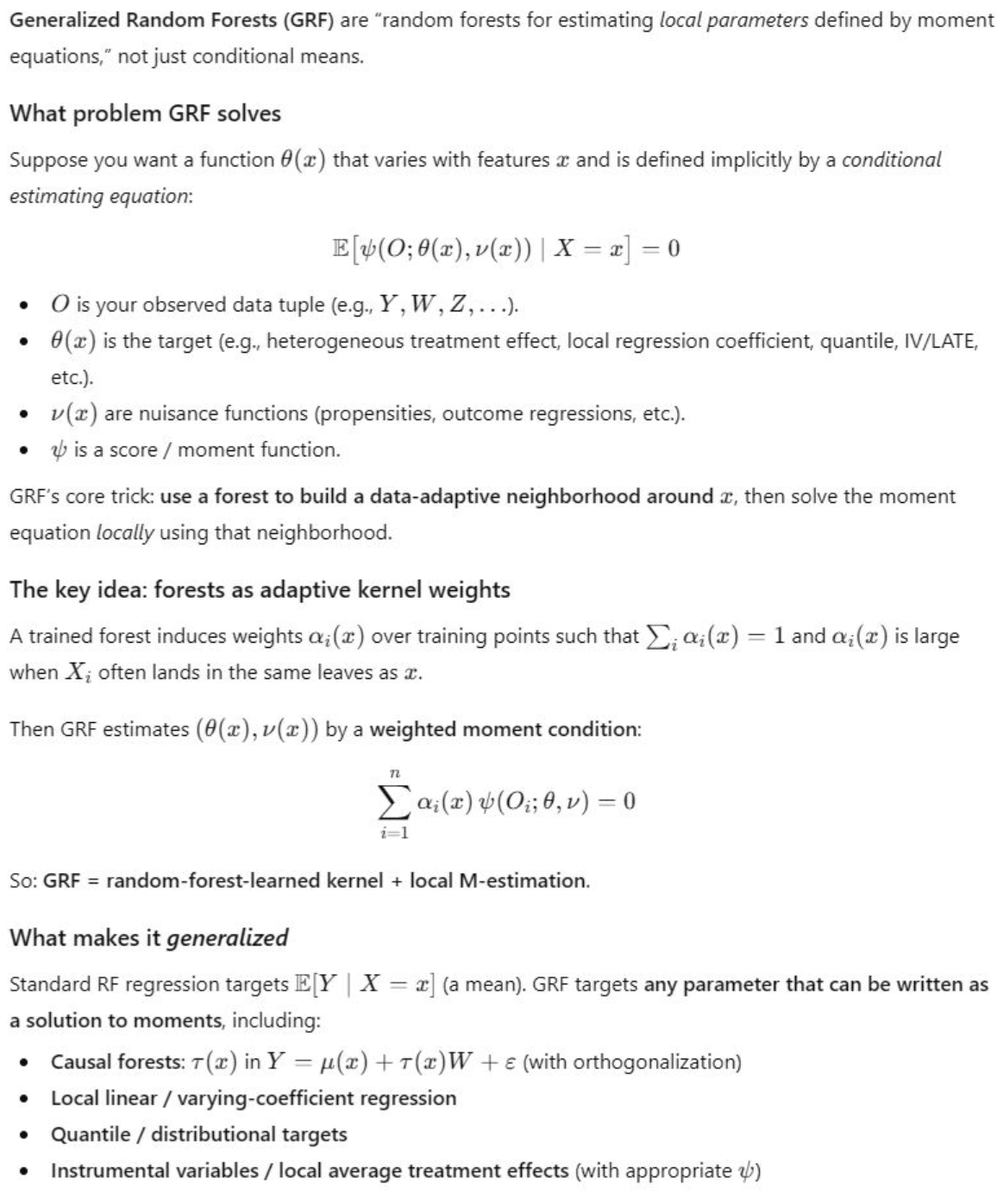
@DuaneJRich I have had GRFs saved to follow up on for a while and seeing this tweet inspired me to lean in and led to a somewhat related post. I know AI can explain things better than any textbook now, but I still enjoy rolling up my sleeves and digging in myself. x.com/statmills/stat…
Matt Mills@statmills

I have a new blog post out today that I'm really excited about. I walk through how you can use Gradient Boosting to fit entire vectors of parameters for each observation, not just a single prediction.

English
0
0
0
23
DJ
DJ@DuaneJRich·
One thing I’ve lost is the motivation to write purely technical blog posts. On those topics, AI explanations are really good these days. I still write occasionally (see the True Theta Substack), but only when I can add some applied experience that I know isn’t in an LLM training set. For example, I had “Generalized Random Forests” in my queue because I’ve always been impressed by the concept. But just look at ChatGPT’s explanation. If I’d written this, I’d be proud. To arrive at an explanation like this, you have to grok the math well enough to reduce it to an intuitive, memorable mechanism. What makes up for this is the habit of asking questions about these topics. You can calibrate the explanation exactly to your level. You can ask for simulations, analogies, and case studies. I've noticed a few mistakes but not more so than I've also noticed in textbooks. It does make me wonder whether we’re in a temporary sweet spot. I’m sure this explanation is so good because it reflects the central explanation from the GRF paper, the intros of other papers that reference it, and explainer blog posts like the one I’d write. For that reason, I hope technical writers find new motivation.
DJ tweet media
English
1
0
13
960
Matt Mills
Matt Mills@statmills·
The result is smooth curves that can learn high dimensional interaction effects that you can fit at scale!
Matt Mills tweet media
English
1
0
0
39
Matt Mills
Matt Mills@statmills·
I have a new blog post out today that I'm really excited about. I walk through how you can use Gradient Boosting to fit entire vectors of parameters for each observation, not just a single prediction.
Matt Mills tweet media
English
1
0
0
159